What is Google Search Console?
Google Search Console is a free service that allows bloggers and SEOs to manage and monitor their site’s performance in Google Search. It was formerly known as Google Webmaster Tools.
Google Search Console provides SEOs and bloggers with insights into how Google crawls, indexes, and displays their website on its search engine results pages. It also notifies you of potential issues and errors (crawl errors and index errors) that may prevent Google from crawling and indexing your site.
Google Search Console provides you with several details about your site and content, including:
- The sites that link to your site
- The index status of your content
- The search queries your site appeared for
- The position of your content in search results
- The impressions, clicks, and click through rate (CTR) from Google Search
Besides providing these details on its dashboard, Google Search Console also sends you email notifications when Google encounters spam and other issues that may prevent it from indexing your content.
In this article, we’ll cover:
Getting Started with Google Search Console
To get started, you will need to set up a Google Search Console account. If you already have one, you may also want to add other users. We will show you how to do both below.
1 How to Set Up Google Search Console
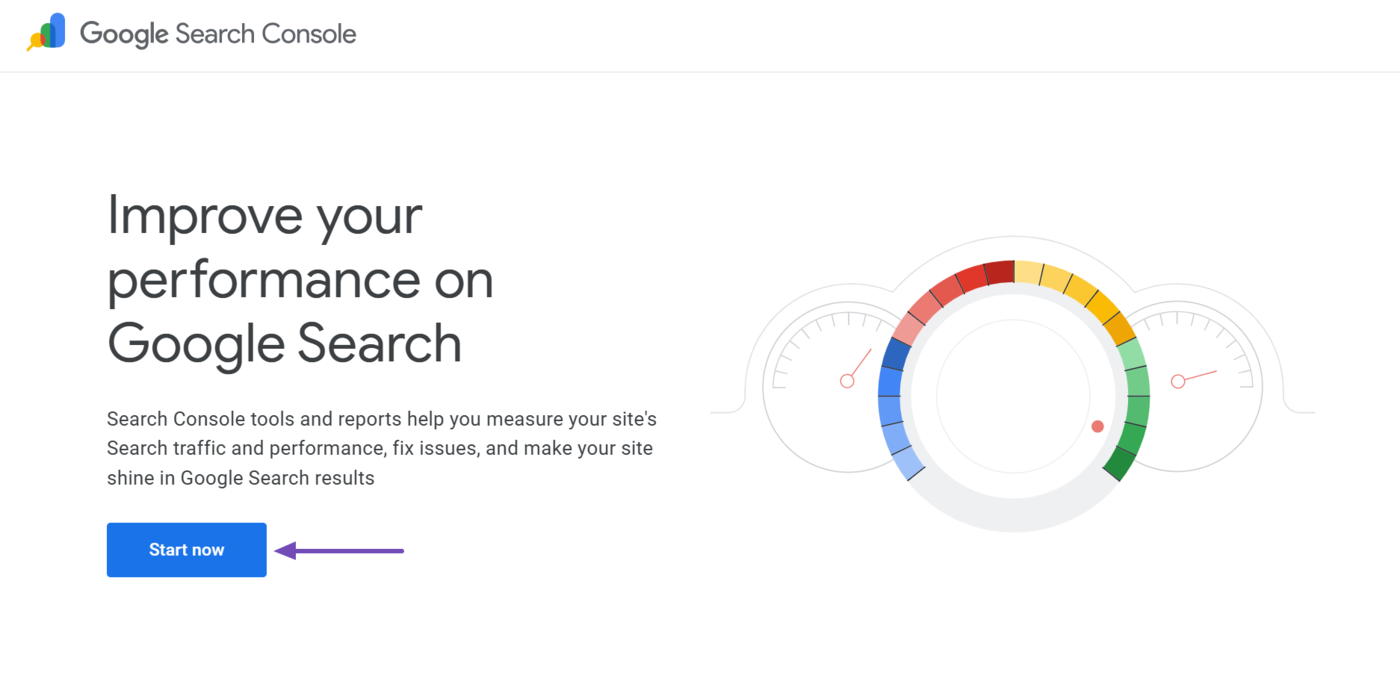
Head to the Google Search Console login page and click Start now.
Once done, log in to your Google account. Google Search Console will present you with multiple verification methods. You can refer to this guide on verifying your site in Google Search Console.
2 How to Add a User to Google Search Console
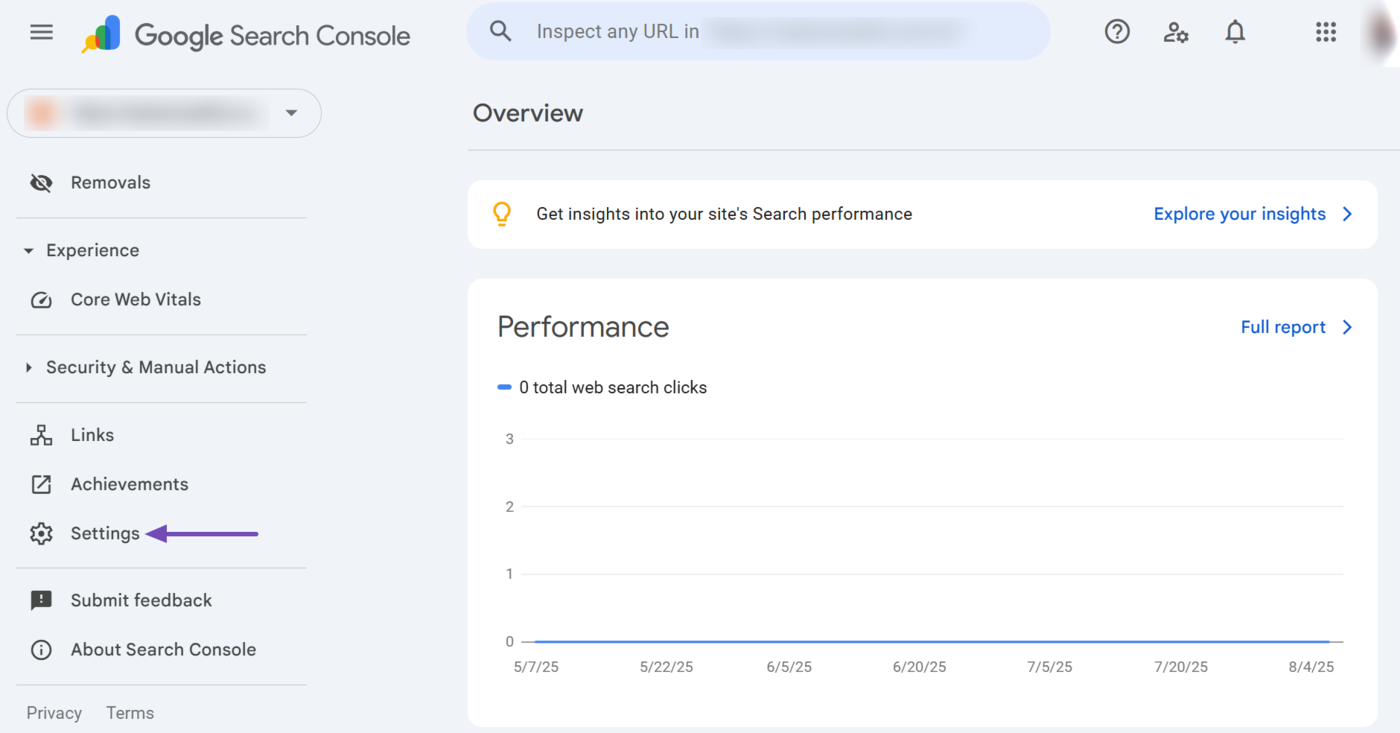
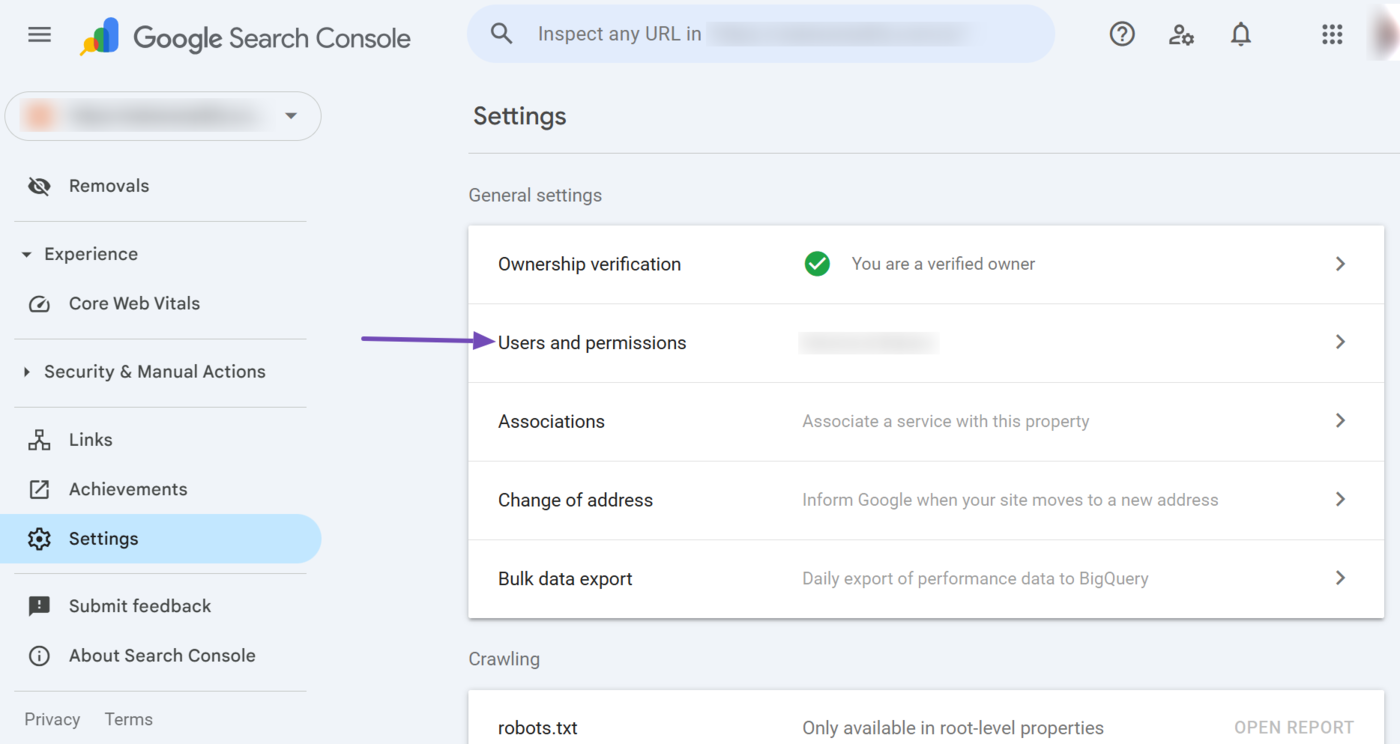
At one point or another, you may need to add other users to your Google Search Console account. To do that, head to your Google Search Console dashboard and click Settings.
Next, click Users and permissions.
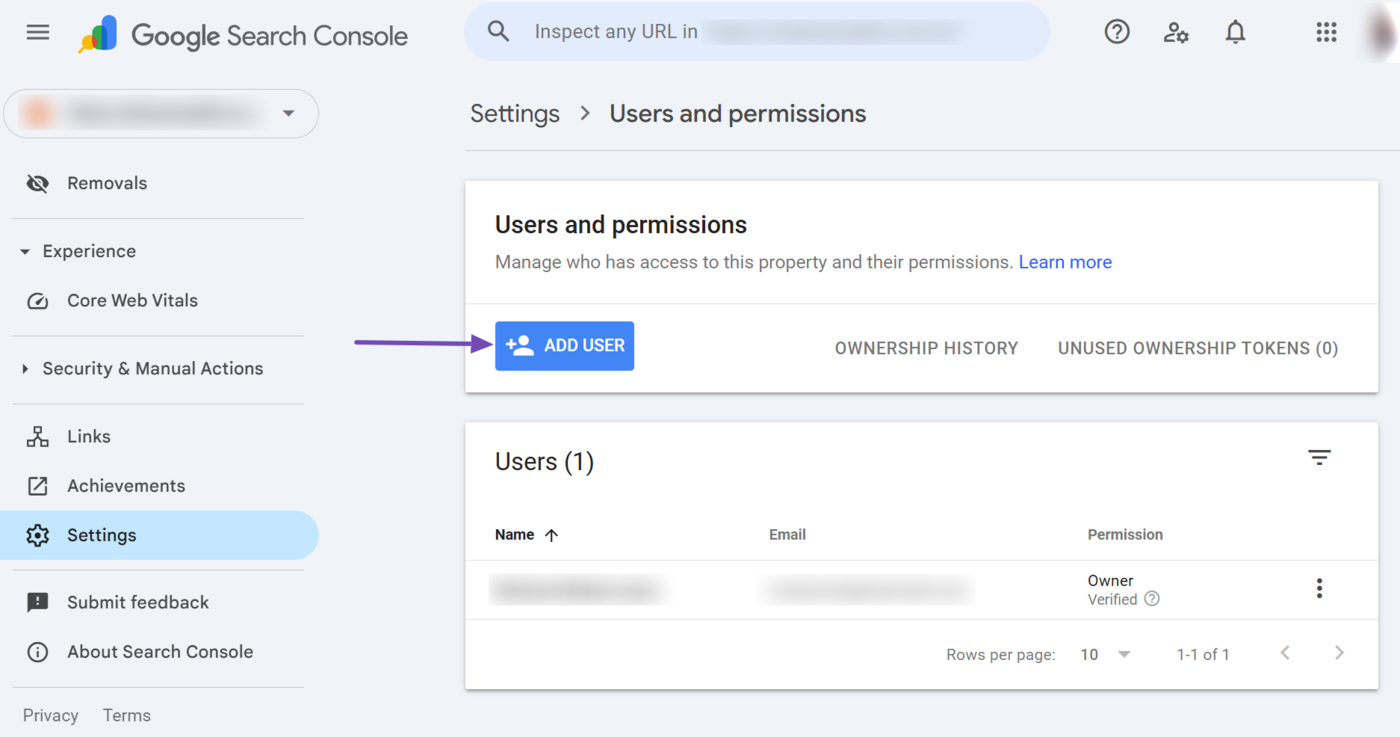
Now, click Add User.
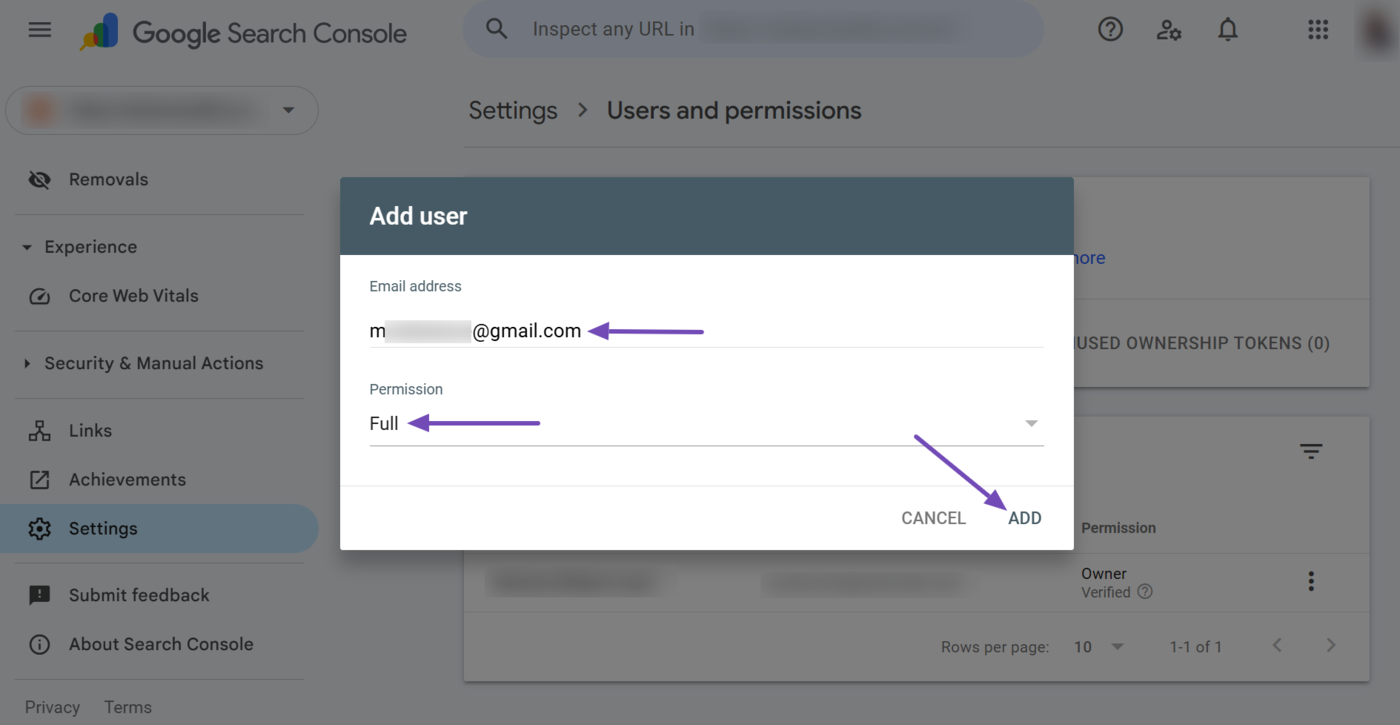
Once done, enter the Gmail account of the new user. You will also select their permission type from the available options:
- Owner: The owner has total control over the Google Search Console account. They can add and remove users, adjust settings, and view all data and reports.
- Full: The full user has nearly the same level of control as the owner. They can perform almost all actions within the Google Search Console, except for a few, like adding new users.
- Restricted: The restricted user has limited access to certain features and data in Google Search Console. They can view selected reports and data, but cannot change their settings or manage other users.
Once done, click Add.
Options Available in Google Search Console
Google Search Console provides analytics data and options that allow you to view, inspect, and modify your site’s performance on Google. Let us address the available options one after another.
Note: The tabs, reports, dropdowns, and options displayed in Google Search Console will often differ depending on the content you publish, the issues Google detects, and the metrics Google gathers from your site.
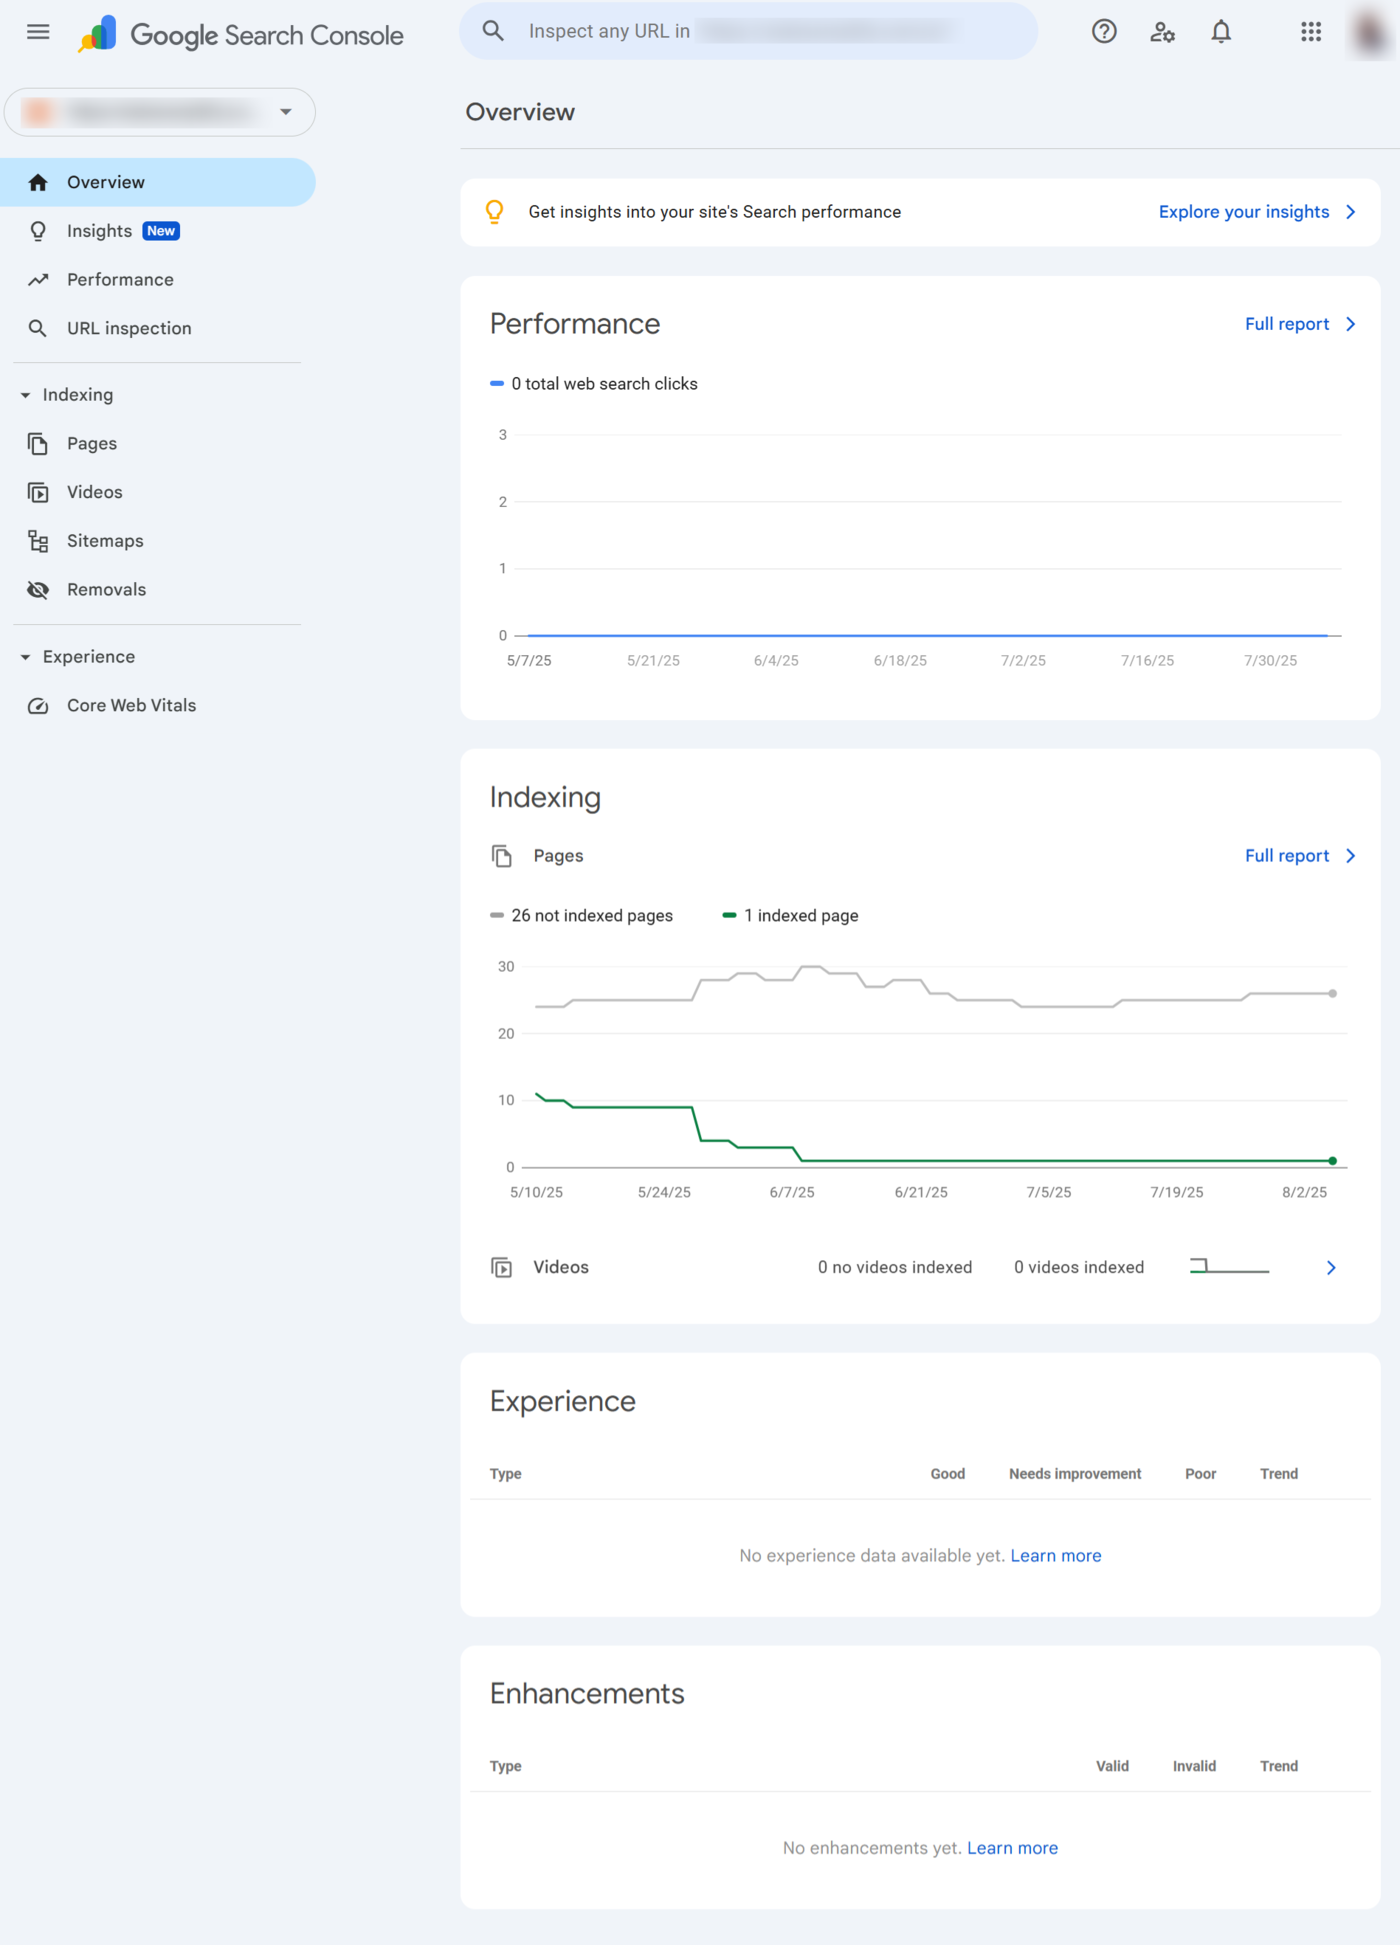
1 Overview
The overview page summarizes the reports and key metrics informing you of your site’s performance. It contains the links or summary of several reports and tools, including:
- Insights
- Performance
- Indexing
- Experience
- Enhancements
a. Insights
The insights tool provides a comprehensive report of your content’s performance. It combines data from Google Search Console and Google Analytics and shows you actionable information, including:
- Your content’s performance over the last 28 days
- Which of your content is receiving more traffic
- Your most popular content over the previous 28 days
- How your visitors found your site
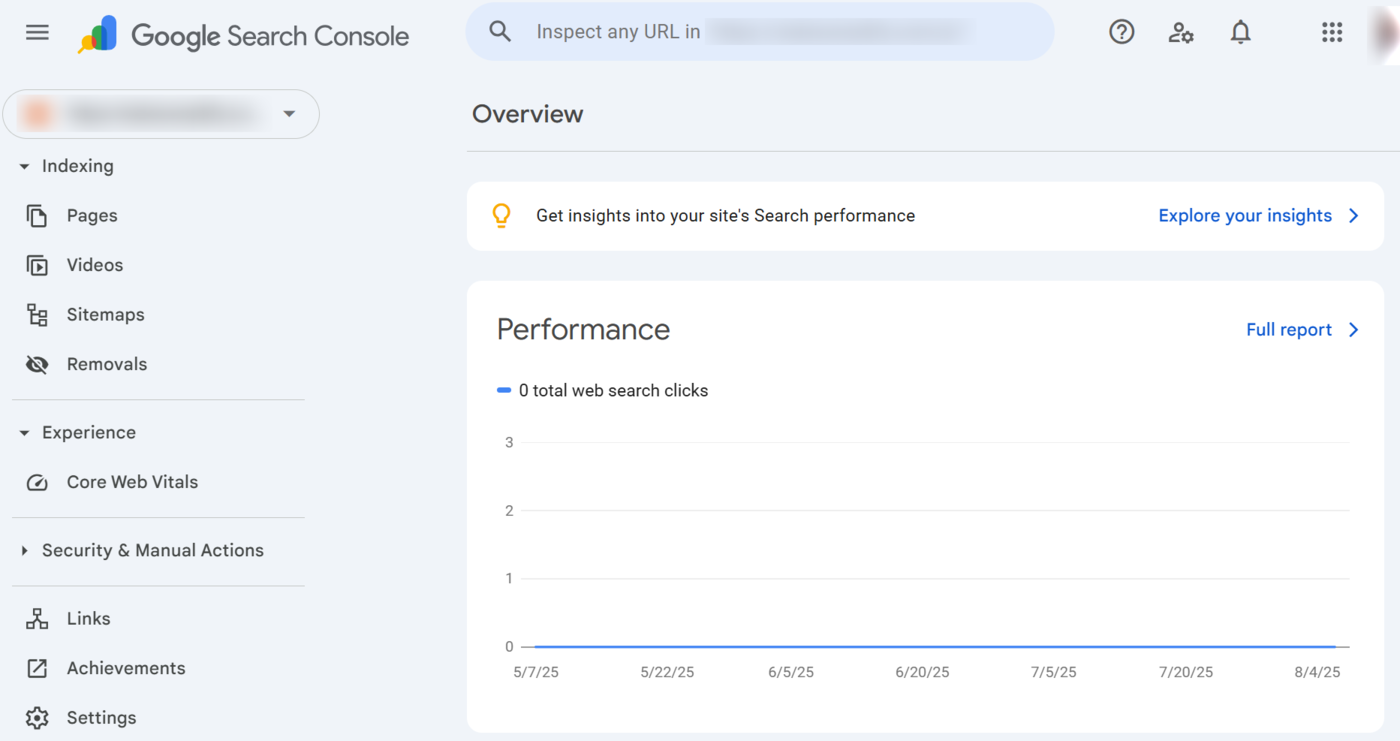
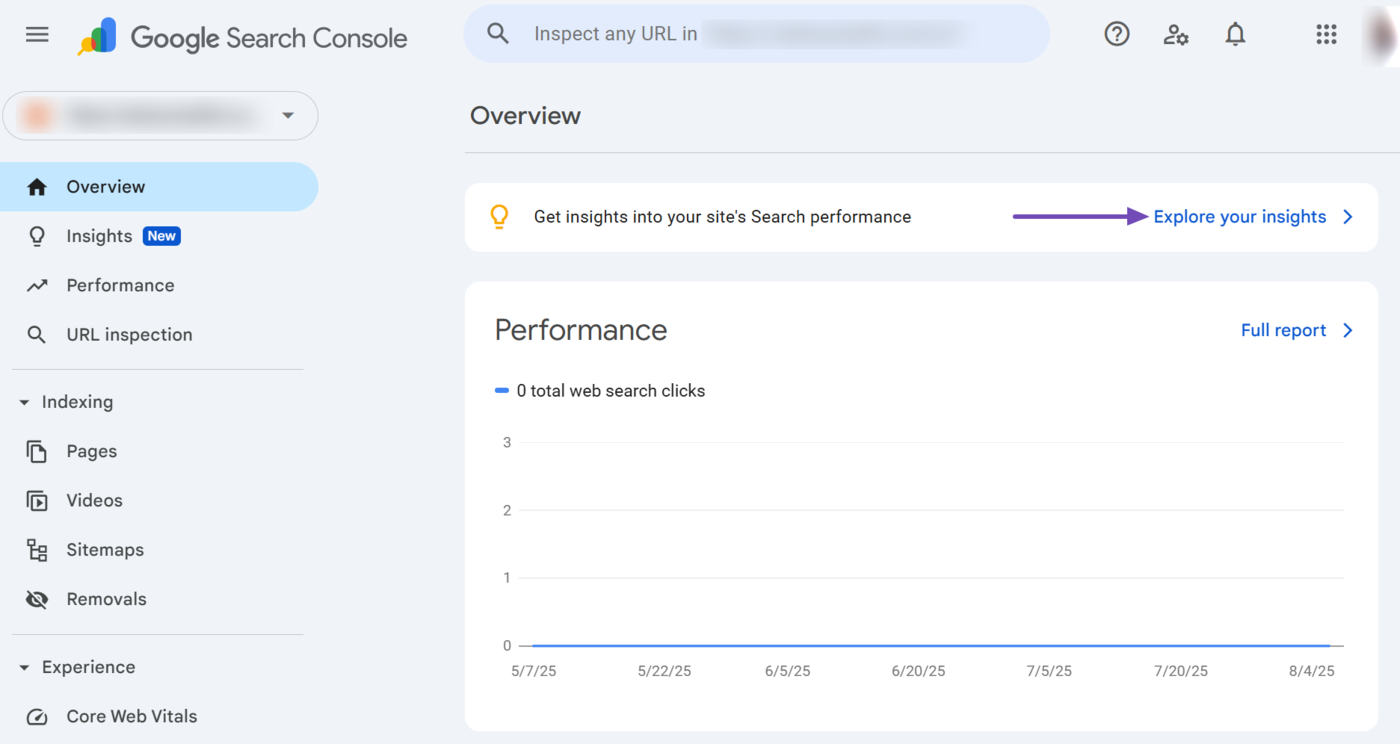
The insights section does not display any report on the Search Console dashboard. Instead, you will click Explore your insights, as shown below. Once done, it will redirect you to the Insights tool.
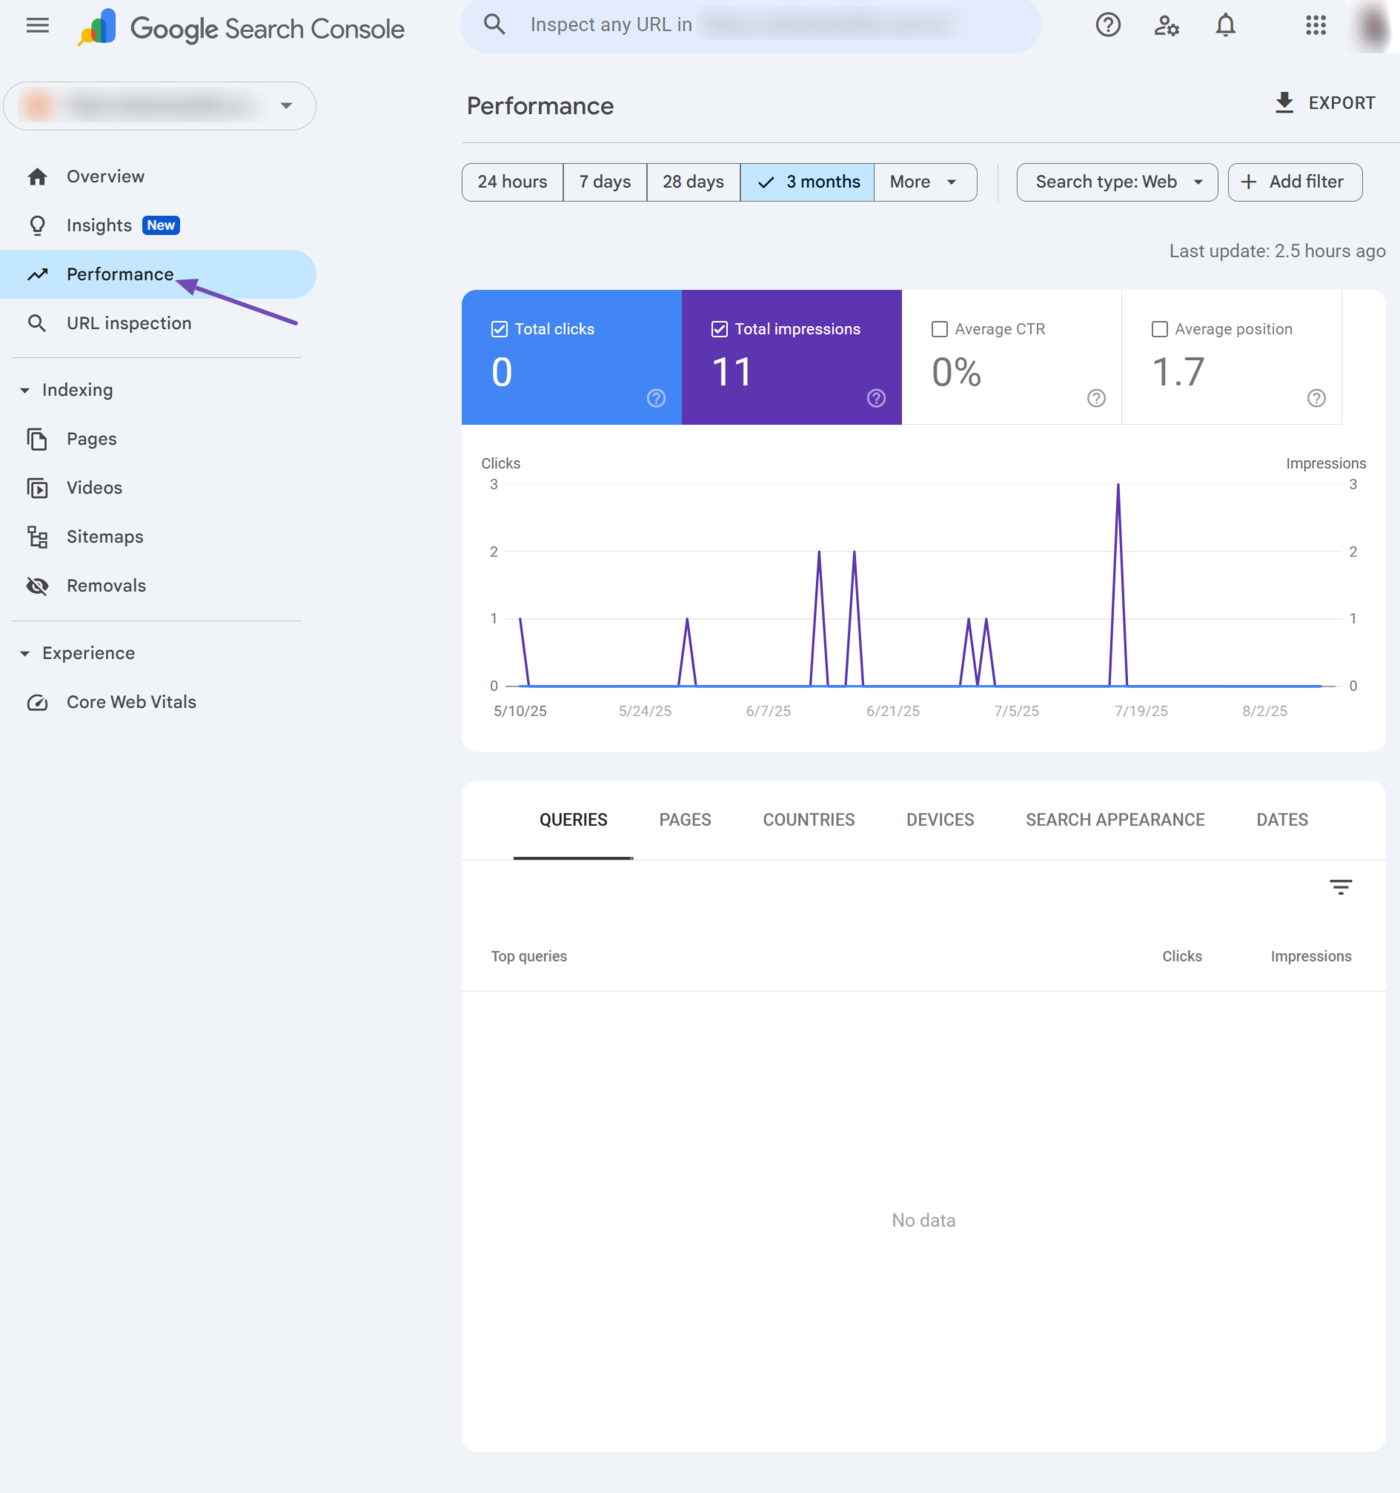
b. Performance
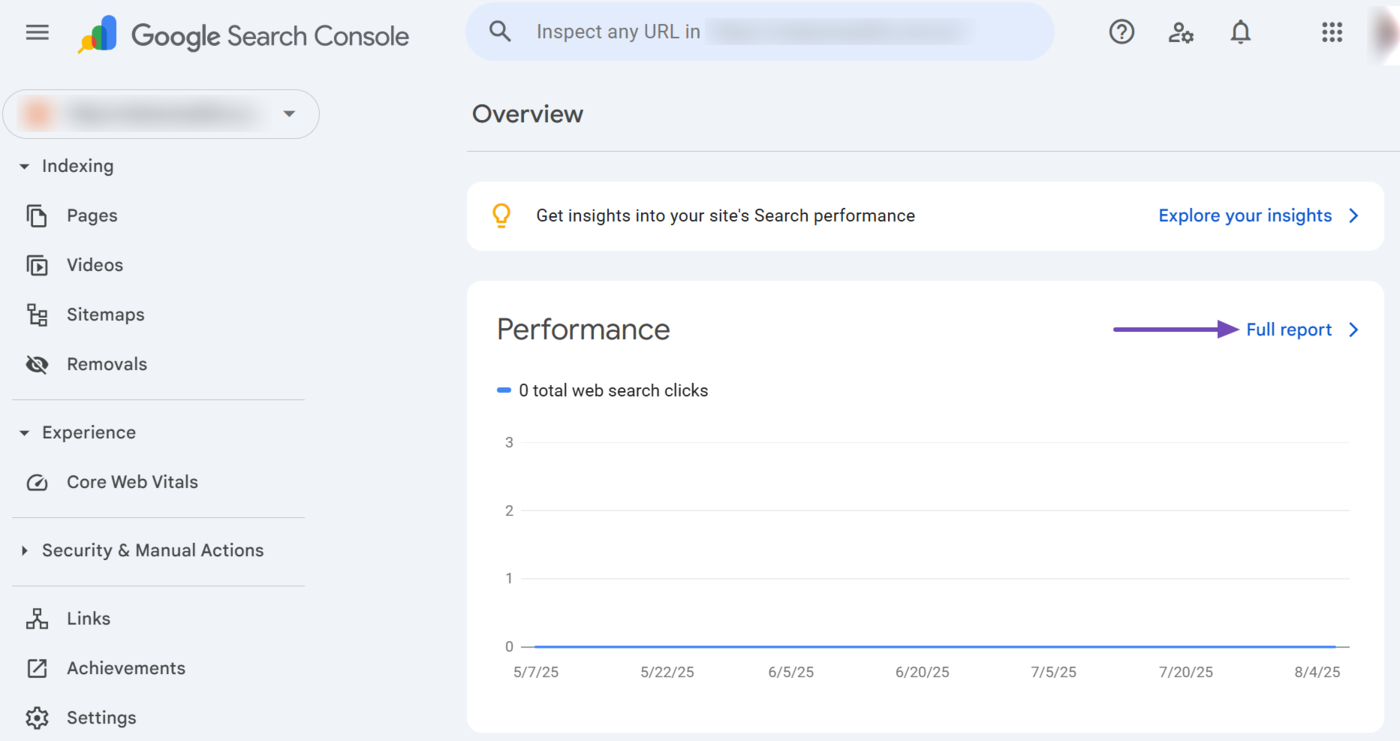
The performance section shows the number of visitors that clicked on your site from the Google search results pages over the last three months.
This section is a summary of the performance report. You can open the performance report by clicking Full report, as shown below.
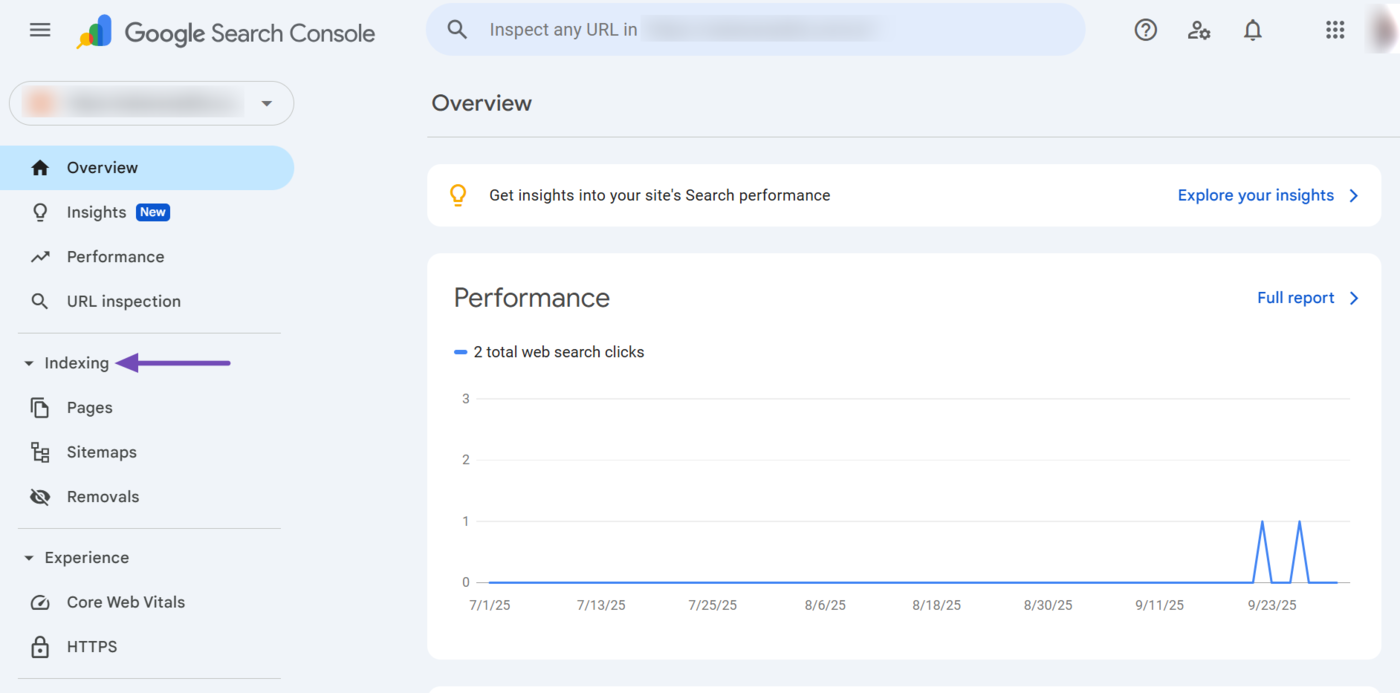
c. Indexing
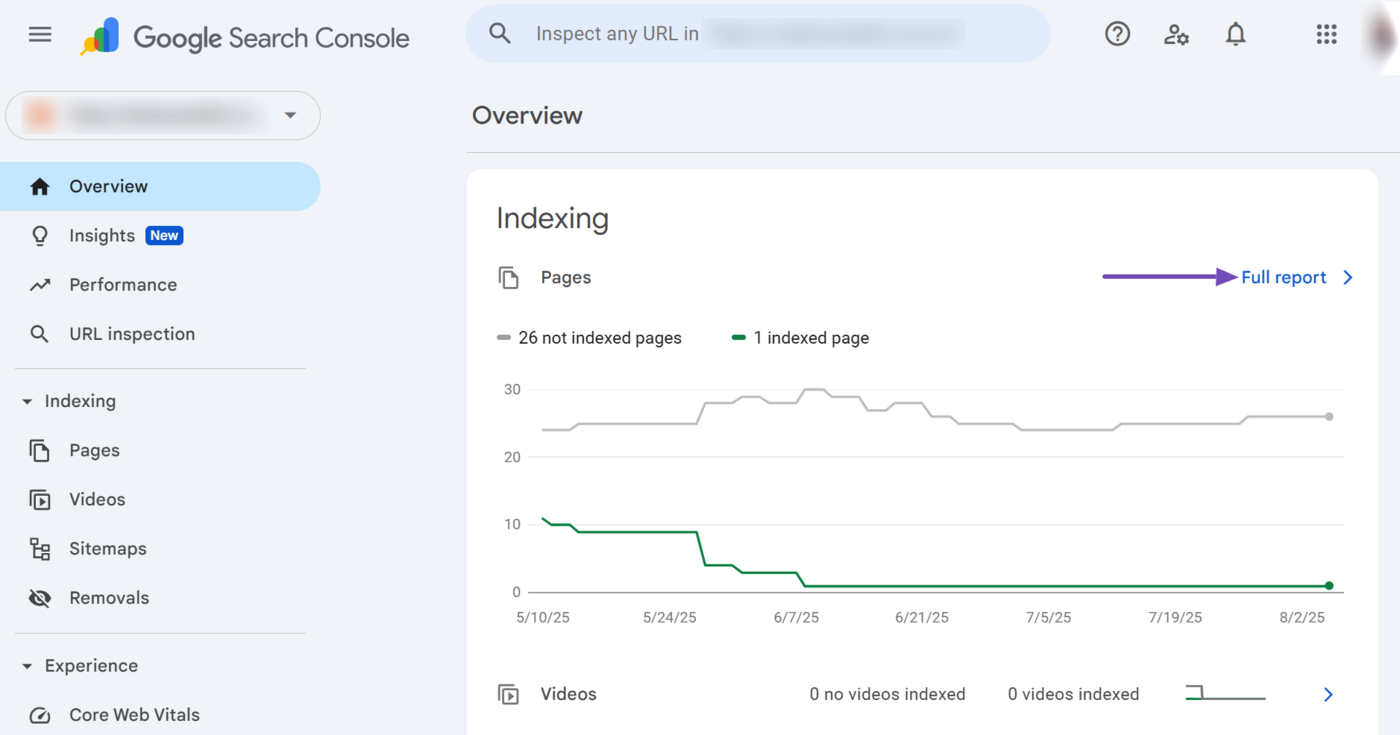
The indexing section shows you the number of indexed and unindexed pages on your site. It also shows you the number of pages indexed on a specific day.
This section is a summary of the page indexing report. You can click Full report to open the page indexing report.
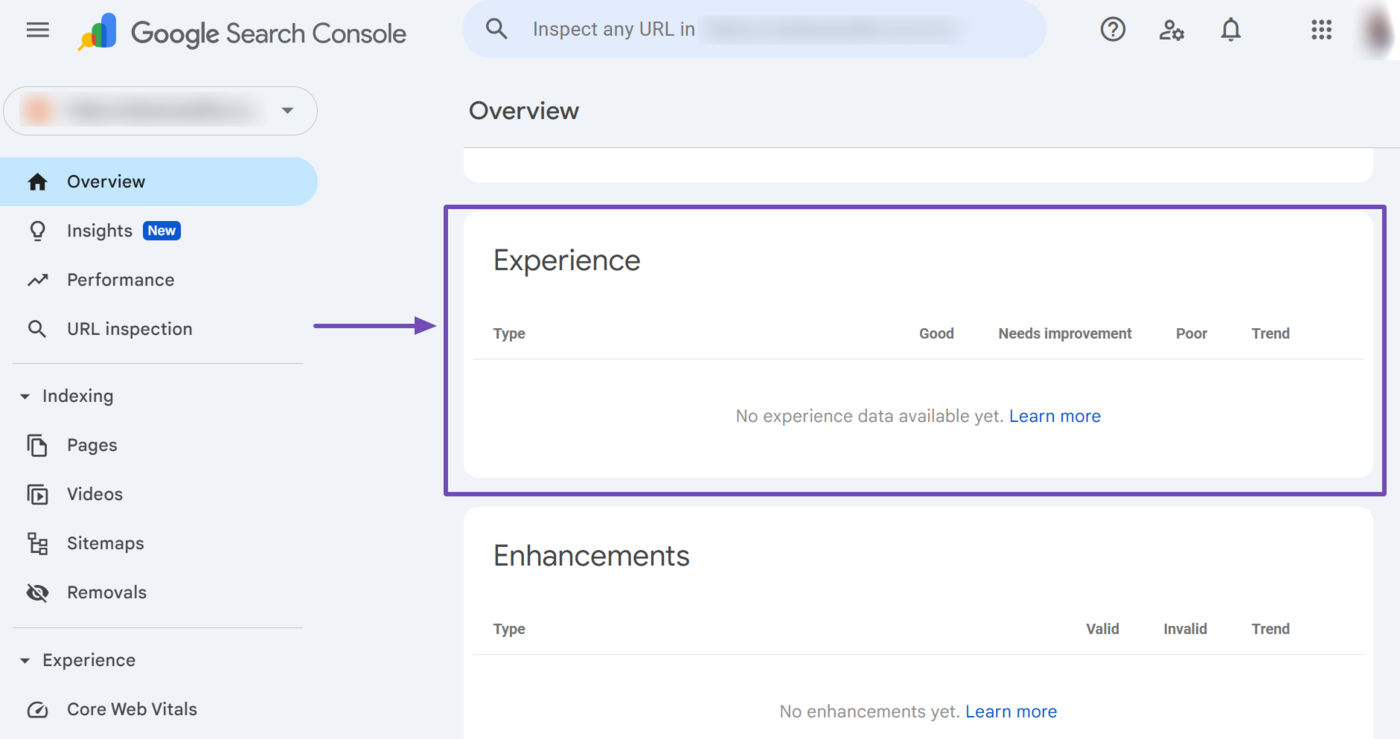
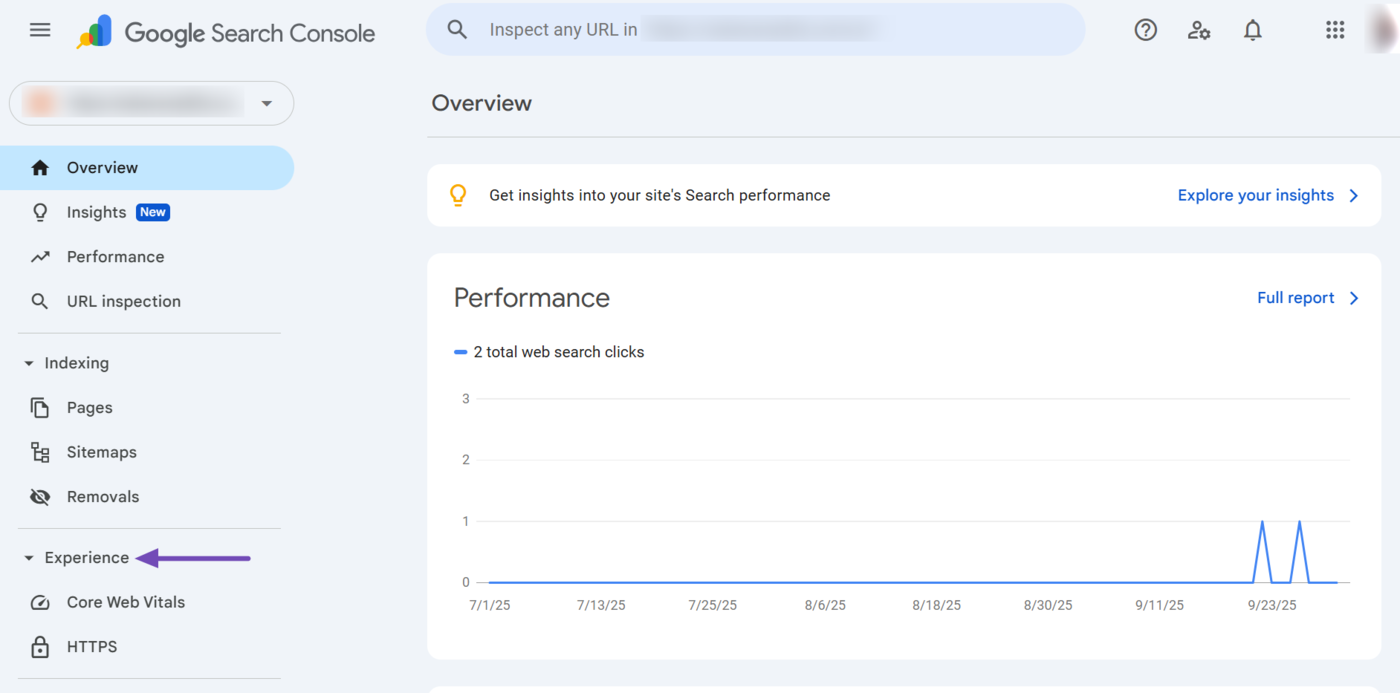
d. Experience
The experience section provides insights into how visitors interact with and perceive your site. It includes detailed reports on your Core Web Vitals and HTTP and HTTPS protocol usage.
The experience section is a summary of the experience report.
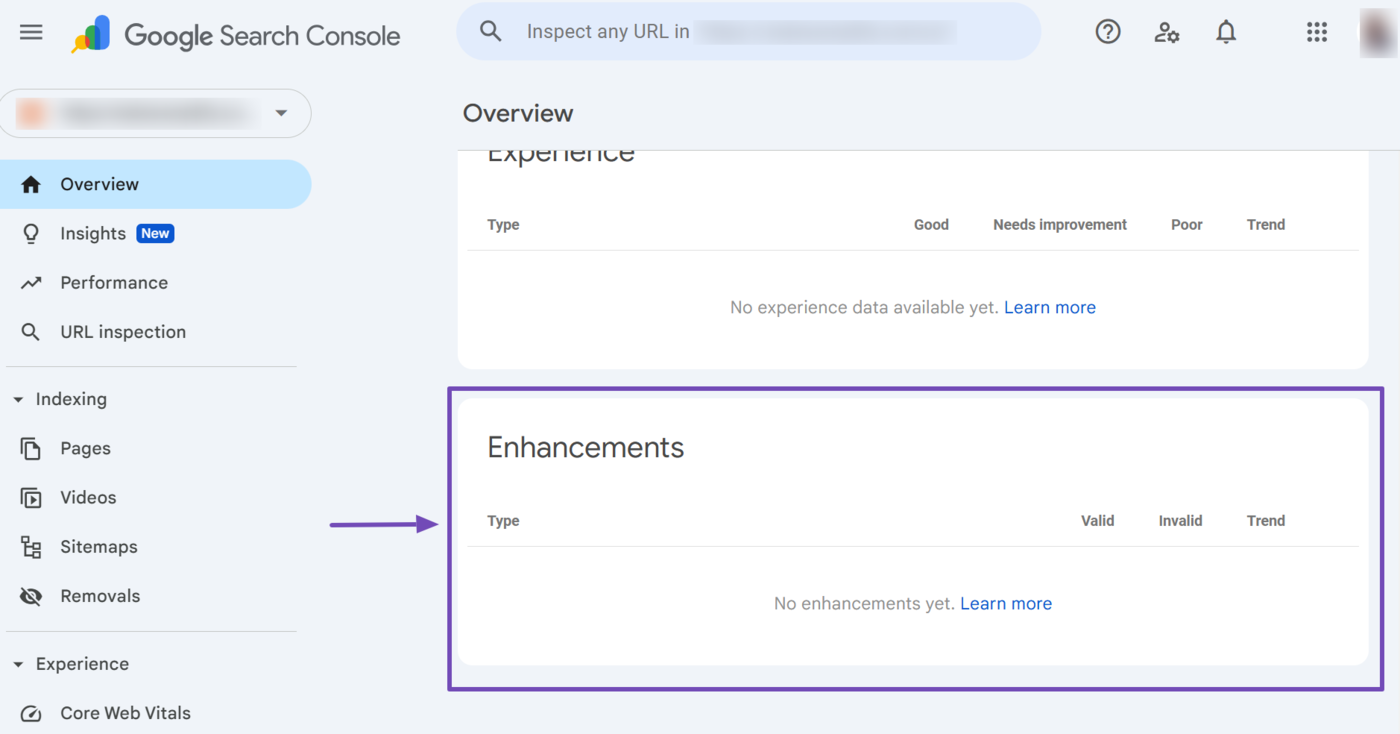
e. Enhancements
The enhancements section provides suggestions to improve your site’s performance and appearance on Google results pages. It is a summary of the enhancements report.
2 Insights
The insights feature provides an overview of your content’s performance in Google search results. It focuses on how users discover and engage with your content.
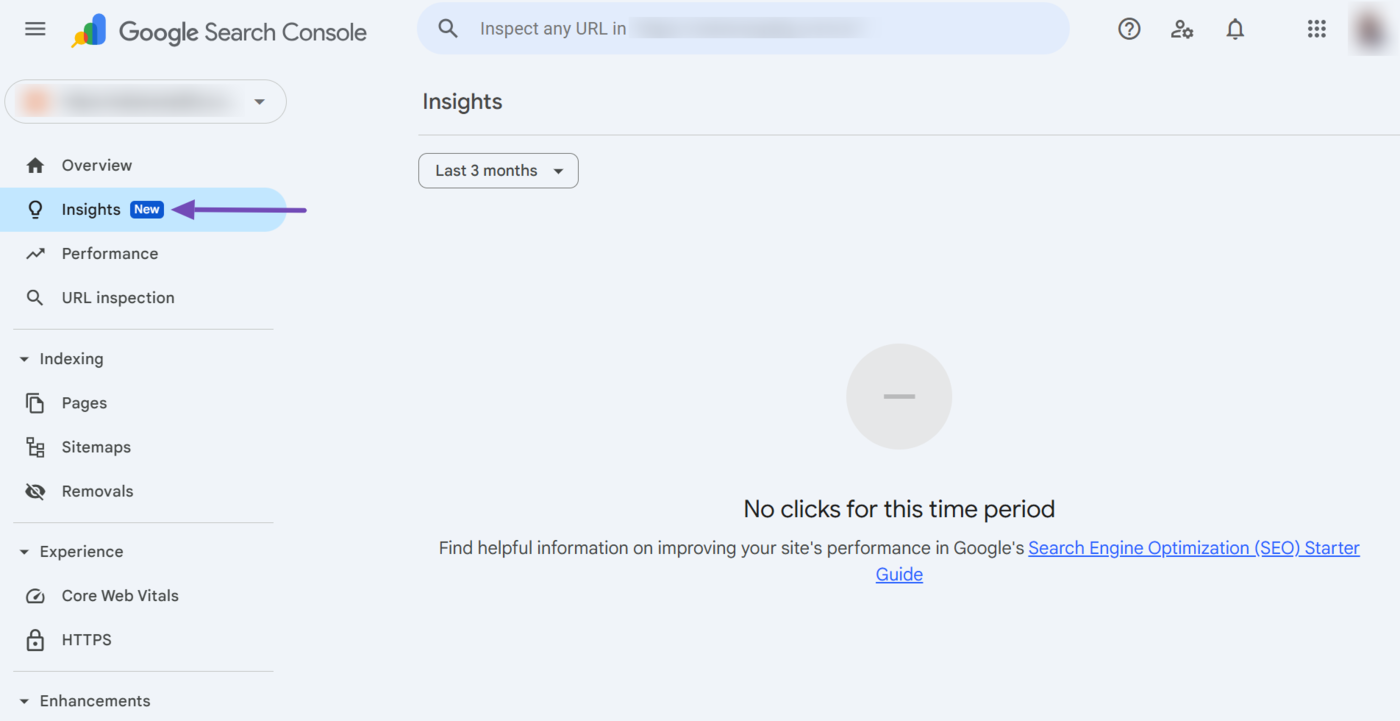
The insights tab focuses on content-based metrics and does not cover anything related to technical SEO. This means it only displays performance and engagement-based metrics, including:
- Clicks
- Impressions
- Your content
- Top countries
- Queries leading to your site
- Additional traffic sources
- Branded traffic
The tab also includes a time range dropdown that allows you to select a time range between the last 7 days, 28 days, and 3 months. With that said, let us briefly explain the data that is displayed.
a. Clicks
The clicks represent the number of times users clicked your site in Google search results.
b. Impressions
The impressions show the number of times your site appeared in Google search results.
c. Your Content
The “your content” section contains a summary of your site’s top-performing pages. It displays its insights in three categories, including top, trending up, and trending down.
- Top: Shows the pages that received the highest number of clicks
- Trending up: Shows the pages that recently earned more clicks compared to a previous period
- Trending down: Shows the pages that recently lost clicks compared to an earlier period
d. Top Countries
The top countries section displays the main countries from which your clicks originate.
e. Queries Leading to Your Site
The queries leading to your site section displays the search terms that brought users to your website. The report is structured into three categories, including top, trending up, and trending down.
- Top: This shows the queries that generated the most clicks
- Trending up: This shows the queries that are now bringing in more clicks than before
- Trending down: This shows the queries that are bringing in fewer clicks than before
An interesting aspect of the Queries leading to your site report is that it merges multiple queries with the same search intent into what Google calls a “queries group.” For example, the three queries below have the same search intent and will lead to the same article:
- how to make pizza
- recipe for pizza
- pizza recipe
So, instead of listing them as separate queries, the Insights feature compiles them into a single query group. This gives you a better overview of your content’s performance and allows you to focus on creating and monitoring content based on their search intent rather than just keywords.
f. Additional Traffic Sources
The additional traffic sources section shows the other ways people reach your site, other than the Google search results page. Some common sources you may find here include Google Discover, Google Images search, Google Video search, and Google News search.
g. Branded Traffic
This shows you the percentage of your traffic that is branded and non-branded.
Branded traffic is traffic that originates from search terms that contain the name, variation, or misspelling of your brand, product, or service. These queries are also called branded keywords. For example, Gmail sign in and Nike yoga mats are branded keywords.
Meanwhile, non-branded traffic originate from search terms that do not contain the name of your brand, product, or service. For example, best email service, vanilla cake recipe, and yoga mats for sale are unbranded keywords that lead to non-branded traffic.
3 Performance
The performance report provides insights into your site’s ranking position, as well as the clicks and impressions it received in Google search results.
The performance report includes multiple settings, options, and filters that allow you to gain insights into specific details about your content and site. Some of the available settings, options, and filters include:
- Metrics
- Time range
- Search type
- Add Filter
Let us discuss them below.
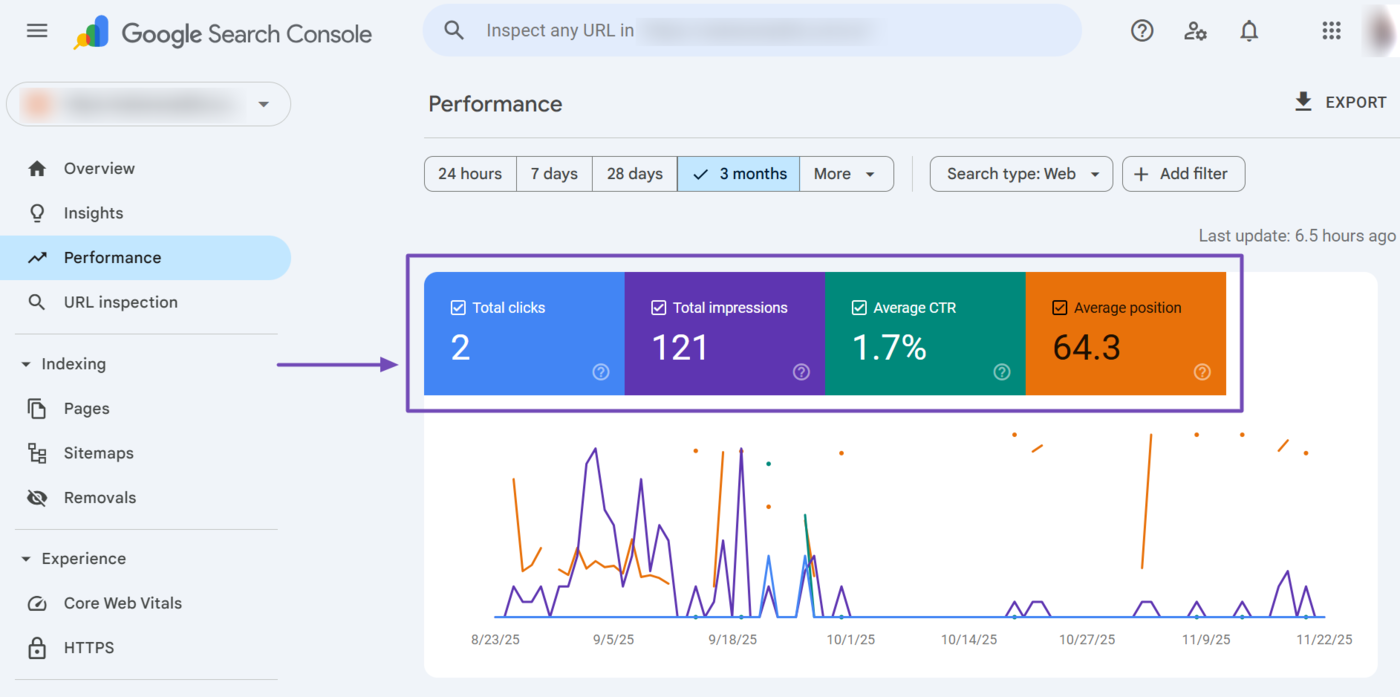
a. Metrics
The performance report allows you to track multiple metrics, including your total clicks, total impressions, average CTR (click through rate) and average position on Google search results pages.
- Total clicks: The number of times users clicked your pages in Google search results
- Total impressions: The number of times your pages appeared in Google search results
- Average CTR (click through rate): The percentage of impressions that resulted in a click
- Average position: The average ranking position of your pages in Google search results
You can select and deselect the metrics, depending on the performance data you want to evaluate.
b. Time Range
The performance report offers multiple date options that lets you choose the time range of the metrics you are evaluating.
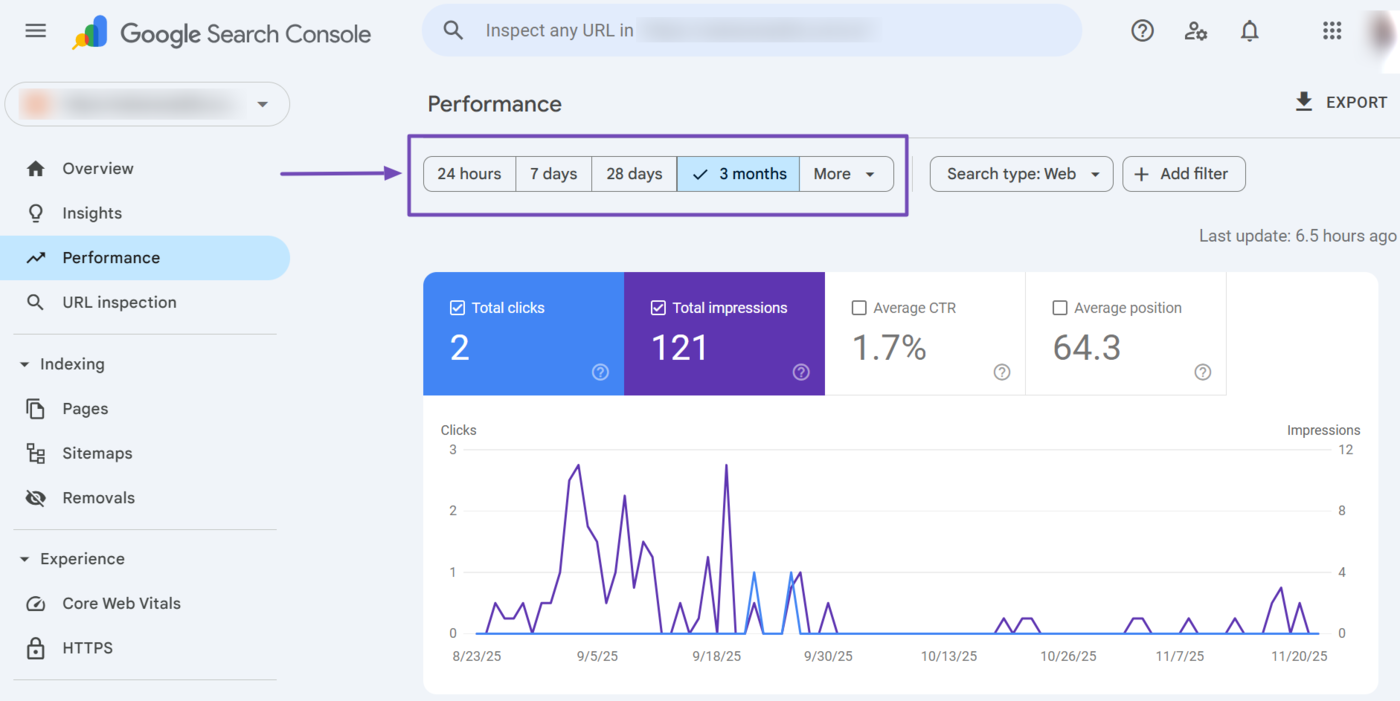
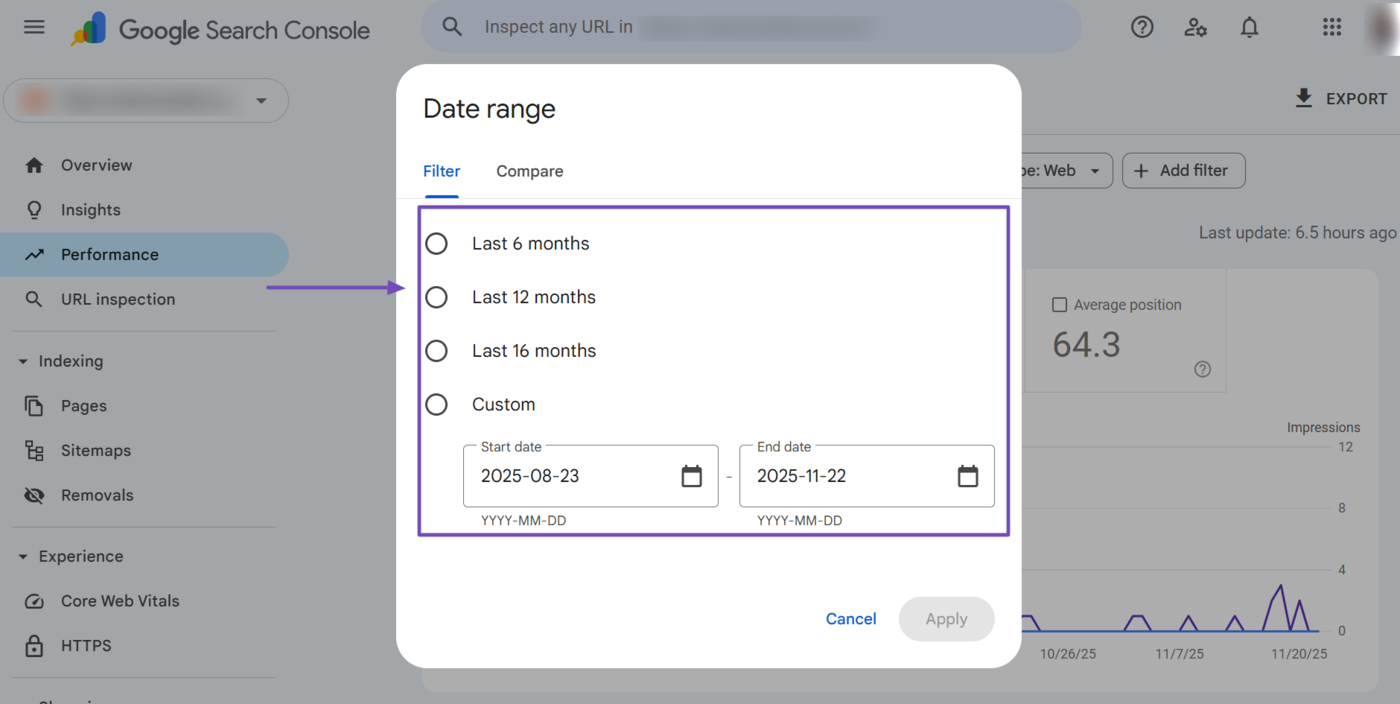
The available date options include 24 hours, 7 days, 28 days, and 3 months. You can also click More to select longer time ranges (such as 6 months, 12 months, and 16 months) or to set a custom time range.
c. Search Type
The search type dropdown allows you to filter your performance report based on the Google search vertical your content appeared. Specifically, it allows you to filter your performance on Google web search, image search, video search, and news search results.
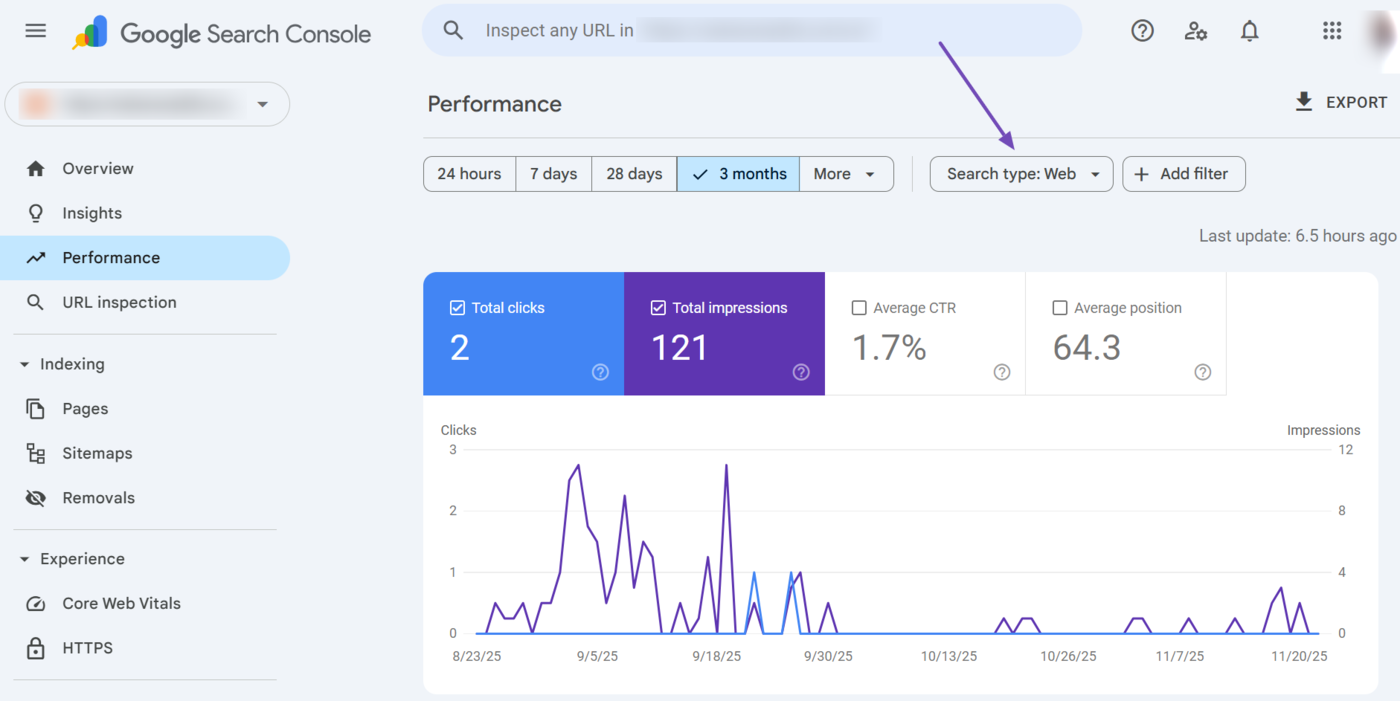
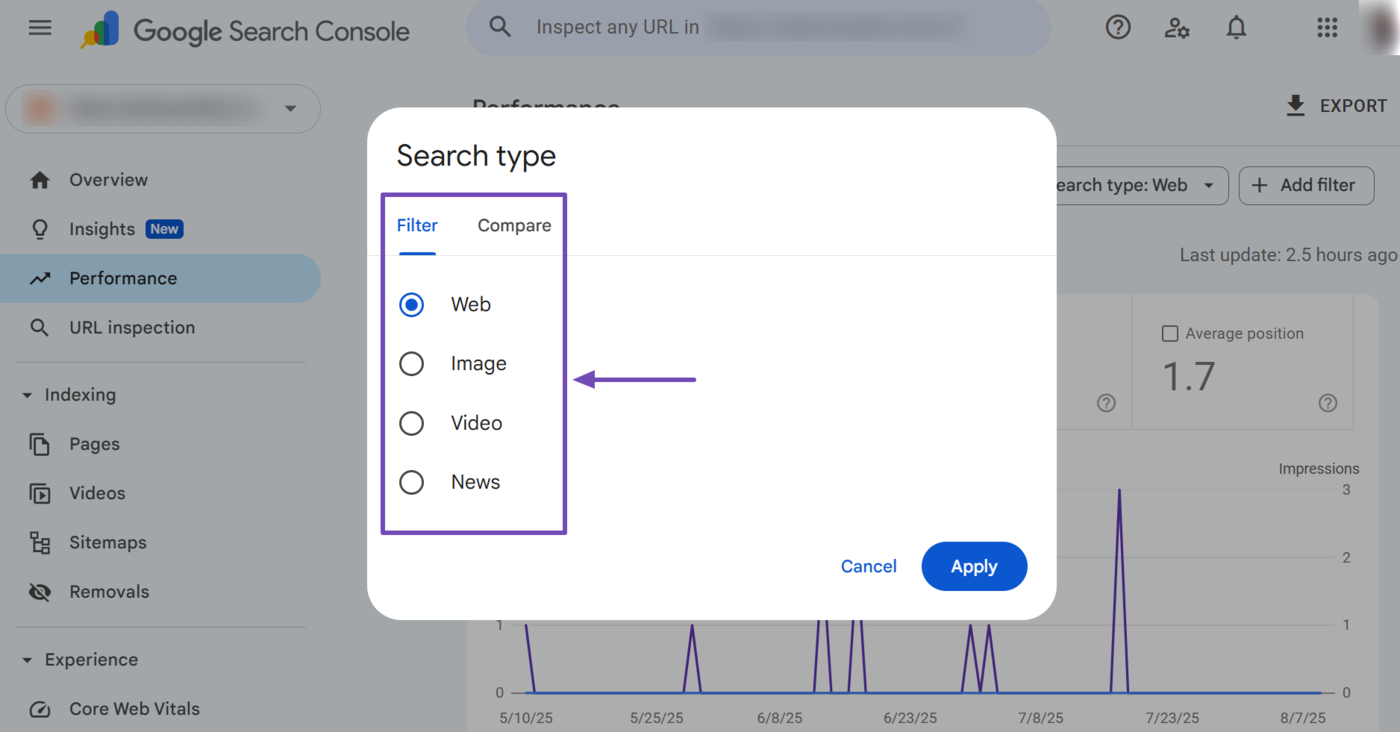
The search type dropdown is set to Web by default. However, the available options include Web, Image, Video, and News.
- Web: Shows the performance report for content that appears on Google search results pages
- Image: Shows the performance report for content that appears on Google Images results
- Video: Shows the performance report for content that appears on Google video search results
- News: Shows the performance report for content that appears on Google News and news-related search results
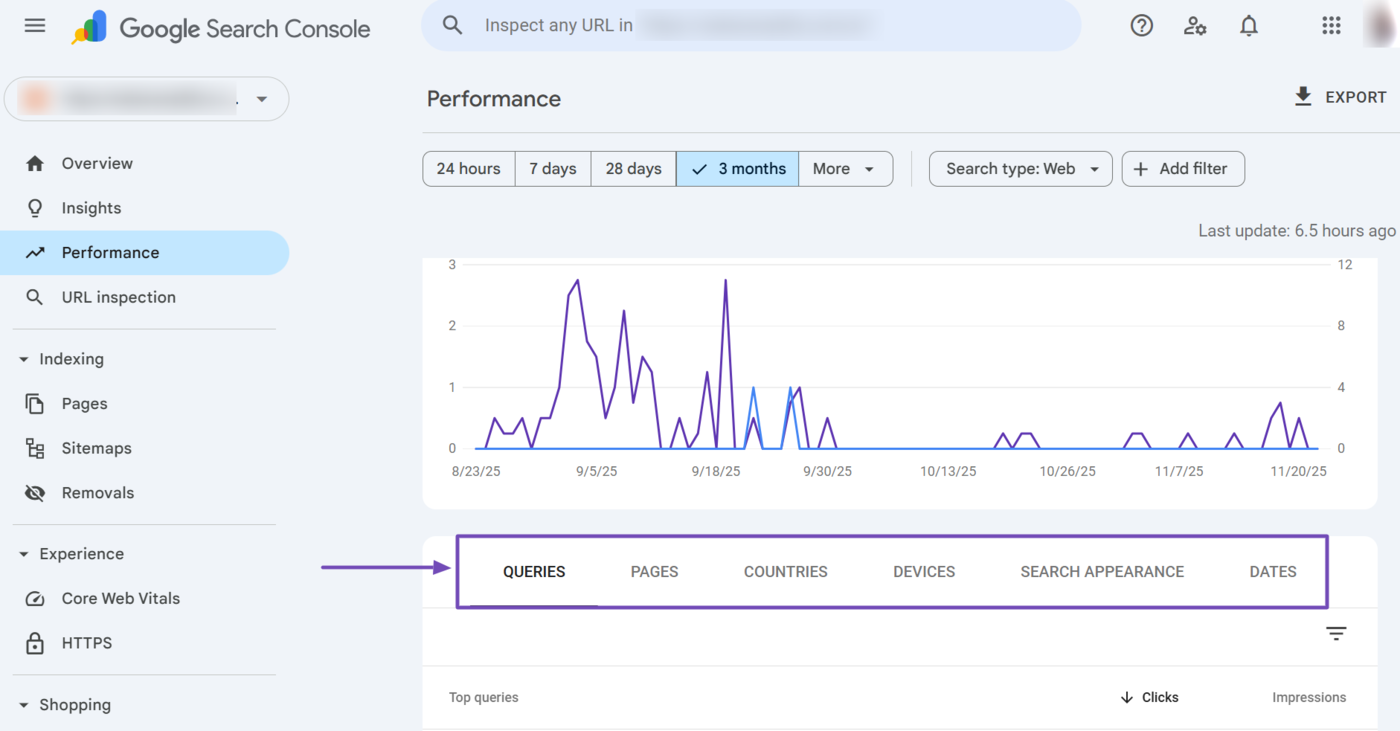
d. Add Filter
The performance report also includes multiple filters that allow you to gain deeper insights into your content and audience. You can access these filters by clicking the Add Filter button.

Optionally, you can select the relevant filter tab from the table beneath the chart and it will apply the relevant filter to your performance report.
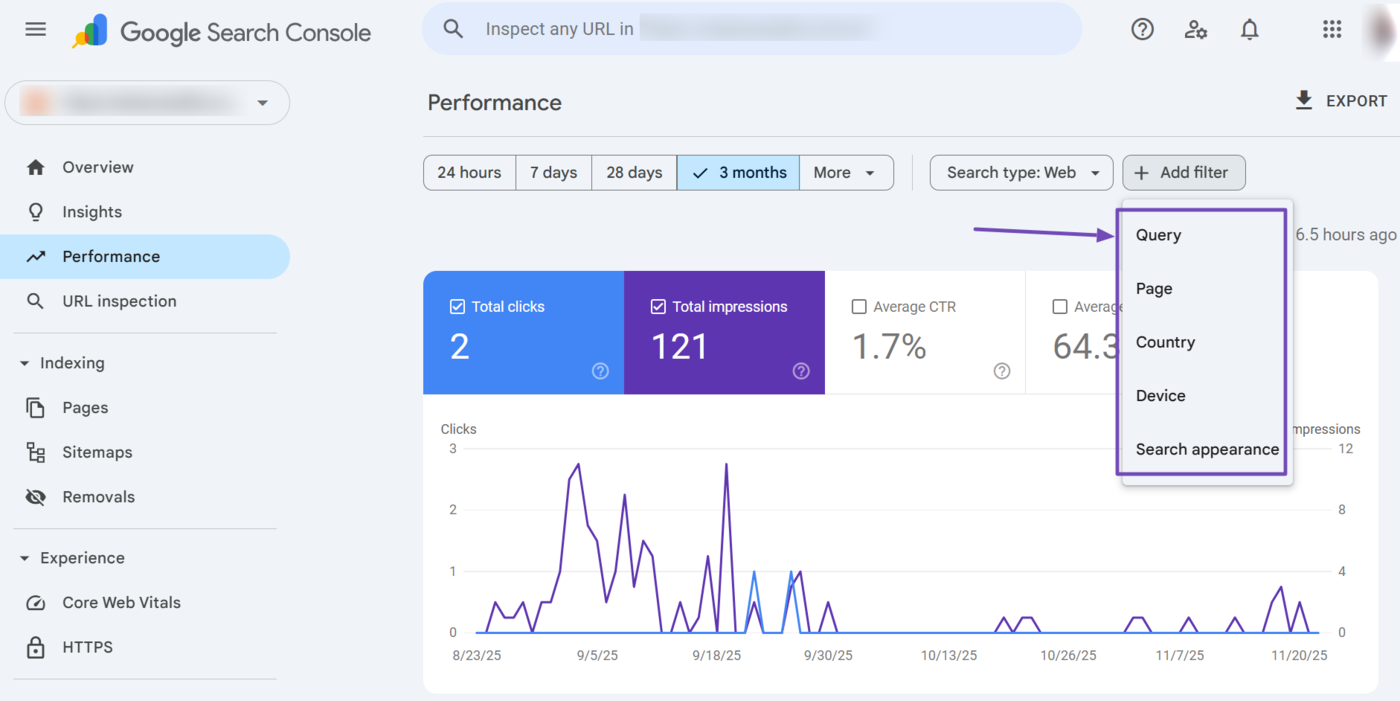
When you click the Add Filter button, you will be presented with multiple options including query, page, country, device, and search appearance.
- Query: Shows the search terms users used to find your site
- Page: Shows the performance metrics for individual URLs on your site
- Country: Shows the location of your visitors
- Device: Shows the device used by your visitors
- Search appearance: : Shows the types of search features or rich results your pages appeared in on Google Search
Two filters that stand out here include the Query and Search appearance filters.
Query Filter
The query filter lets you see the specific search terms users typed before clicking your site. This helps you understand which keywords drive traffic and how your site performs for them.
However, the query filter also allows you to filter the search terms based on the keywords the searcher used and whether the keywords are branded or non-branded.
A branded query is one that contains the name of your brand, product, or services. This includes the correct spelling as well as variations and misspellings. This means “Google” and its misspelling “Gogle” are both branded queries.
Monitoring branded and non-branded queries allows you to differentiate visitors who are already familiar with your brand from those who are not. It gives better insights into your SEO and organic search performance as you are more likely to rank higher for branded queries compared to a non-branded one.
Search Appearance Filter
The search appearance filter shows how your content appeared for specific features displayed on the results page. This makes it helpful for evaluating the performance of the structured data and search result enhancements on your site.
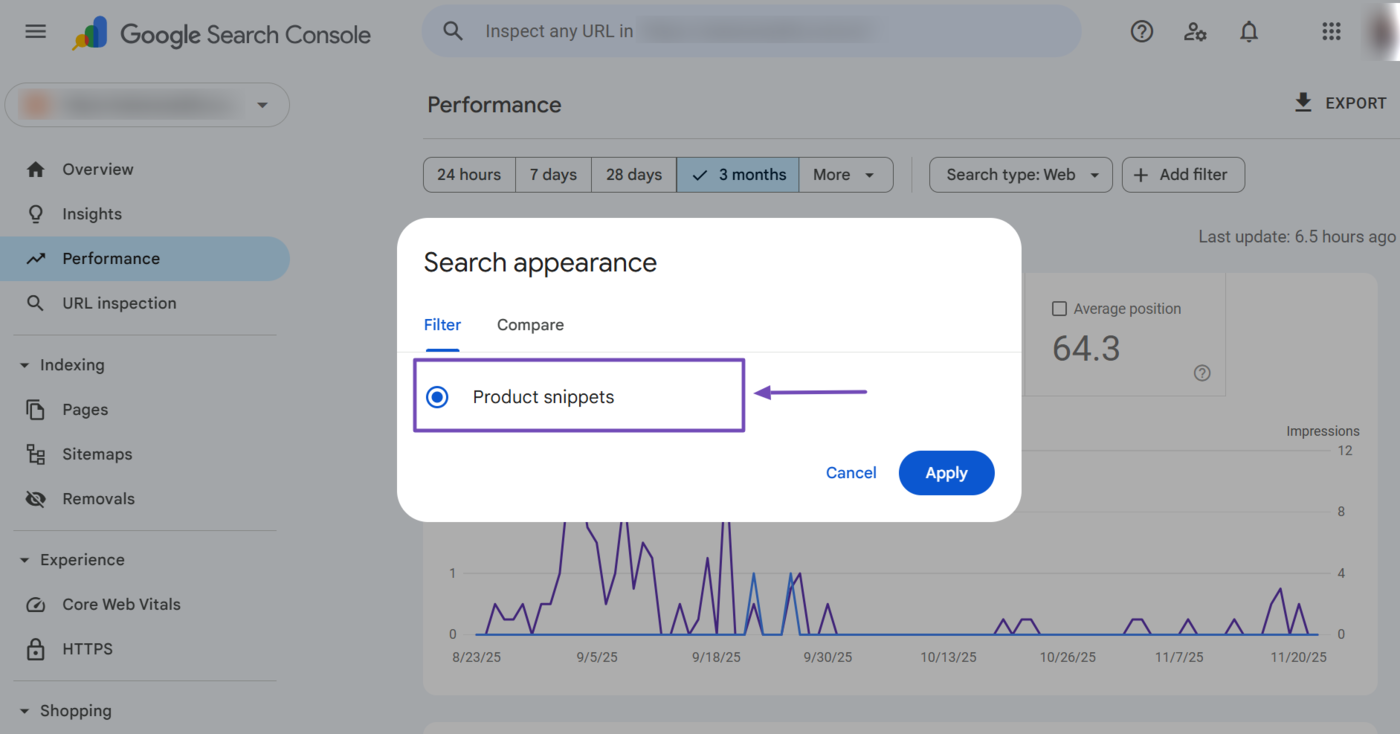
The reports displayed here may vary, but some reports you might see include:
- Product snippets: Shows clicks and impressions for content that appears as product-rich results
- Translated results: Shows clicks and impressions you receive when Google translates your page’s title and snippet into the user’s language
- Android app: Tracks traffic from content linked to your Android app through App Indexing
- Videos: Measures the performance of your content when it appears in video search results features like video carousels and rich snippets
- Discussion forums: Reports clicks and impressions for content that Google identified as forum posts or discussions
- AMP non-rich results: Shows traffic for AMP pages that appear in search without rich result enhancements
4 URL Inspection
The URL inspection tool allows you to examine and analyze individual URLs on your site. Clicking the URL inspection option will redirect you to the URL inspection tool field at the top of your search console dashboard.
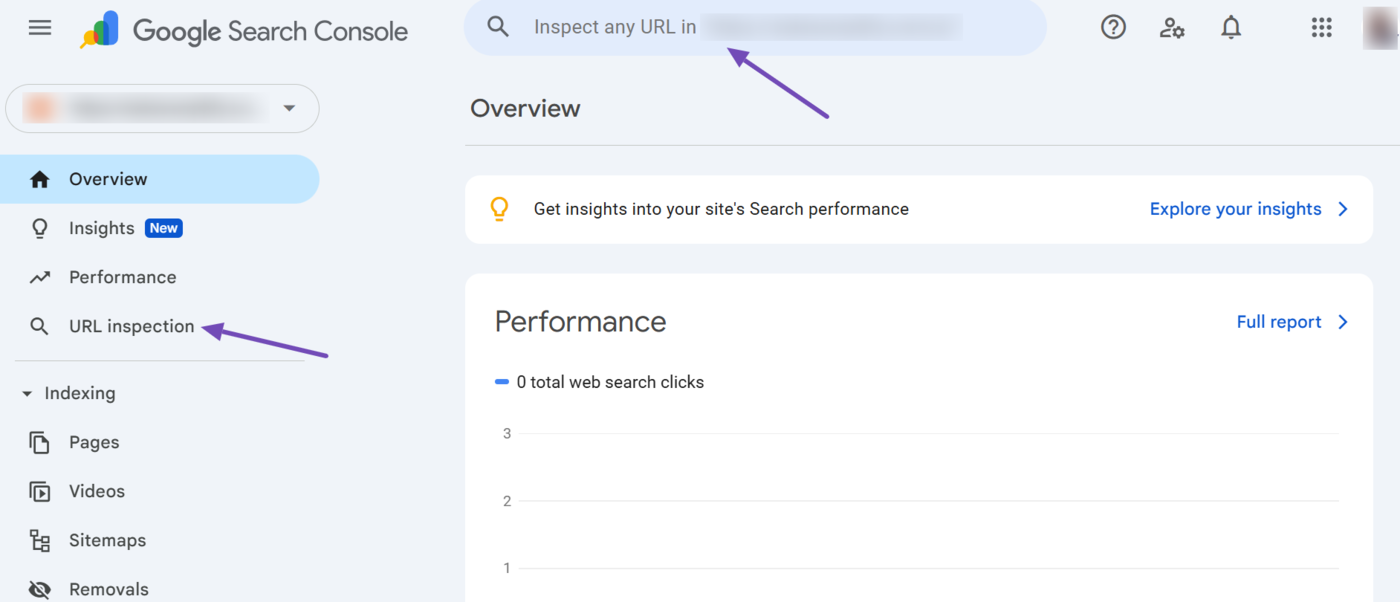
The URL inspection tool provides you with insights into how your pages are indexed, how they appear in search results, and whether there are any issues or errors that may impact their visibility or performance.
Here, you can enter any URL on your site into the tool, which will return a report on the page’s status. This provides you with a series of information split across multiple sections, including:
- The indexing status of the page
- A summary of the page indexing report
- Enhancements and experiences detected on the page
a. Indexing Status
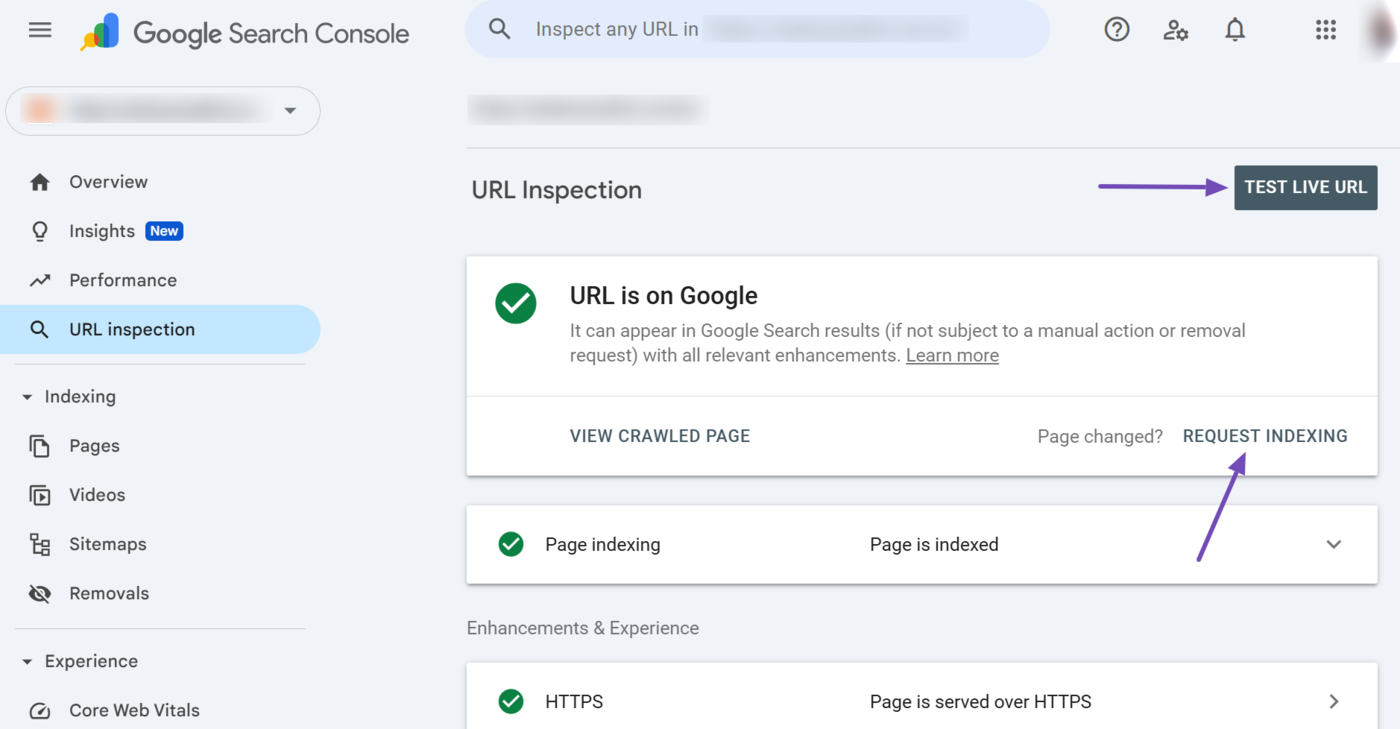
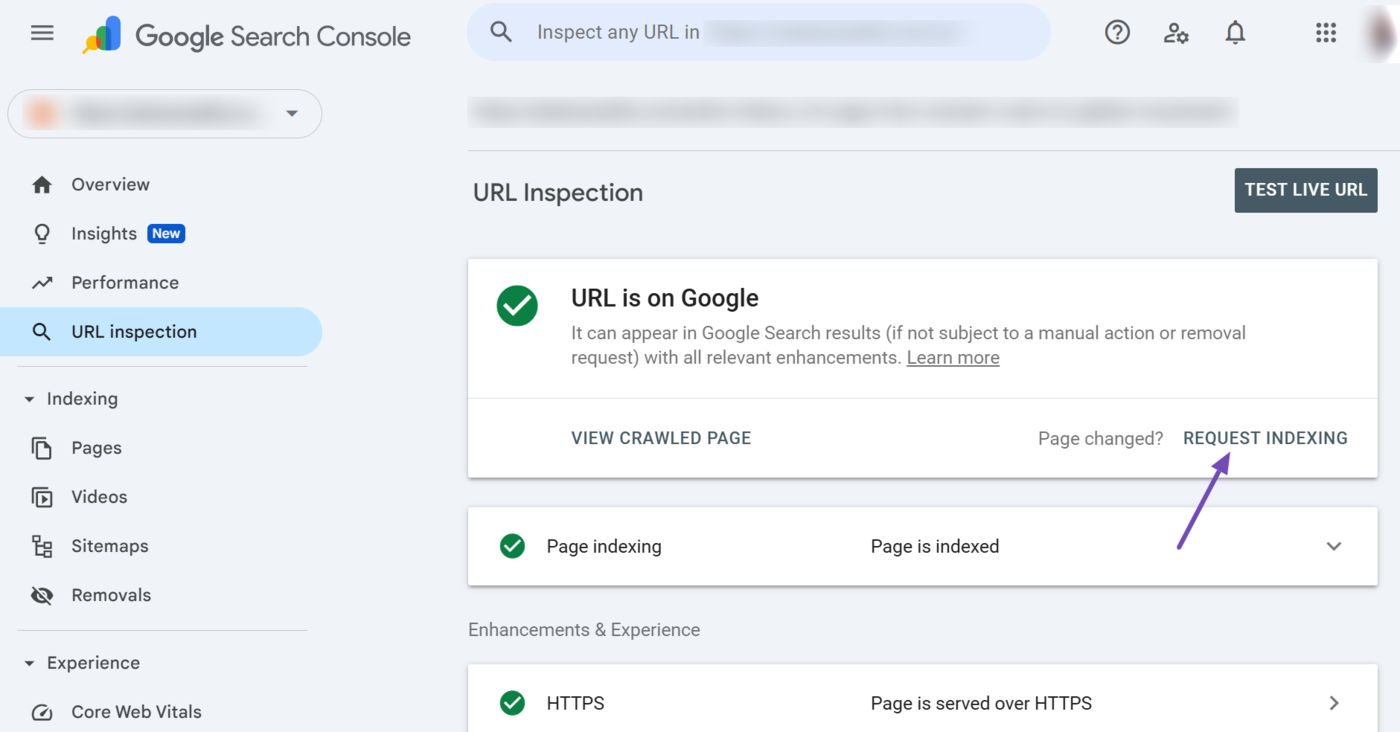
The indexing status informs you whether a URL has been indexed or not. If the URL is indexed and on Google, you will see a “URL is on Google message,” as shown below.
The field also contains multiple options, including:
- Test live URL: This allows you to view the page as Google sees it
- Request indexing: This allows you to request Google to index the page
b. Page Indexing
The page indexing section summarizes the page indexing report. At the top is the URL’s crawling and indexing situation. This informs you whether the page has been crawled, crawled but not indexed, or crawled and indexed.
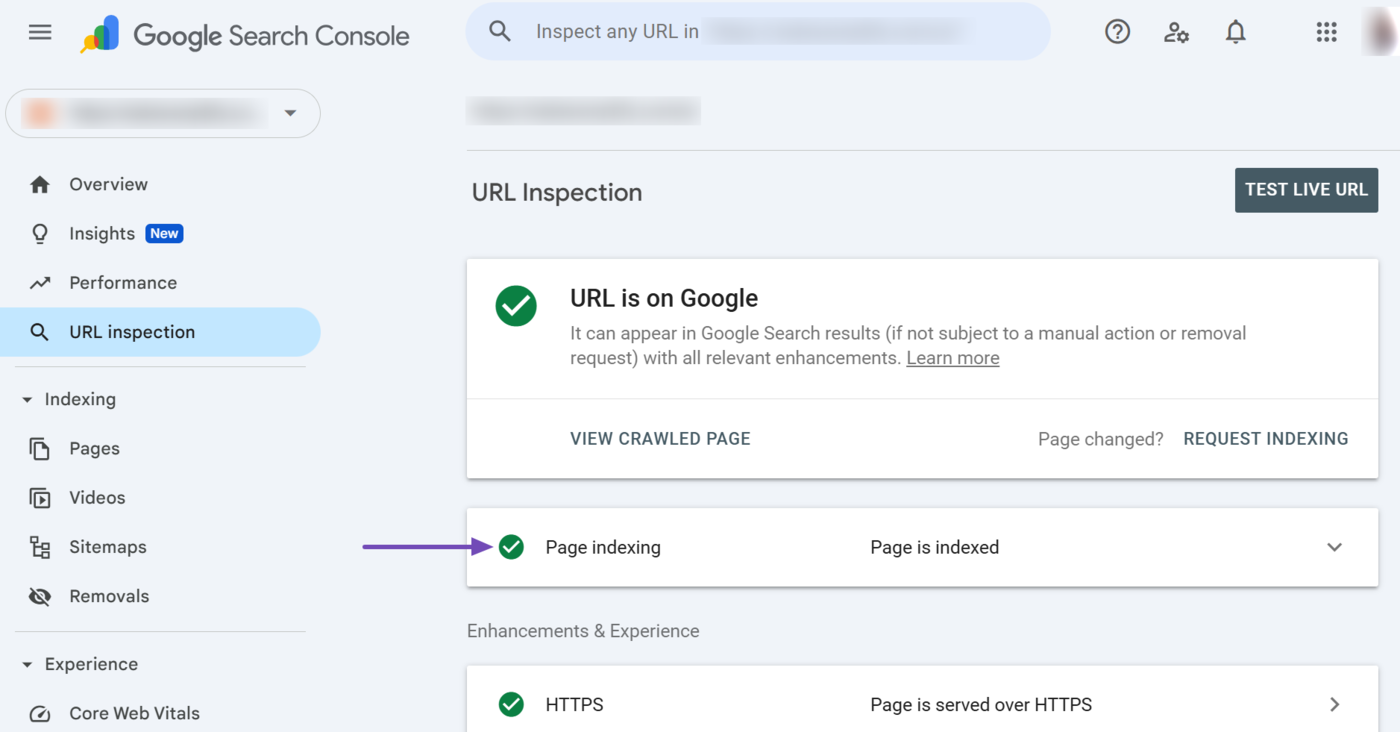
You can click the page indexing report for more insights into the page’s index status.
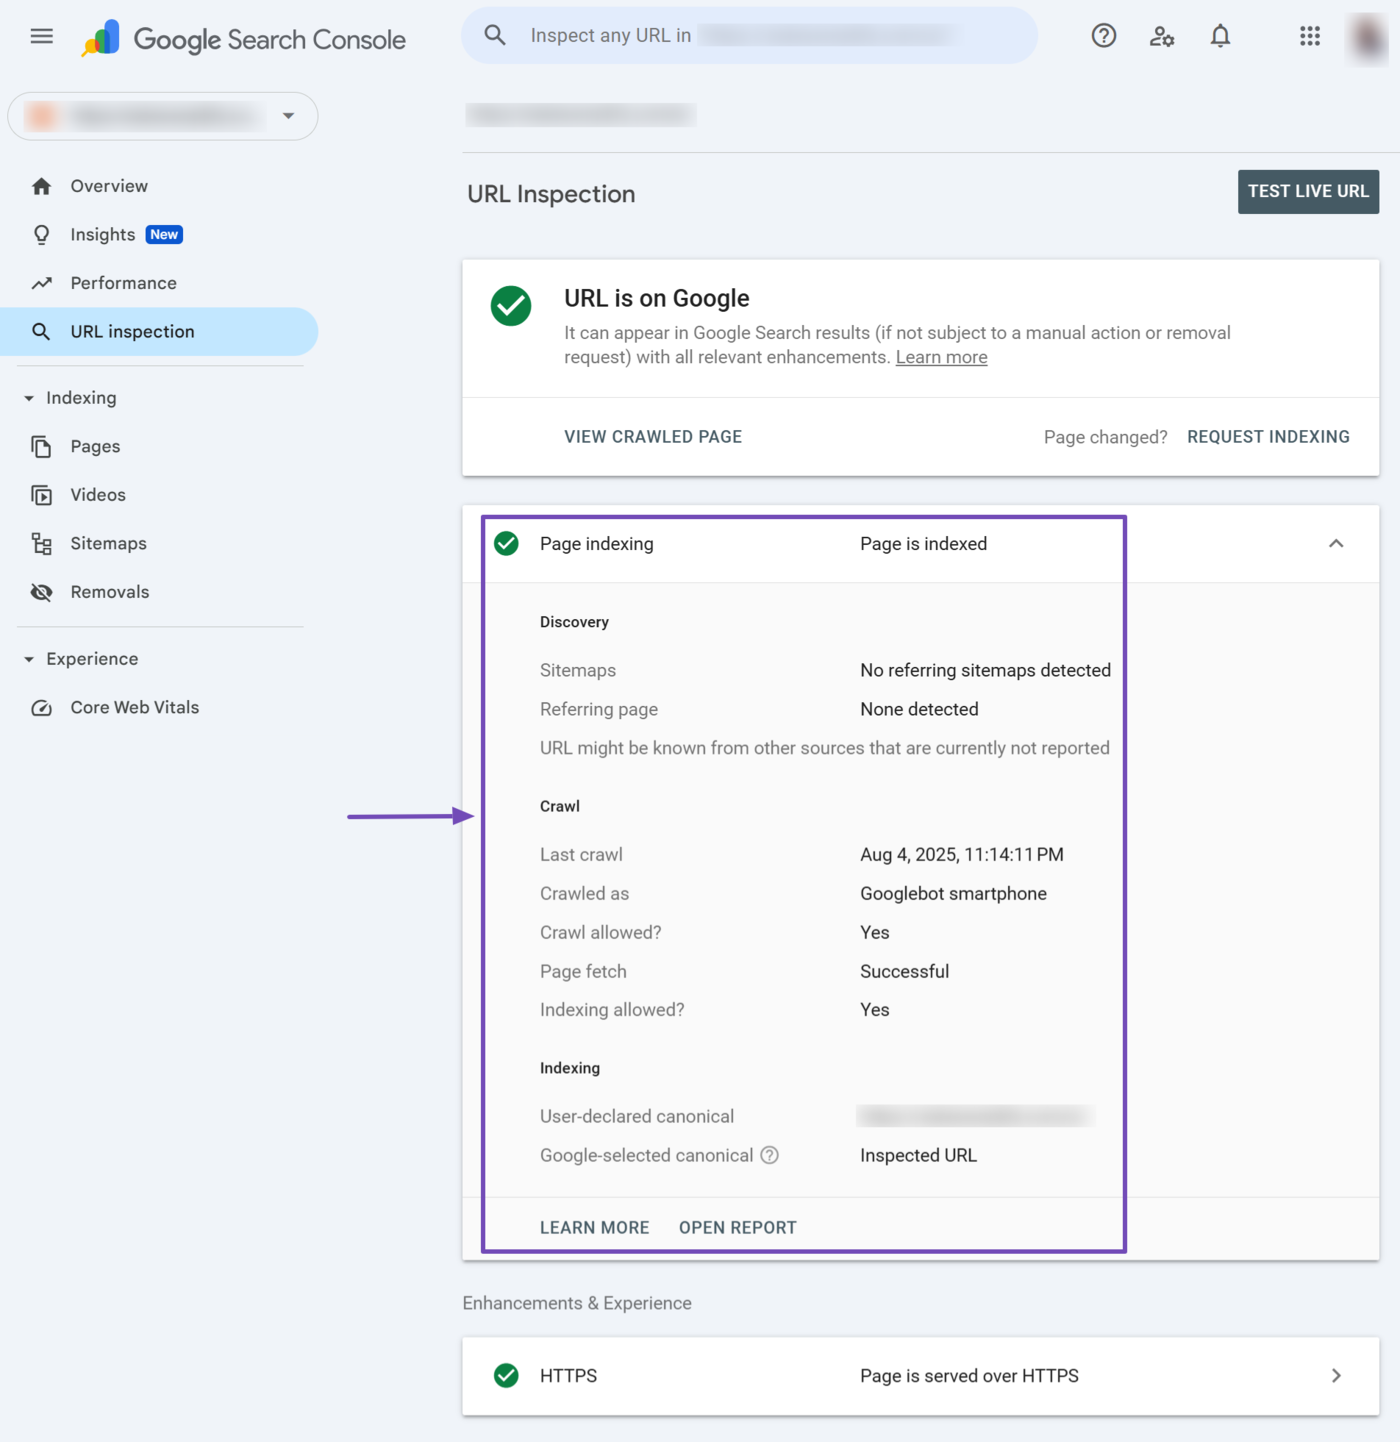
Some data you should look out for include:
- Last crawl: Lists the last date and time the URL was crawled
- Crawled allowed: Specifies whether Googlebot is allowed to crawl the page
- Page fetch: Specifies whether Google can fetch the page
- Indexing: Specifies whether Google is allowed to index the page
- User-declared canonical: Lists the canonical URL that you specified to Google
- Google-selected canonical: Lists the URL that Google declared as canonical
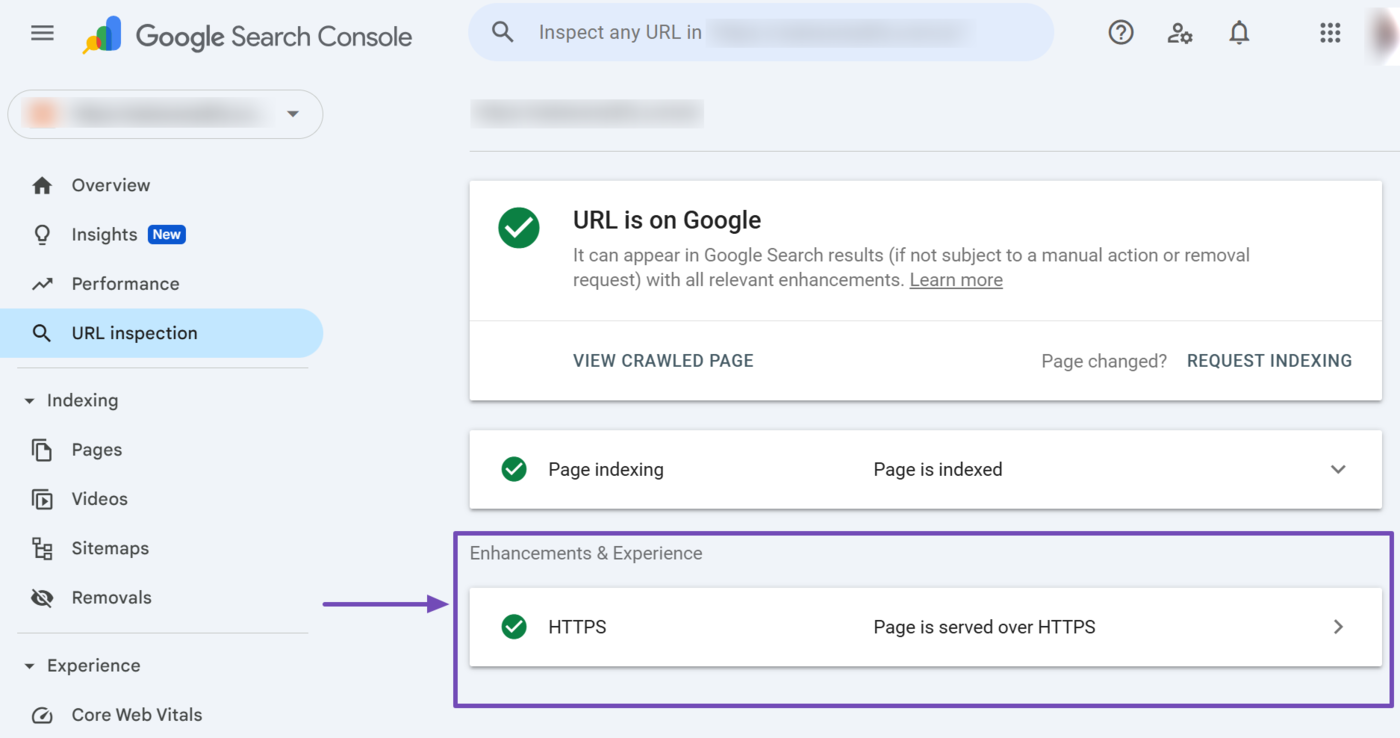
c. Enhancements & Experience
The enhancements & experience section displays crucial information about the page, including its HTTPs status and the structured data present on it. You can click on any report for further insights.
5 Indexing
The indexing dropdown contains multiple reports and options, including Pages, Sitemaps, and Removals. Depending on the content on your site, it may also contain additional reports, such as Videos.
You can click the available reports and options by clicking the Indexing dropdown.
We will now explain the available indexing reports and options below.
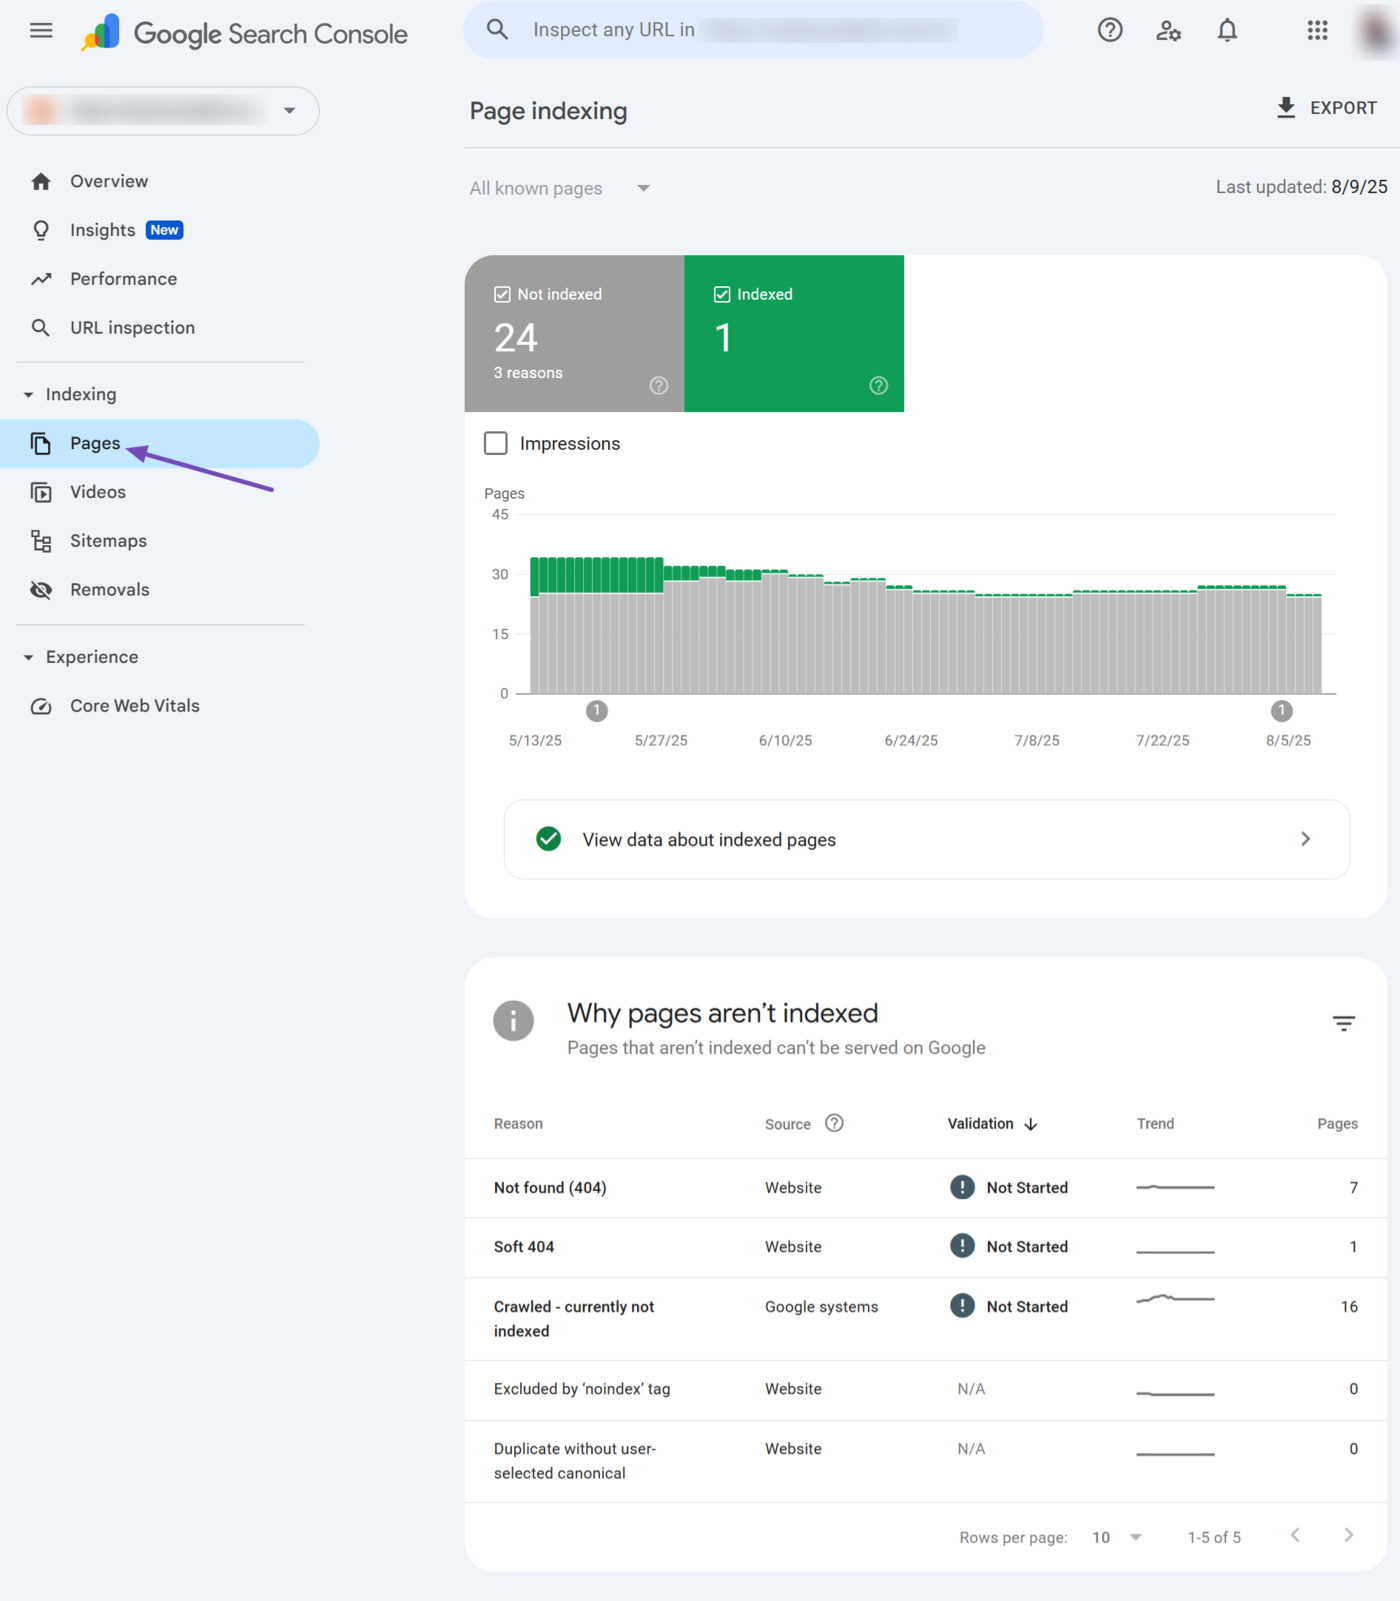
6 Pages
The pages report provides insights into the indexing situation of your pages. Here, you can view the pages Google has indexed, the pages Google did not index, and why Google did not index them.
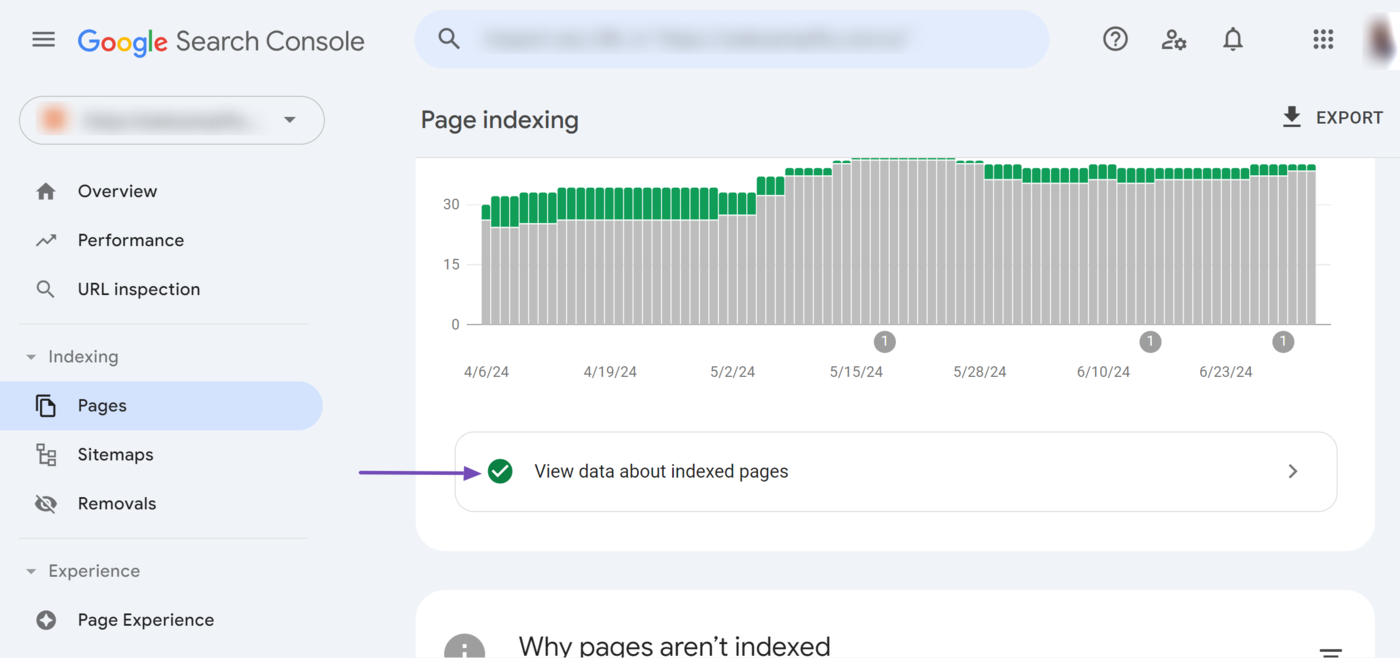
The pages report is among the reports provided in the indexing dropdown.
Click View data about indexed pages to view some of the indexed pages on your site. However, note that the report is limited to 1000 pages. This means the data will not display all your indexed pages if you have more than 1000 pages.
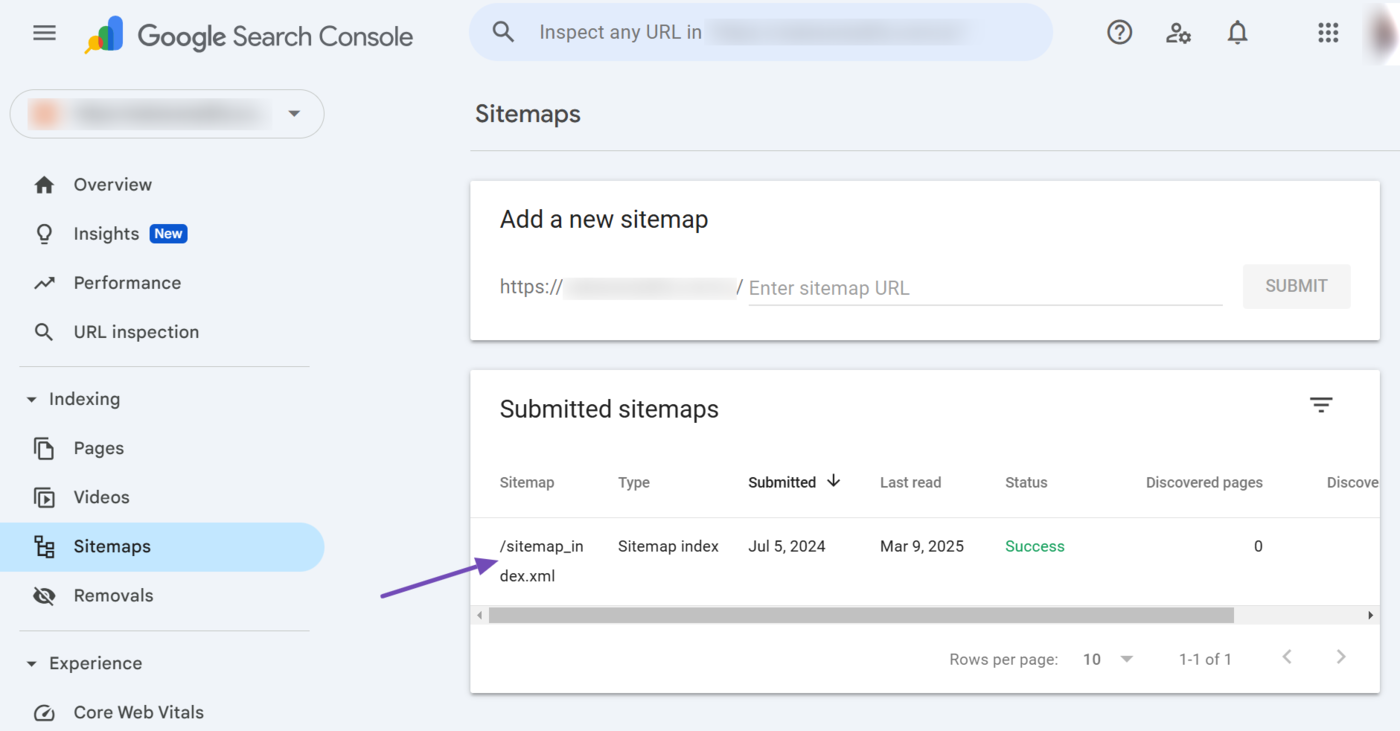
7 Sitemaps
The sitemaps option allows you to submit your XML sitemaps to Google. It also provides you with insights into the XML sitemaps you already submitted to Google. It is one of the options provided in the indexing dropdown.
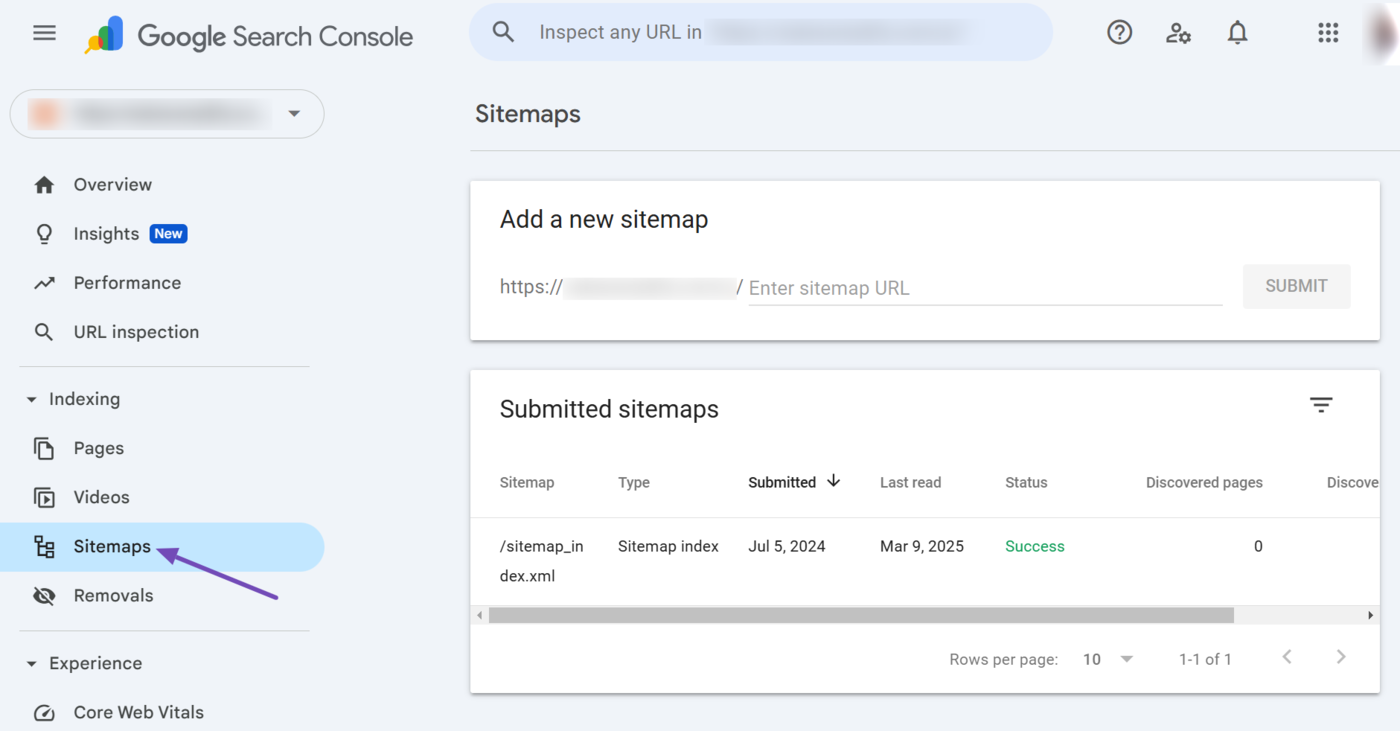
The status of the sitemap will vary depending on its crawl condition.
- Success: Google was able to crawl the sitemap without issues
- Couldn’t fetch: Google could not crawl the sitemap due to some issues
- Sitemap has x errors: Google partially crawled the sitemap, but could not complete the crawl because it encountered some issues
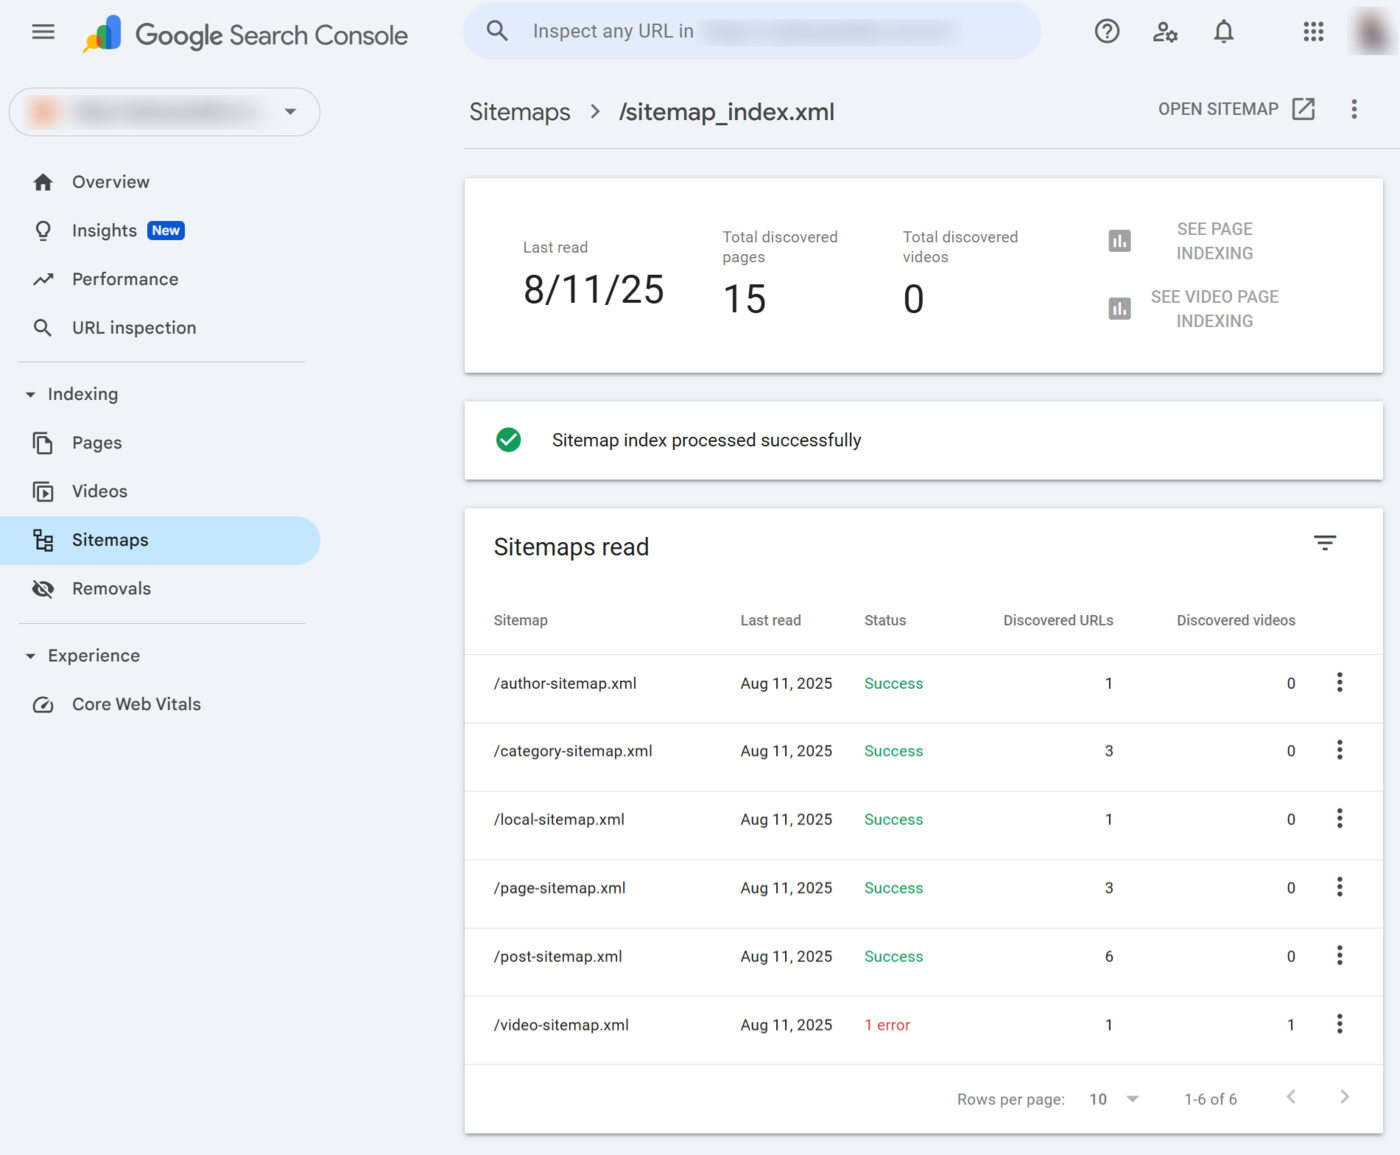
You can click on a sitemap to gather more insights into it.
Once clicked, the sitemap report will display multiple reports about the sitemap, including the number of times Google read it and the number of URLs Google discovered using it.
8 Removals
The removals and SafeSearch reports tool allows you to manage the SafeSearch filters and remove pages from Google search results pages. It also provides the status of the pages you requested Google remove from its results pages.
The removal and SafeSearch reports tool is among the reports displayed in the indexing dropdown.
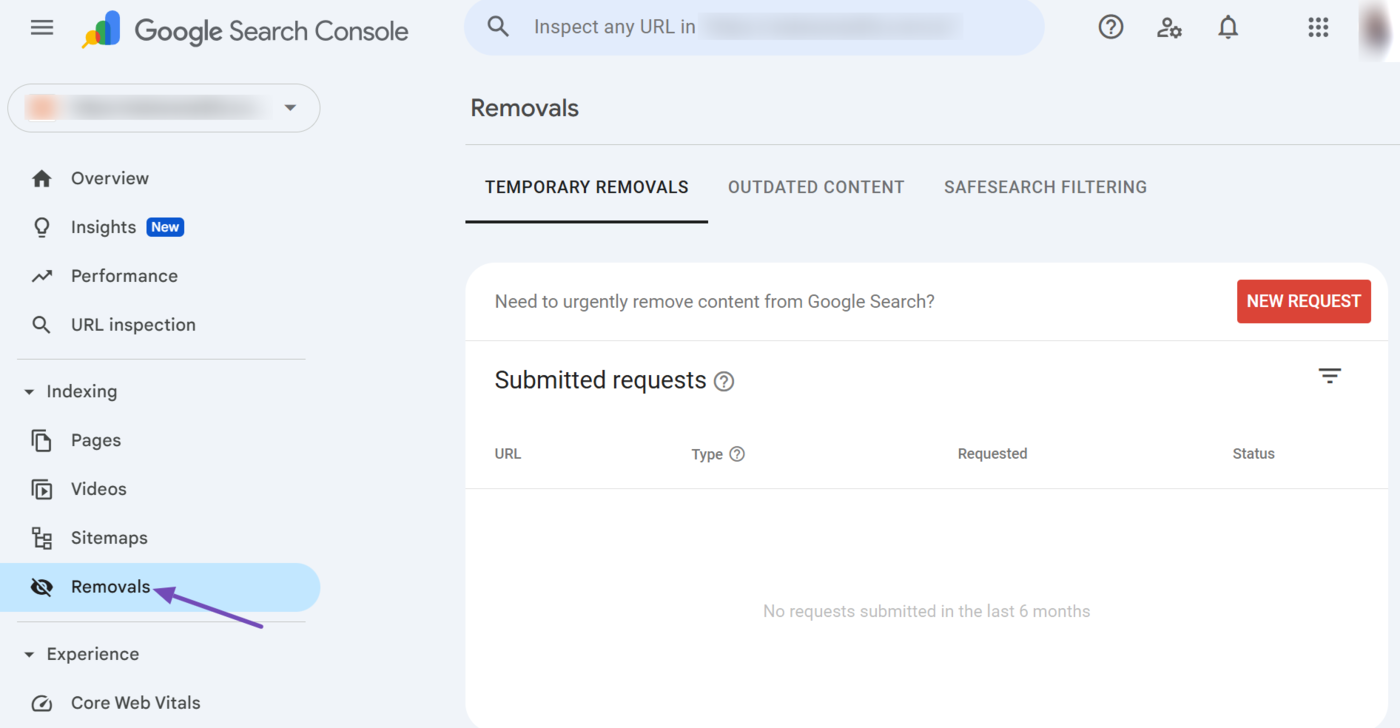
The removals and SafeSearch reports tool contains three options:
- Temporary removals
- Outdated content
- SafeSearch filtering
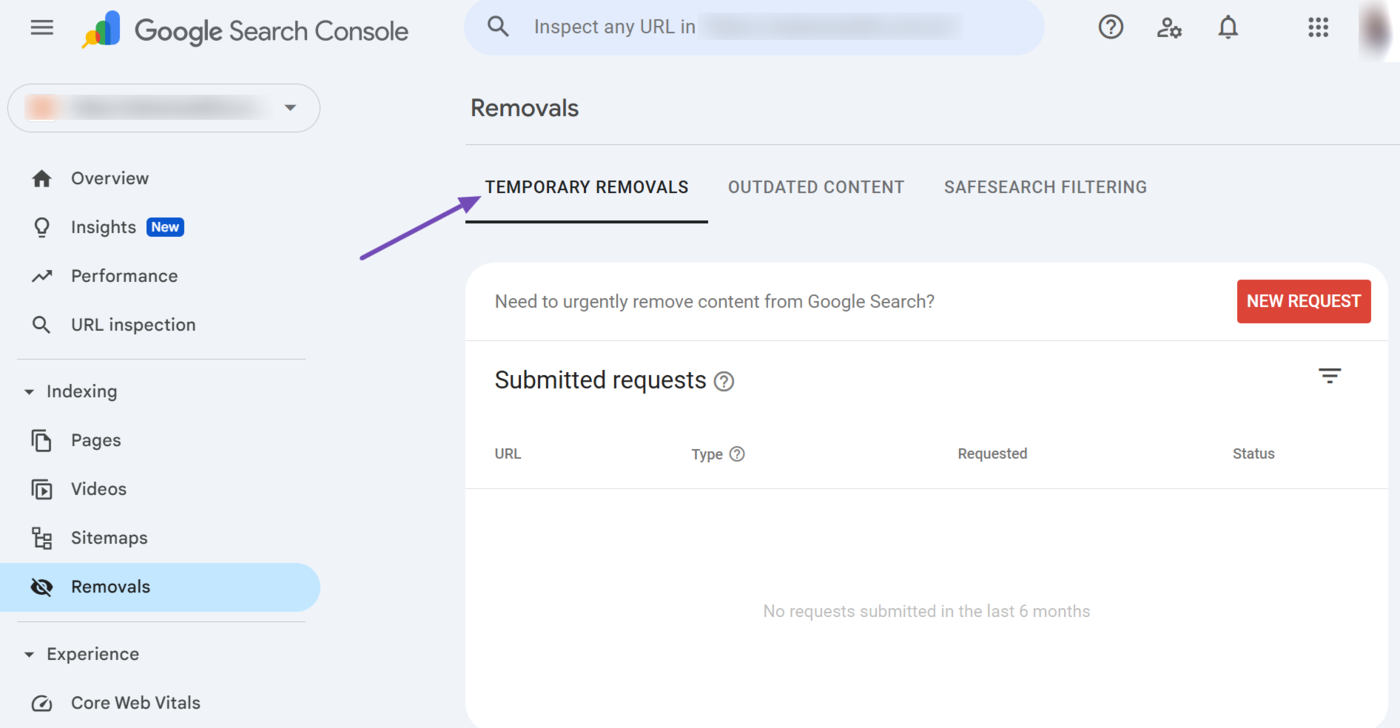
a. Temporary Removals
The temporary removals option allows you to request Google to remove your webpages from its index. You can click New Request to ask Google to remove your content or description snippet from search results.
It is crucial to note that Google will remove the page for a period of six months. In the case of the description snippet, it will be removed until Google recrawls the page.
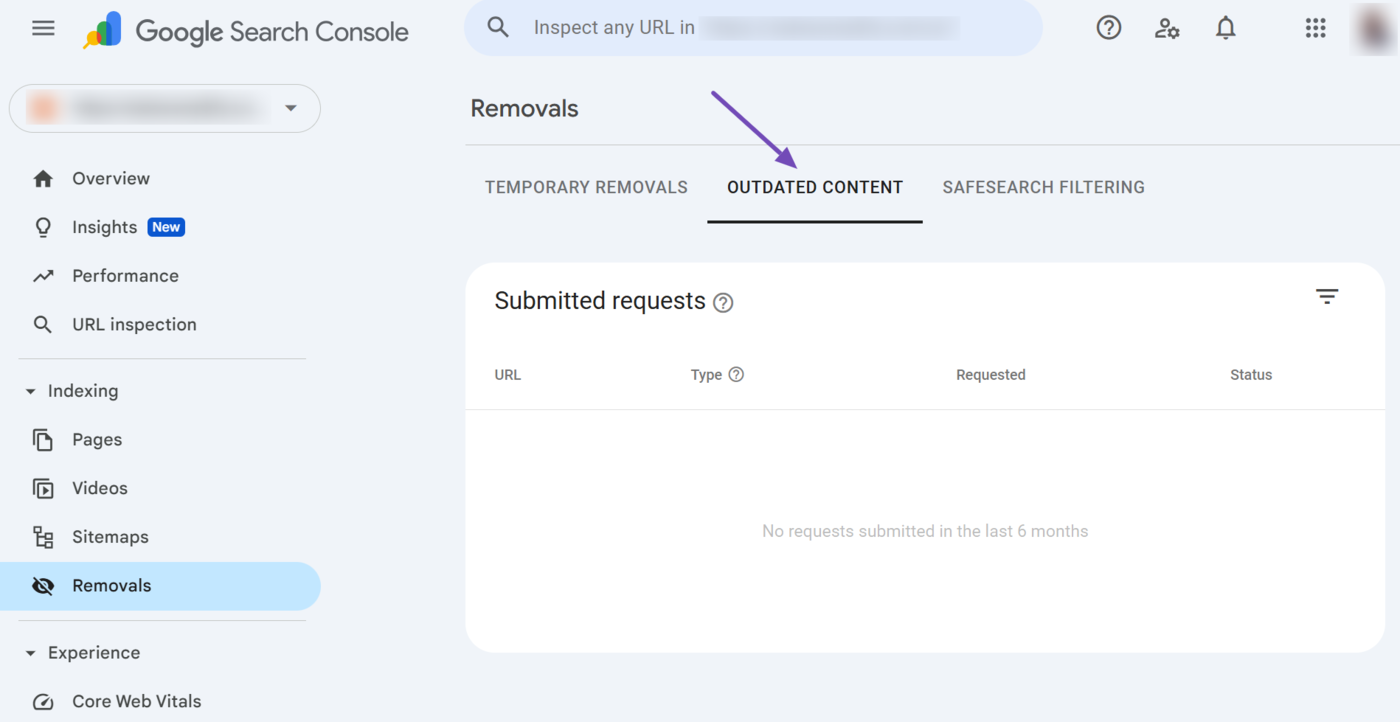
b. Outdated Content
The outdated content field shows you the removal status of old and irrelevant content you requested Google to remove from your site. The data is displayed for URLs whose removals were requested using the Request a refresh of outdated content in Google Search tool.
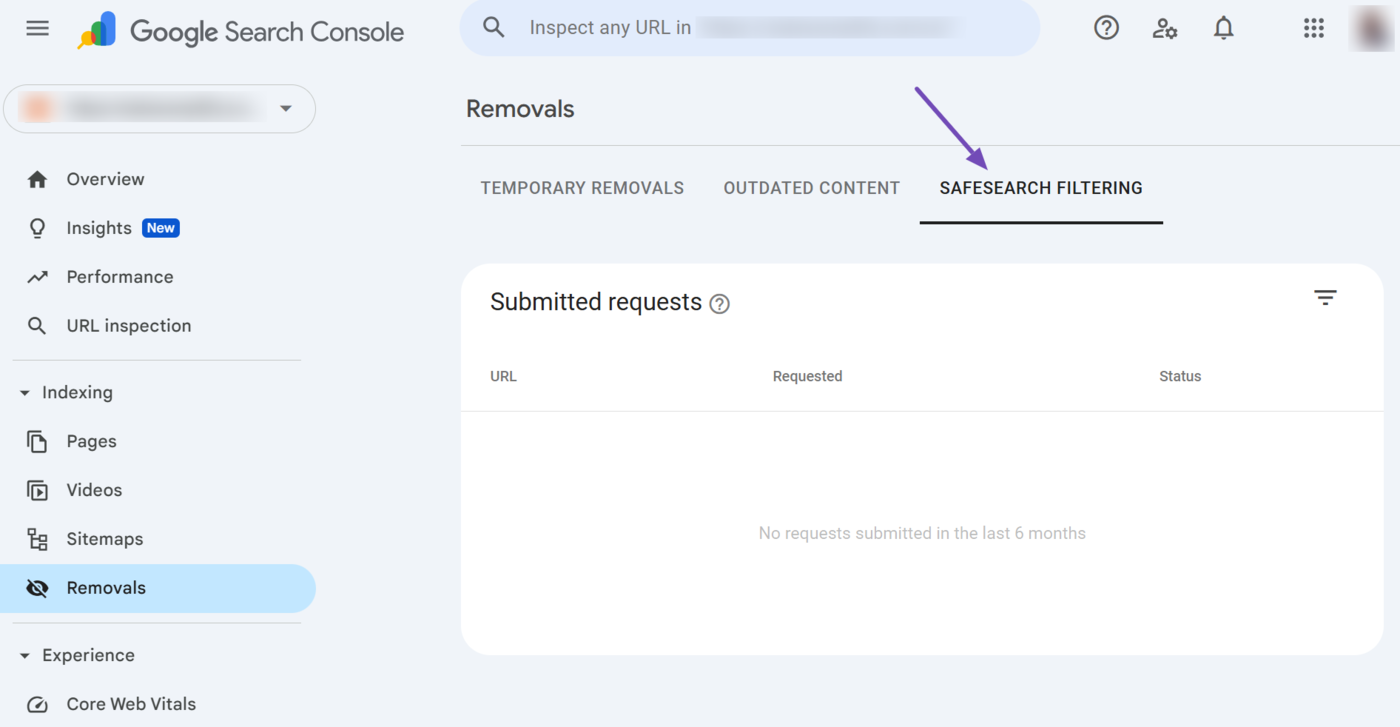
c. SafeSearch Filtering
The SafeSearch filtering field lists the pages that contain adult or inappropriate content. The URLs listed here are from reports submitted to Google using the Report inappropriate content tool. Google reviews content reported using the tool and lists the ones it decides are not family-friendly on this page.
9 Experience
The experience dropdown in Google Search Console shows how users perceive the overall usability of your site. The dropdown includes multiple reports, including Core Web Vitals and HTTPS. We will now explain the available reports below.
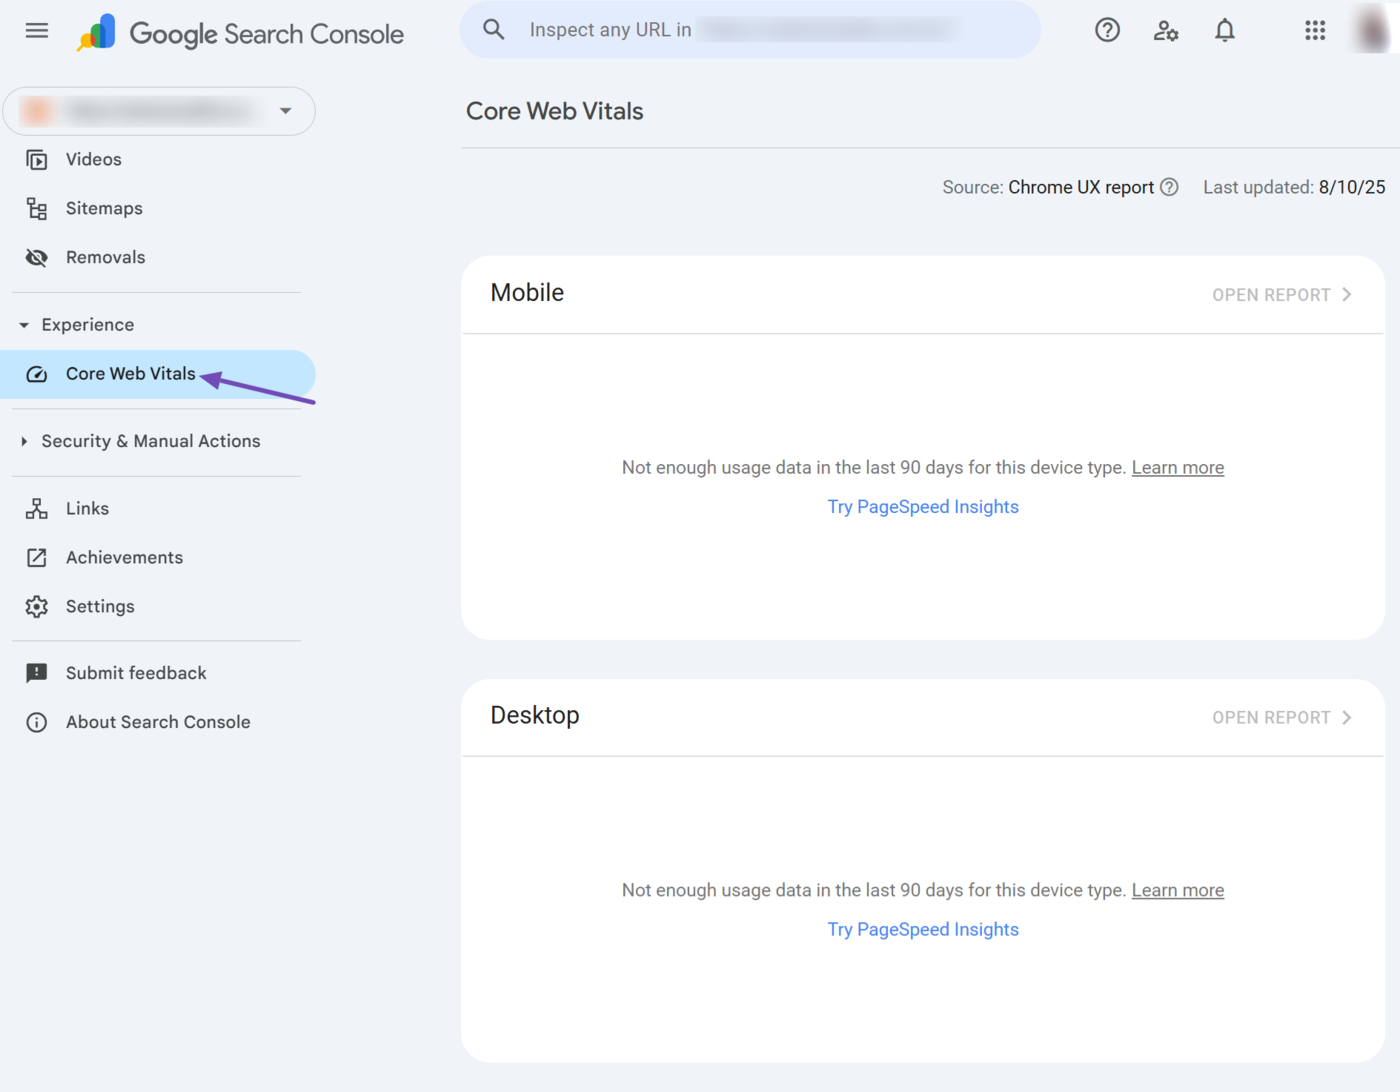
10 Core Web Vitals
The Core Web Vitals report provides you with insights into the performance of your site. It is among the reports provided in the experience dropdown and is gathered from real-life users. This report is split into smartphone and desktop reports.
The Core Web Vitals report is based on three metrics:
- Largest Contentful Paint: Measures how quickly the page loads
- Cumulative Layout Shift: Measures how much the content on the page shifts as page resources like text and images load
- Interaction to Next Paint: Measures how long it takes the resources on the page to provide feedback indicating a user interaction was successful
The report will contain a status indicating whether the URL’s Core Web Vitals need to be improved. A page can have one of three URL statuses:
- Poor
- Need improvement
- Good
You should know that all three metrics must be “good” for the entire URL to be considered good. If two metrics report good while the third is poor, the URL will be listed as poor.
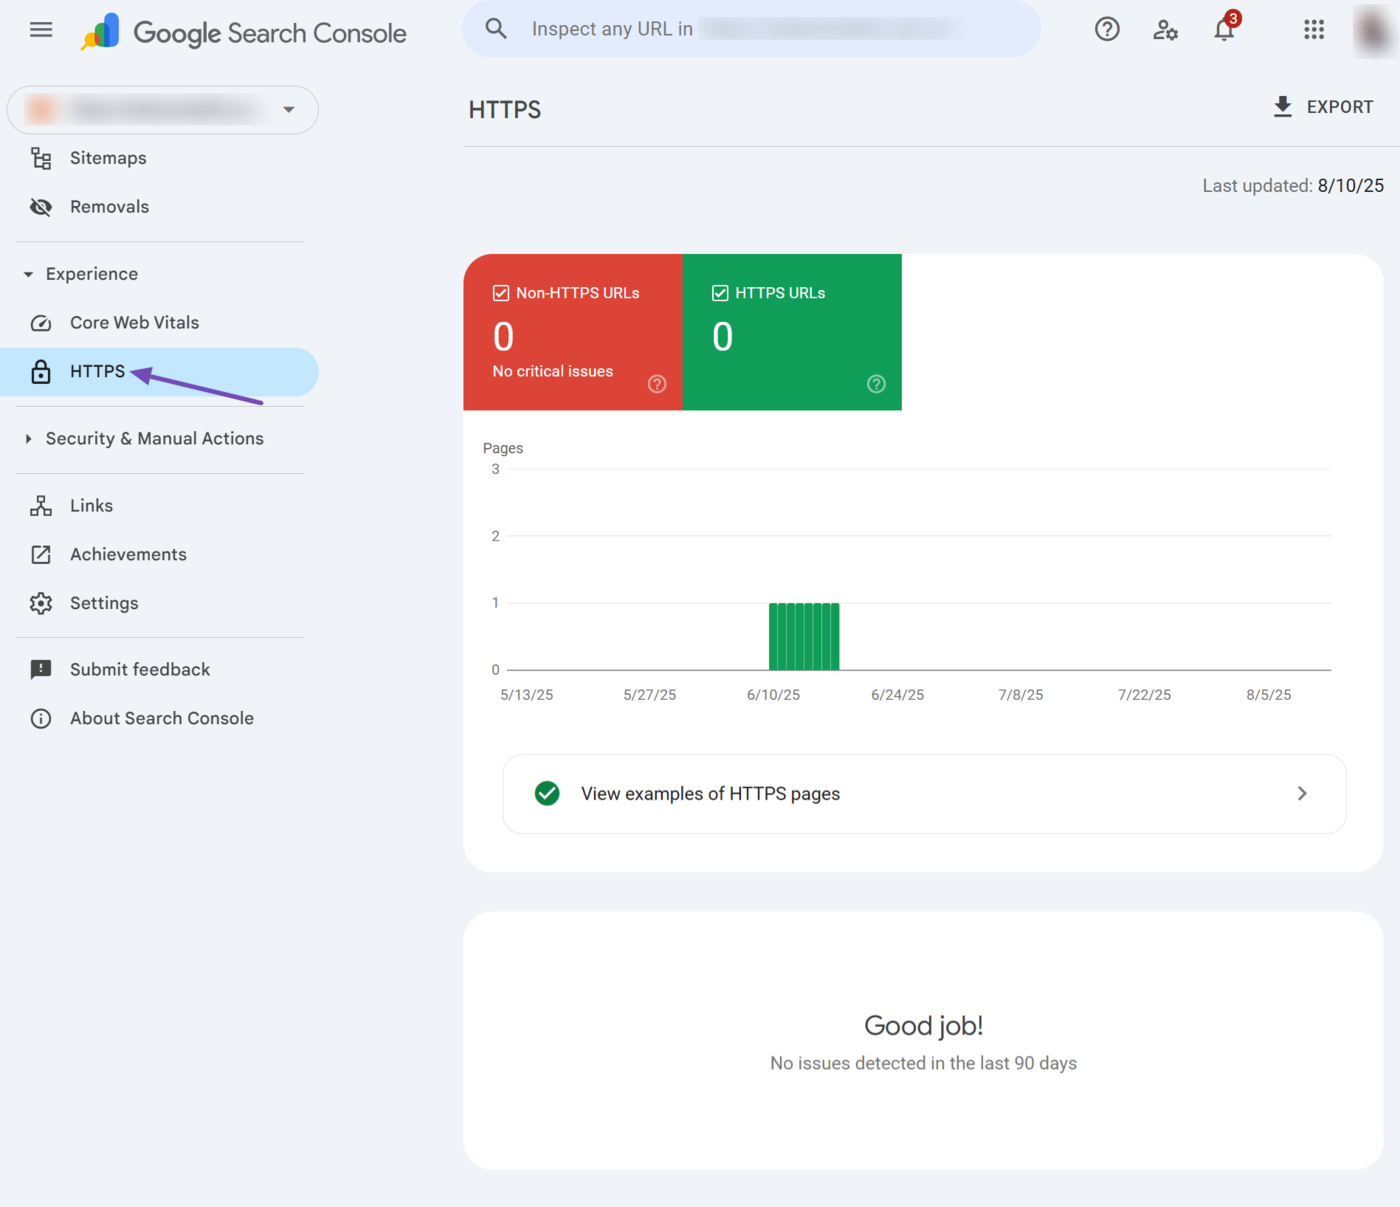
11 HTTPS
The HTTPS report shows you the number of HTTP and HTTPS pages on your site. It is among the reports provided in the experience dropdown, and only reports pages that Google has indexed.
For reference, Google recommends serving your pages over HTTPs and will often serve the HTTPs version of a page when both versions are available.
12 Shopping
The shopping dropdown contains multiple shopping-related reports that allow you to monitor your product’s performance across multiple Google shopping services including Google Images, the Shopping tab, and the product rich results (also known as rich snippets) on the Google search results page.
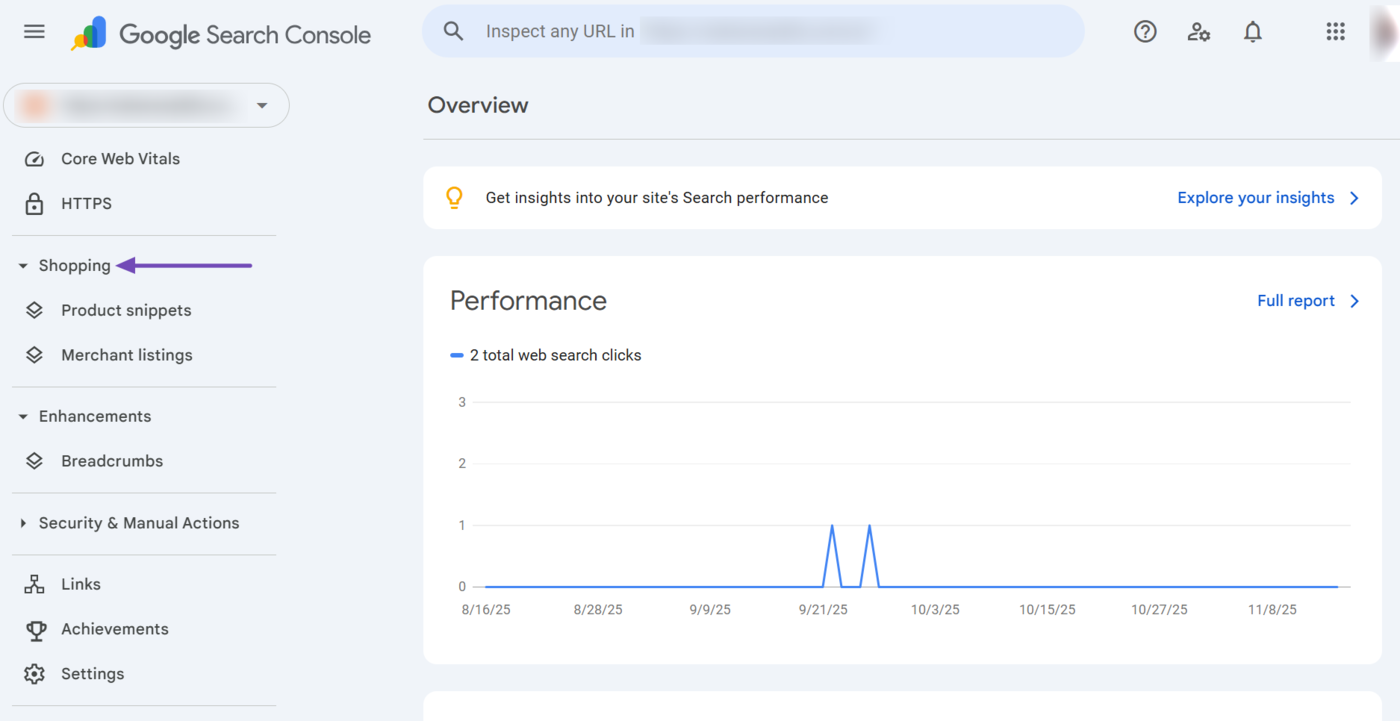
The shopping dropdown is only displayed for e-commerce sites that have an active Google Merchant Center account and product structured data on their site. The dropdown contains three reports, including the:
- Product snippets
- Merchant listings
- Merchant opportunities
We will now discuss them below.
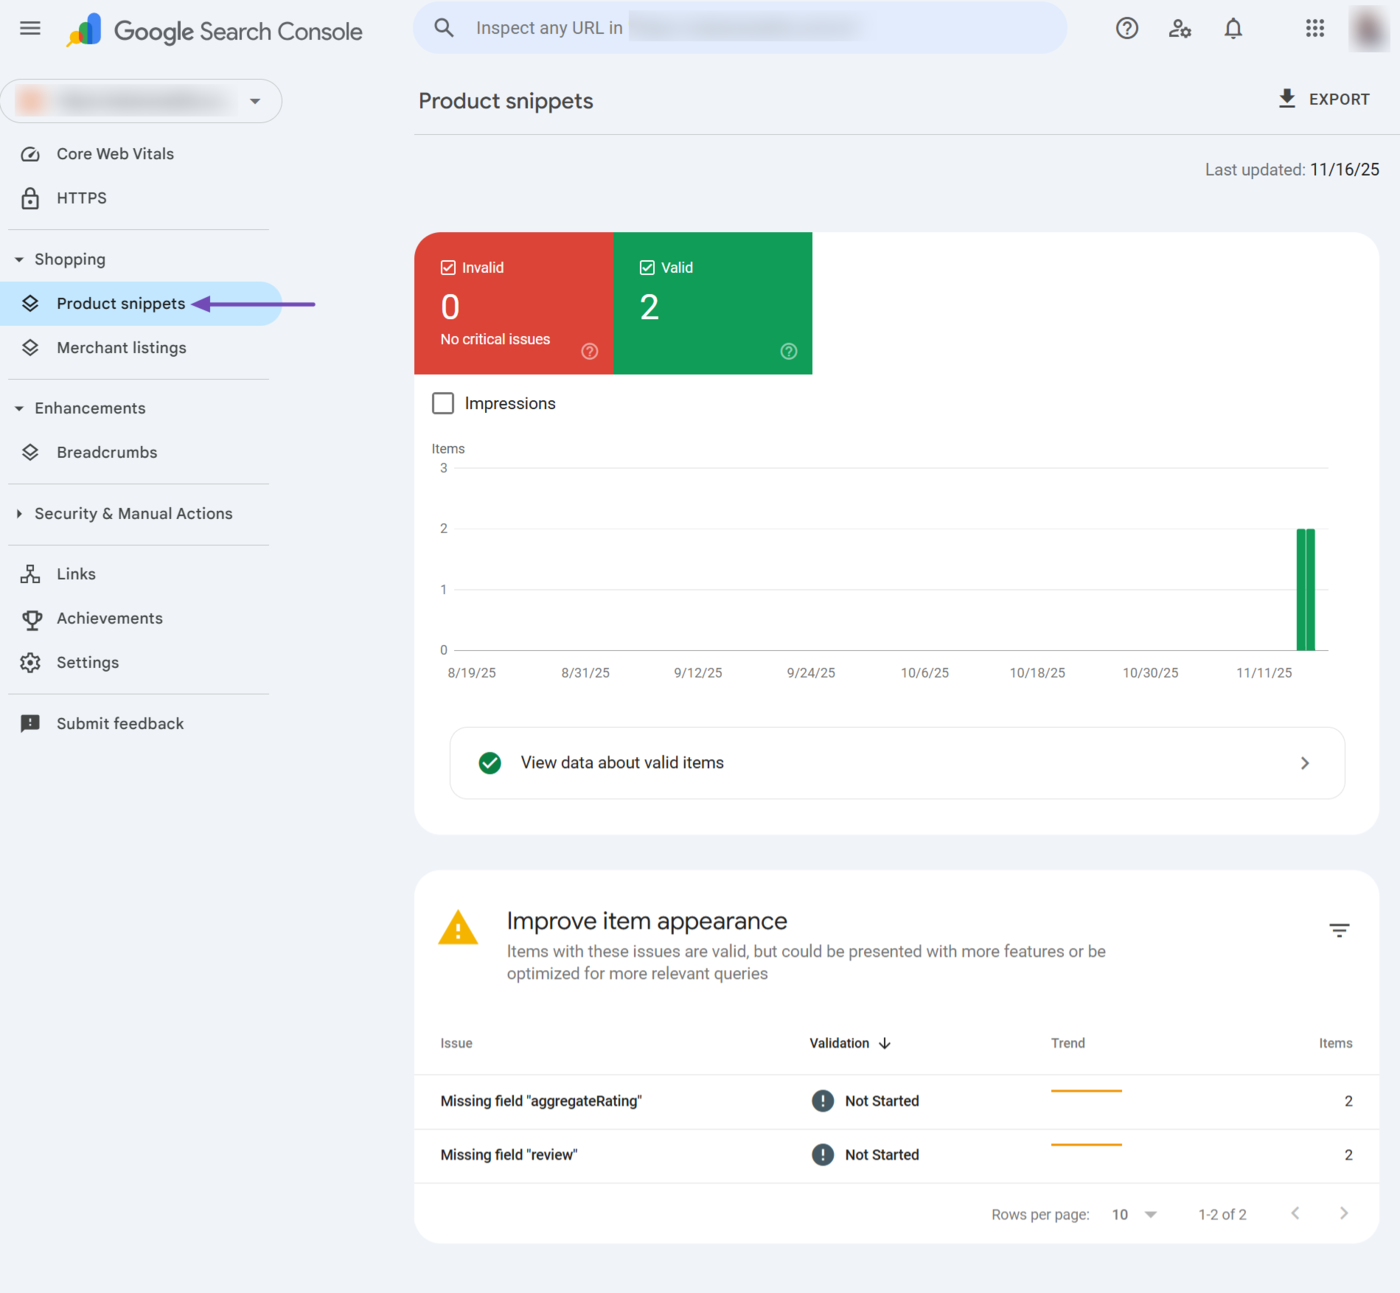
13 Product Snippets
The product snippets report shows the details of the product structured data Google detected on your site. This report shows the valid and invalid product structured data, along with potential issues that Google has detected. It is among the reports in the shopping dropdown.
The product snippet report includes multiple reports and options, including the:
- Valid and invalid product snippets report
- View data about valid items option
- Improve item appearance option
a. Valid and Invalid Product Snippets
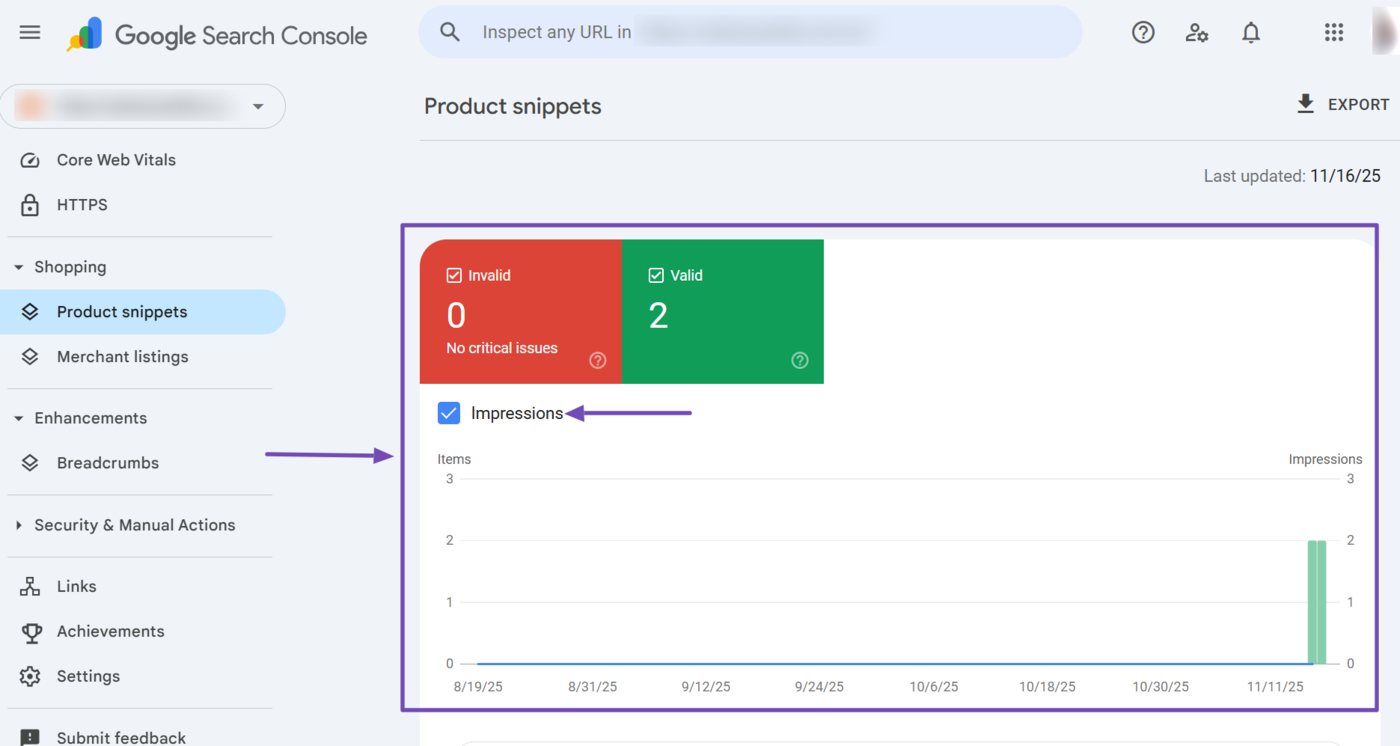
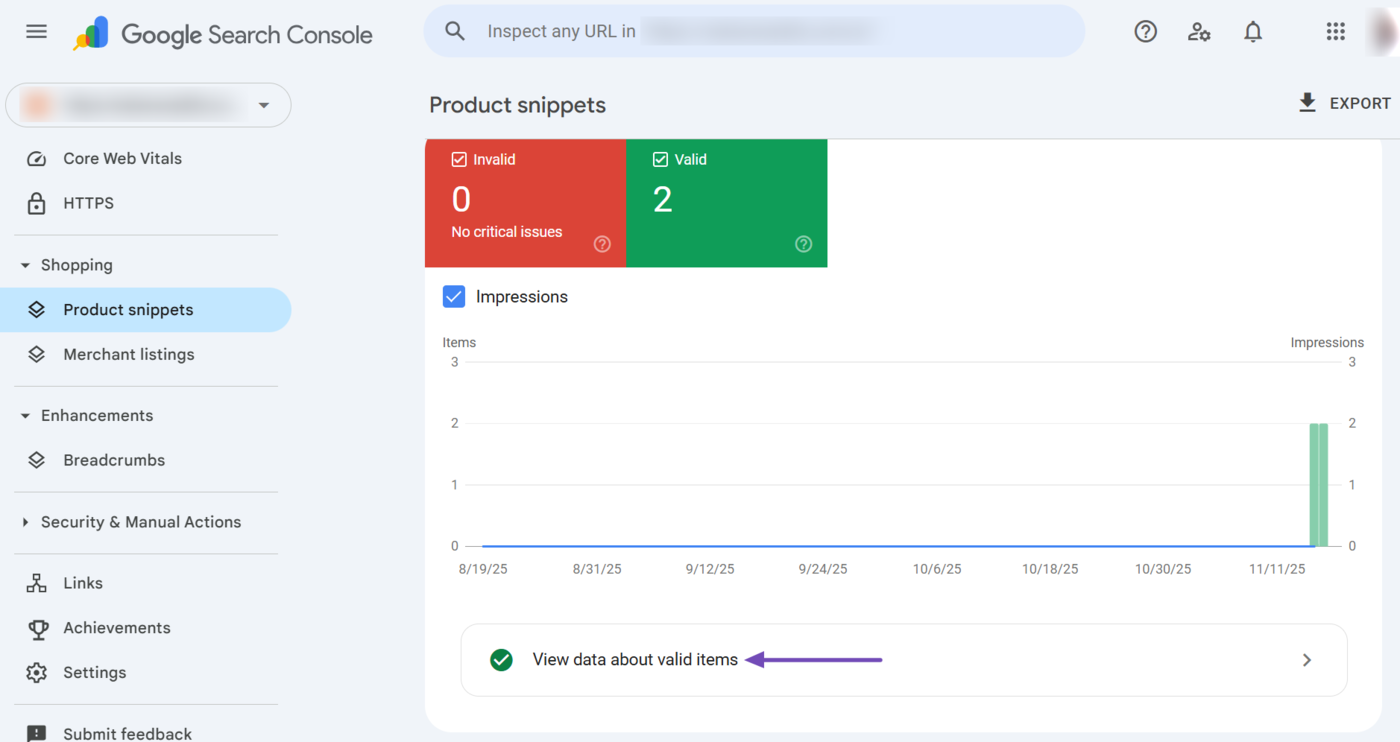
At the top of the product snippets report is a graph showing the number of valid and invalid product structured data on your site. A product structured data is considered invalid if it contains a major issue that prevents Google from using it as a rich snippet. For example, a missing image.
You can also enable the Impressions checkbox to view the impressions the valid product snippets received on Google.
b. View Data About Valid Items
To view the details of the valid product snippets on your site, click the View data about valid items, as shown below.
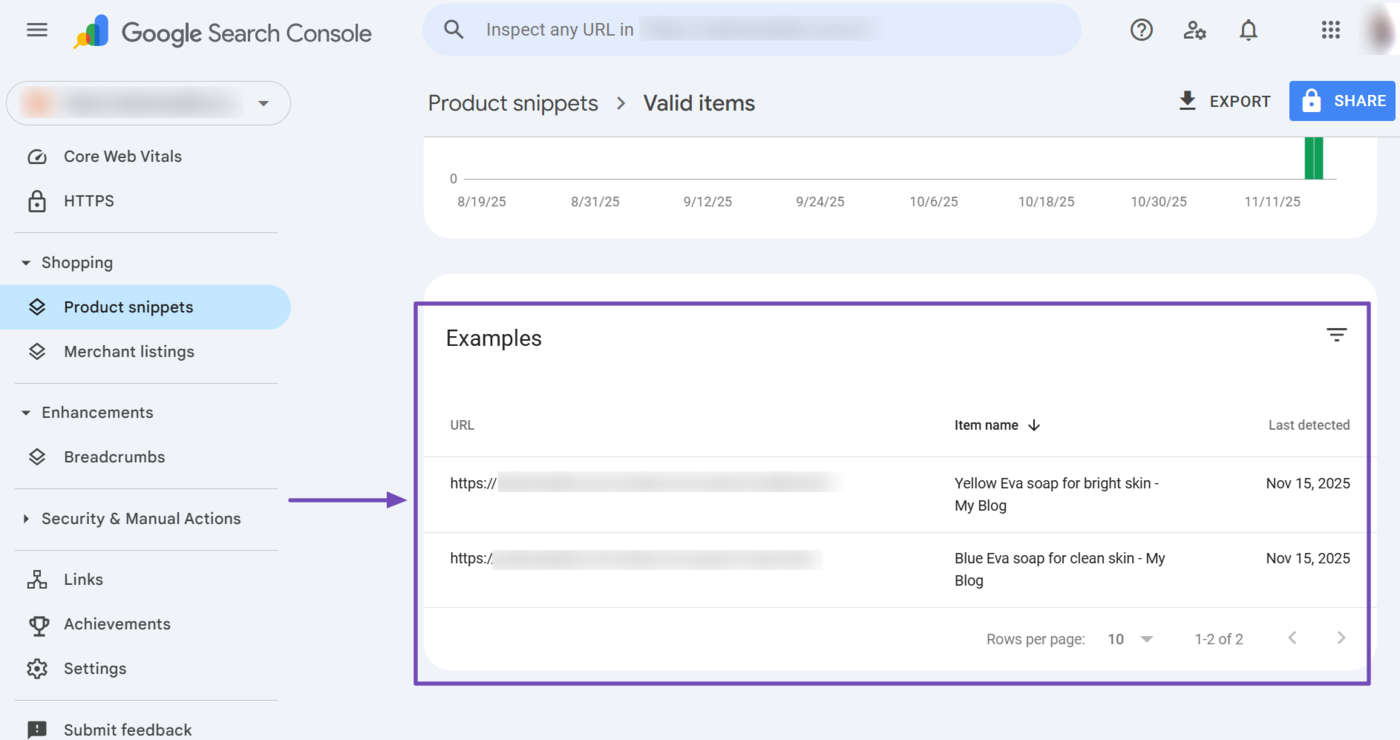
Now, scroll down to the Examples field. You will see the name and URL of the products with valid product structured data. Click on any one you want to inspect.
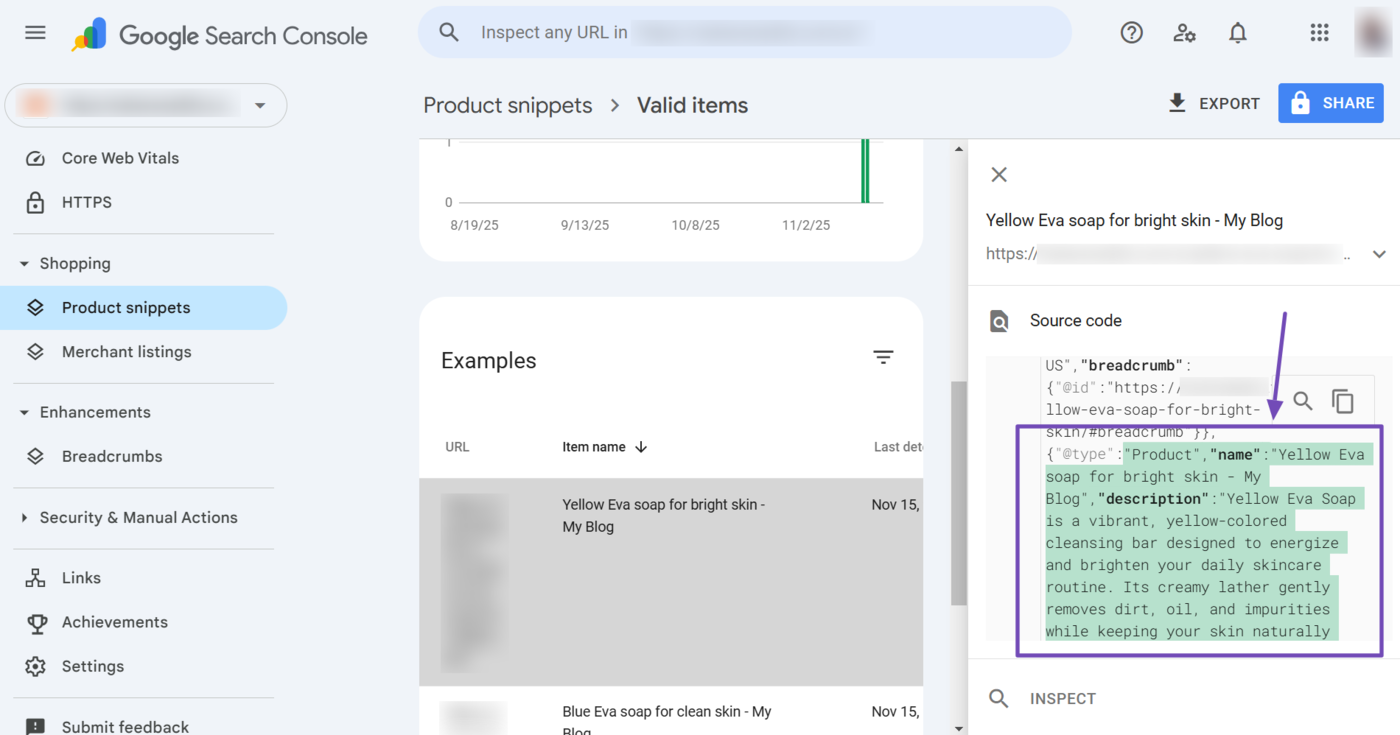
A sidebar showing the page’s source code will open up with the product structured data highlighted. You can now proceed to inspect it.
c. Improve Item Appearance
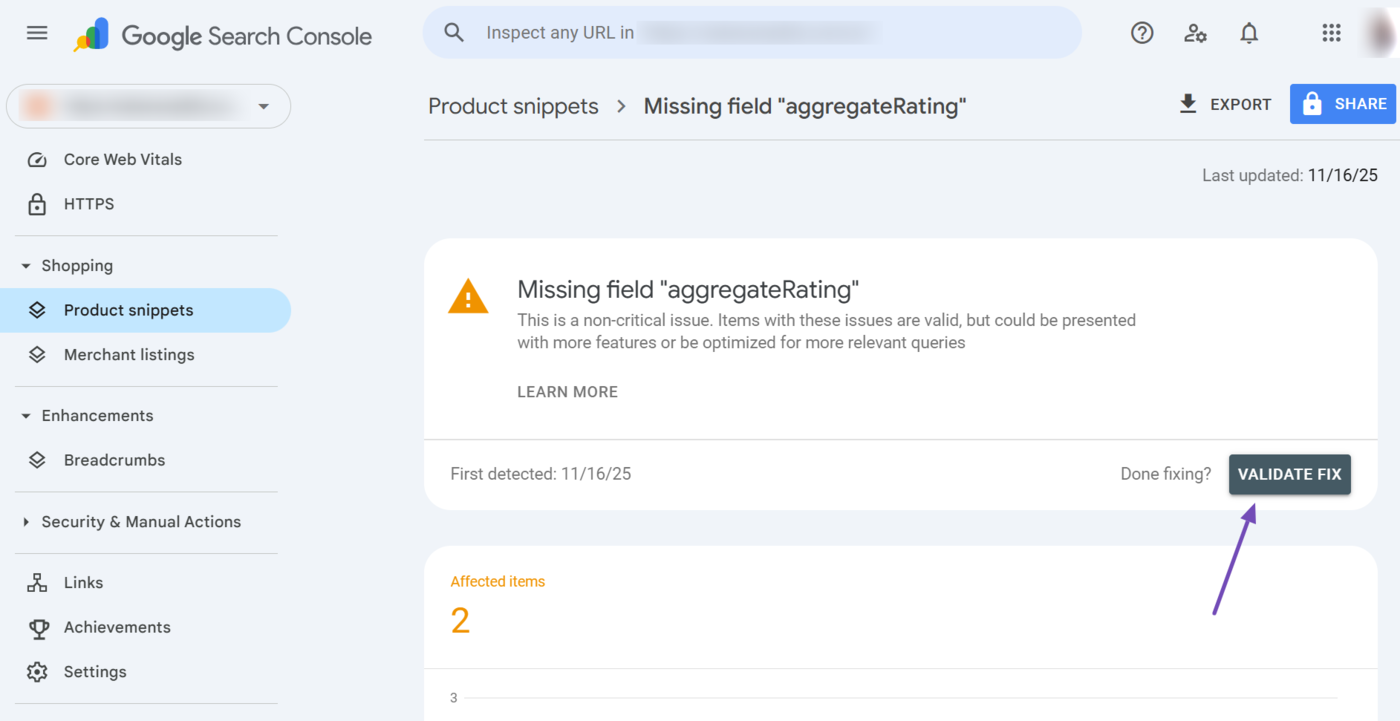
Now, your product structured data may be missing some fields that can enhance your product snippets. Note that your product snippet is valid without these fields, but filling in these fields can improve how your product appears in search.
To view the missing fields, scroll down to the “Improve item appearance” section. Then, click on any of the fields missing in your product structured data.
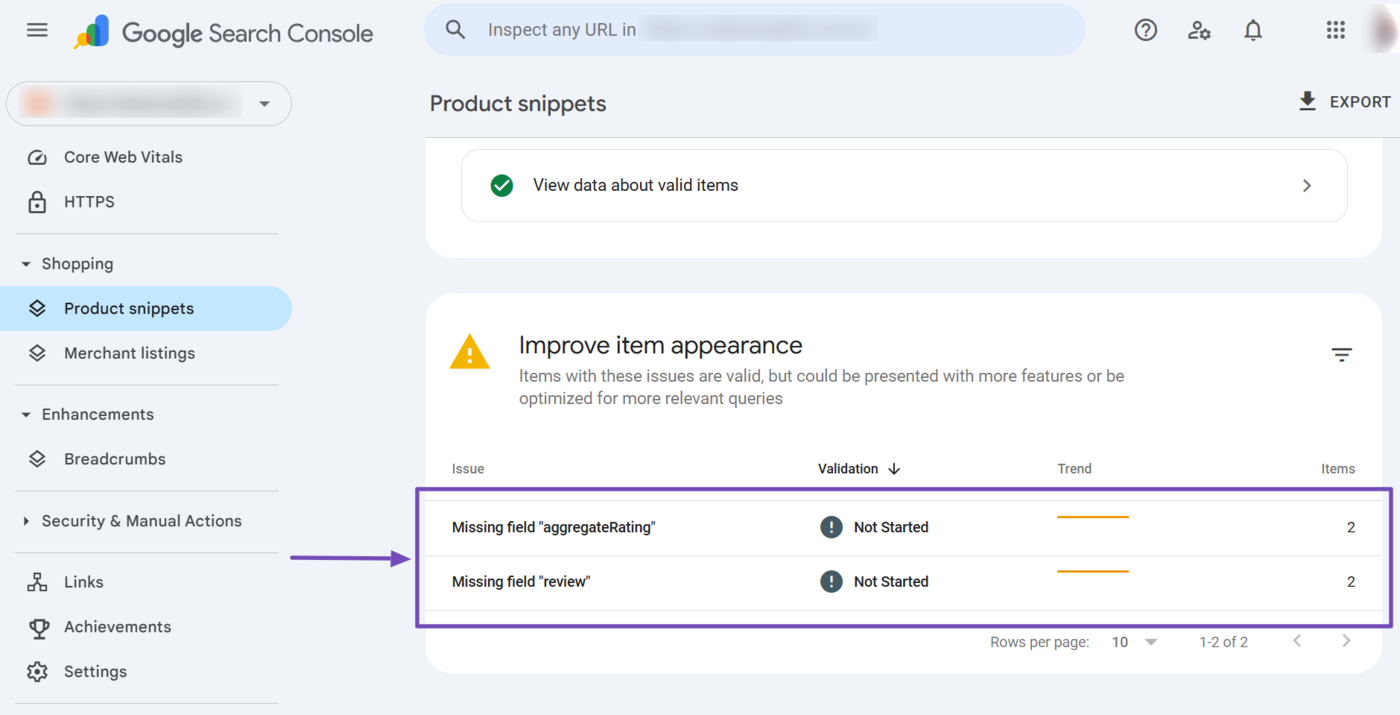
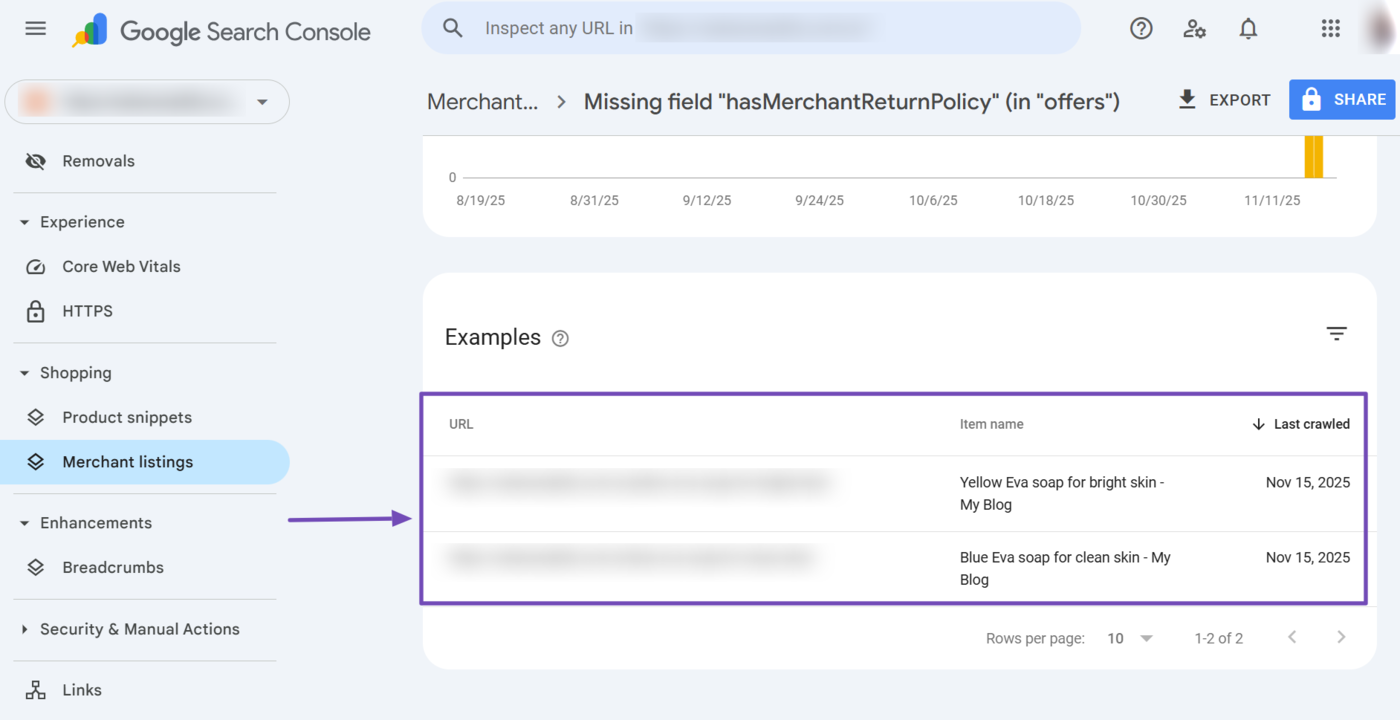
Once done, scroll down to the Examples field. You will be presented with the URLs and product names of the pages missing the fields.
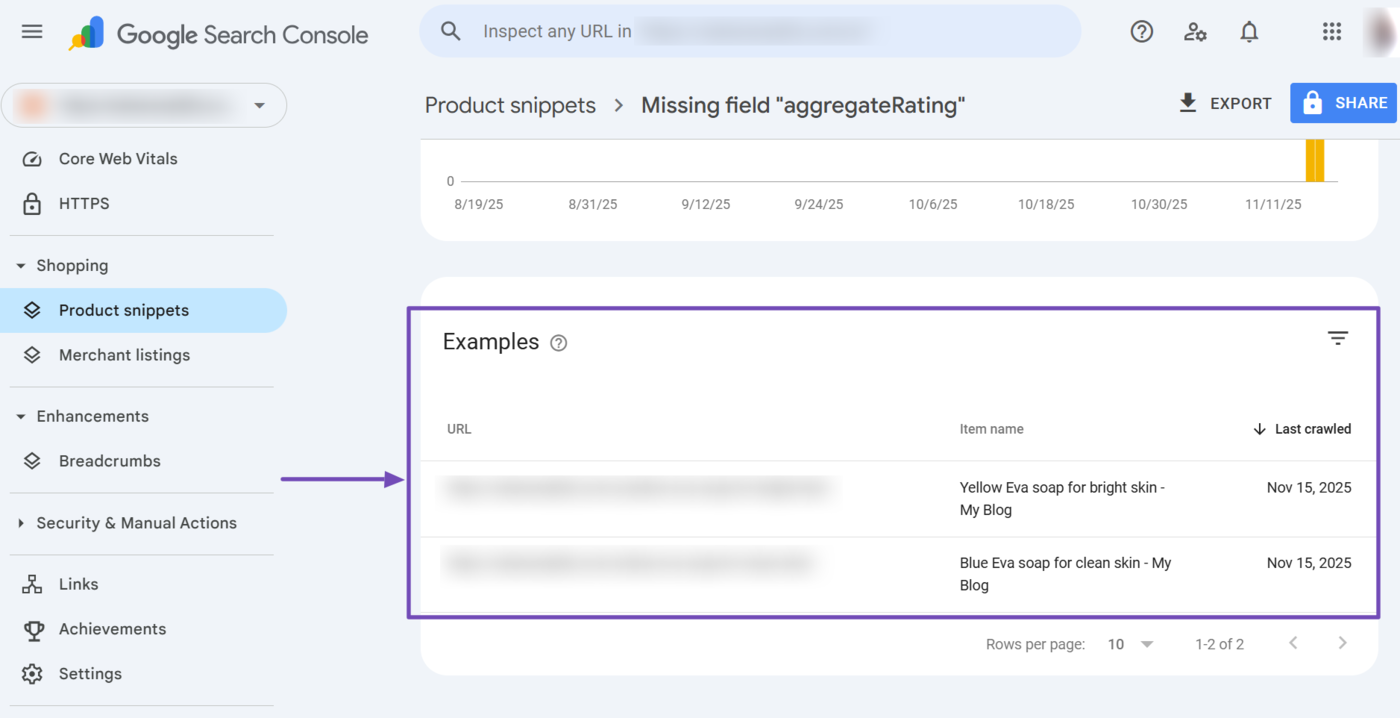
You can now head to the individual product pages to edit their product structured data and fill in the missing fields. Once done, return to the top of the page and click Validate Fix.
14 Merchant Listings
The merchant listings report shows the details of the merchant listing structured data Google detected on your site. It is one of the reports in the shopping dropdown.
The merchant listings structured data is an extension of the product structured data and highlights more specific details about your products, such as their price, availability, shipping information, and return information.
The merchant listings report is structured into multiple reports and options, including the:
- Valid and invalid merchant listings report
- View data about valid items option
- Improve item appearance option
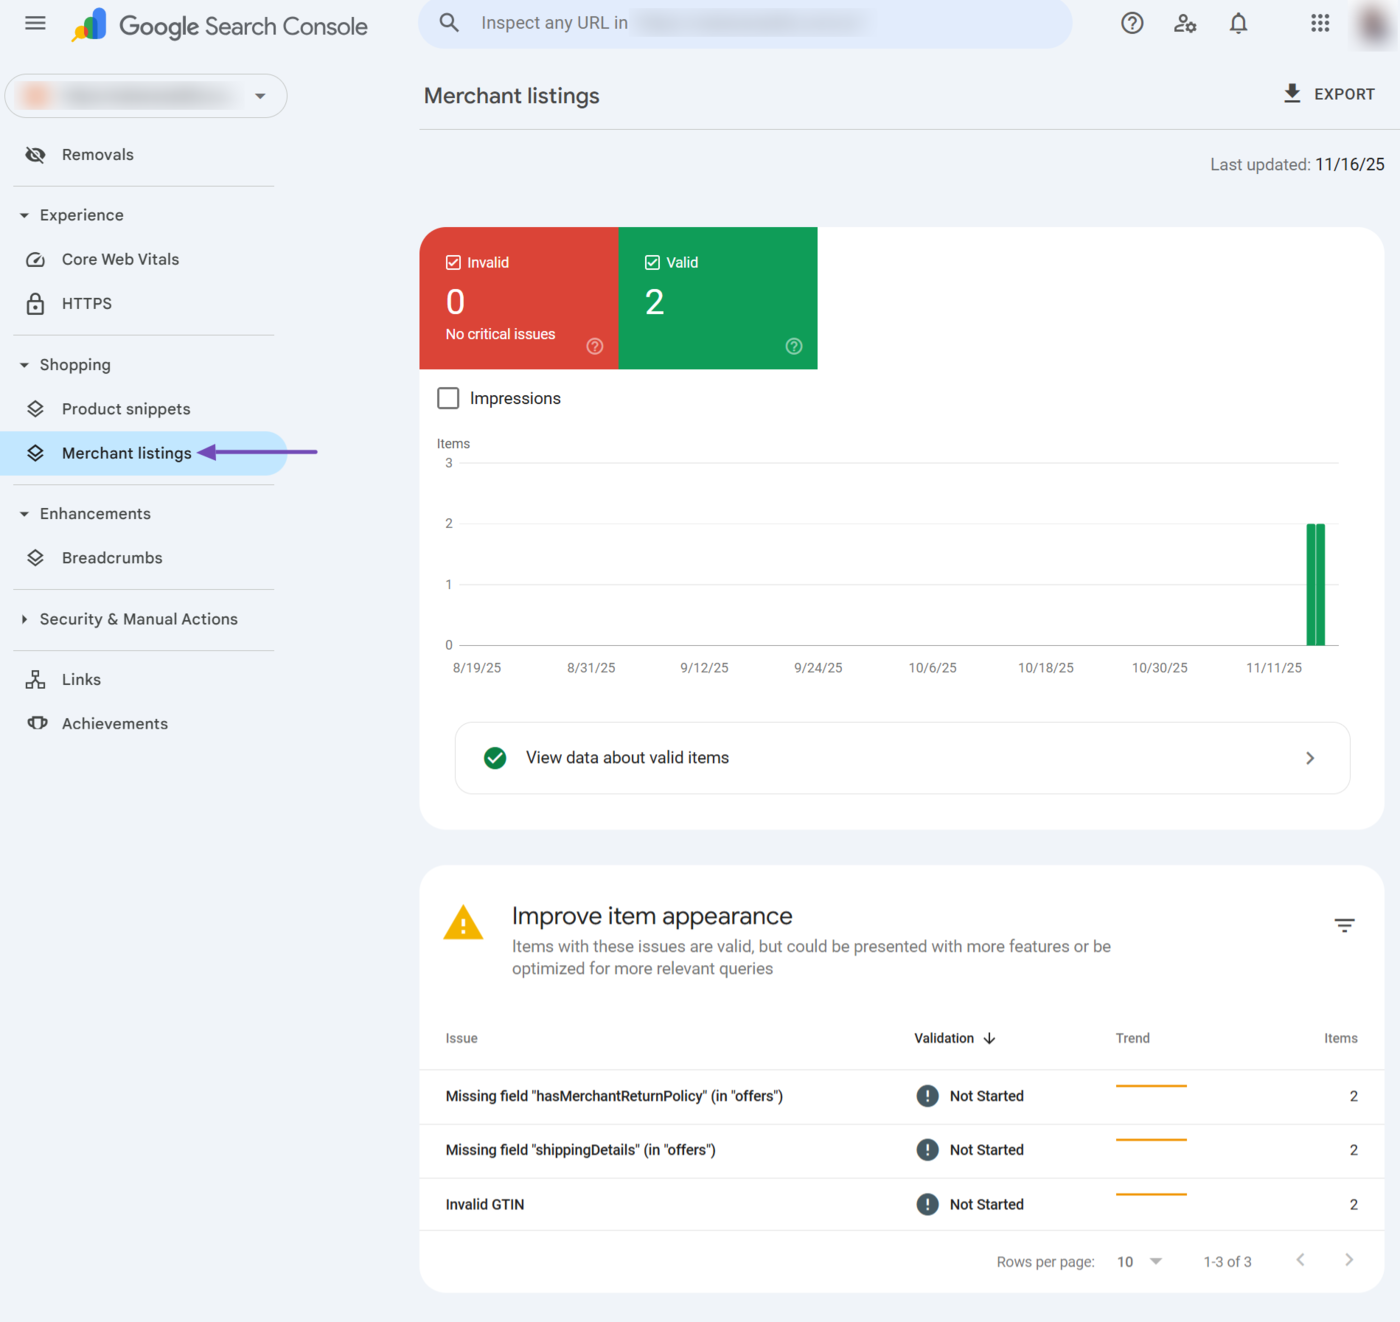
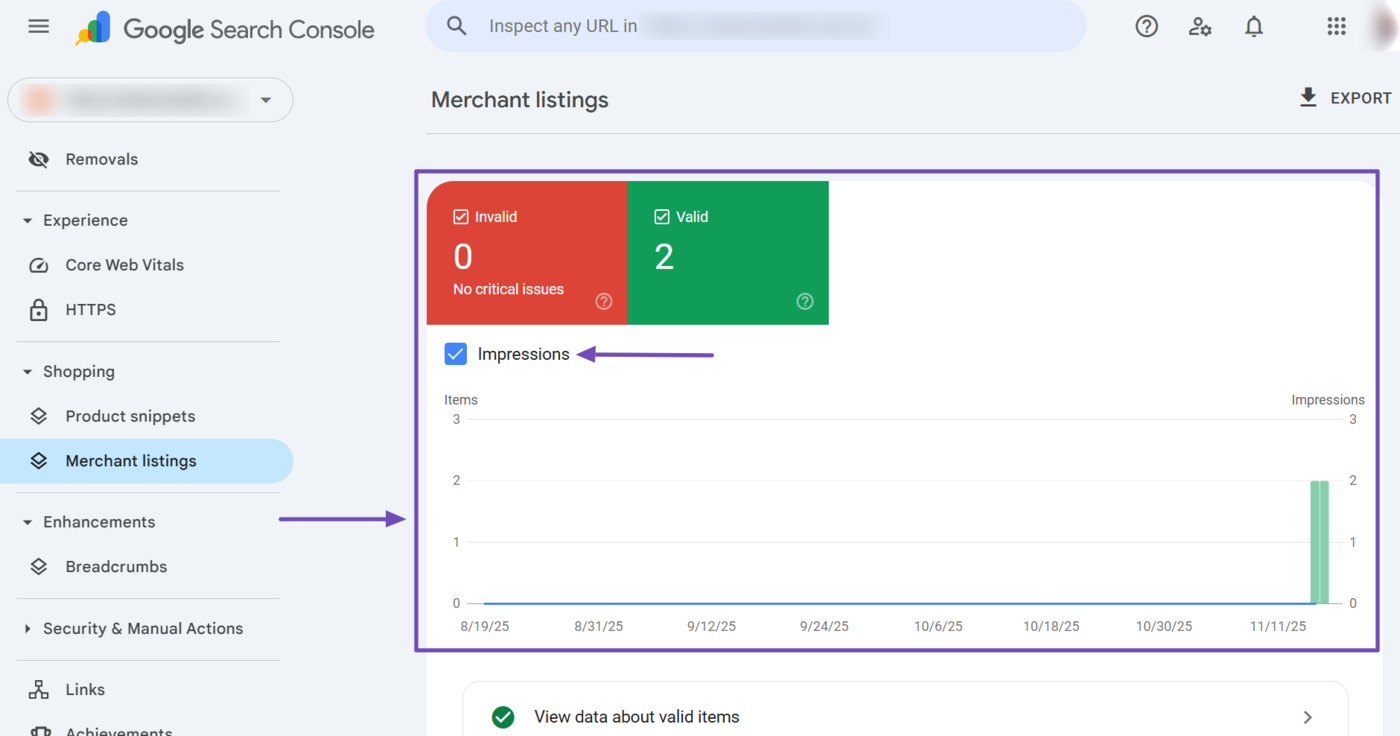
a. Valid and Invalid Merchant Listings
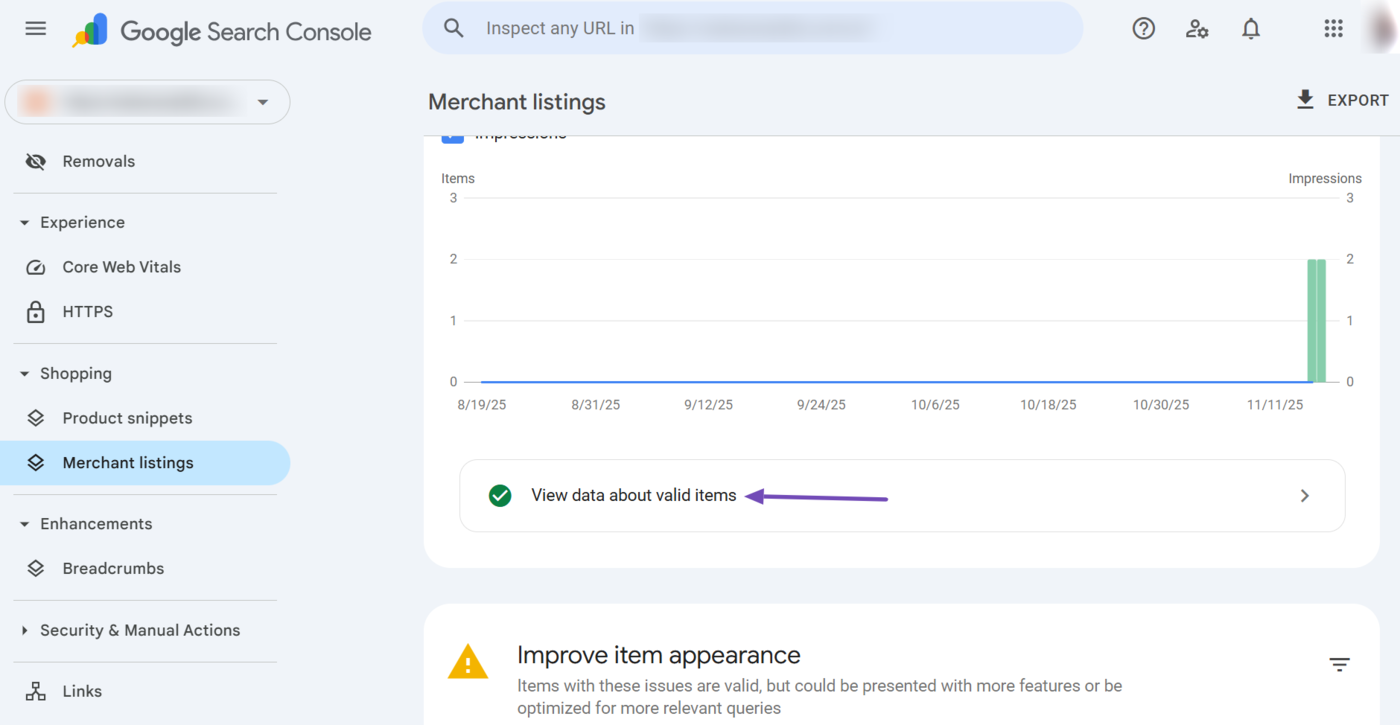
The merchant listing report specifies the number of valid and invalid merchant listings Google discovered on your site. You can also enable the Impressions checkbox to see the number of impressions the merchant listing has received on Google.
b. View Data About Valid Items
To view the details of the merchant listings on your site, click the View data about valid items option.
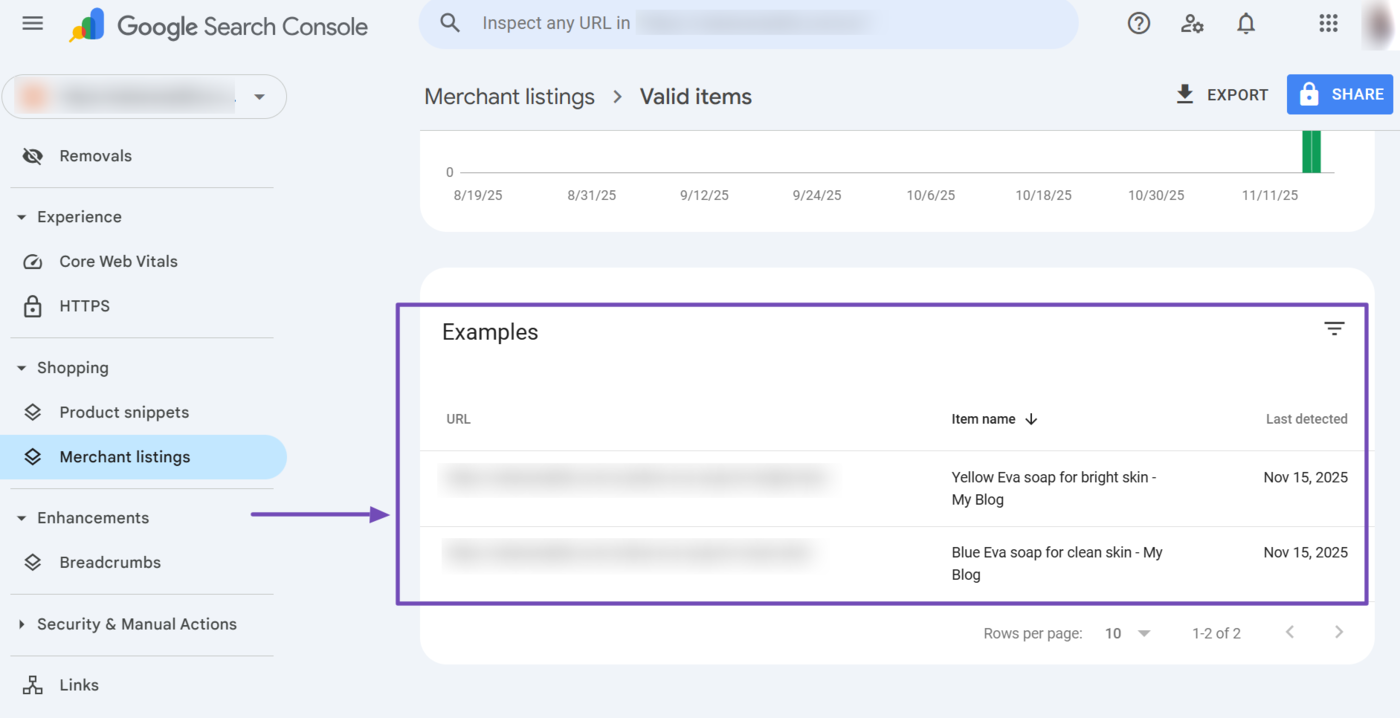
Once done, scroll down to the Examples field. You will find the name and URL of the pages with valid merchant listings. You can click on any of the URLs to view its merchant listing.
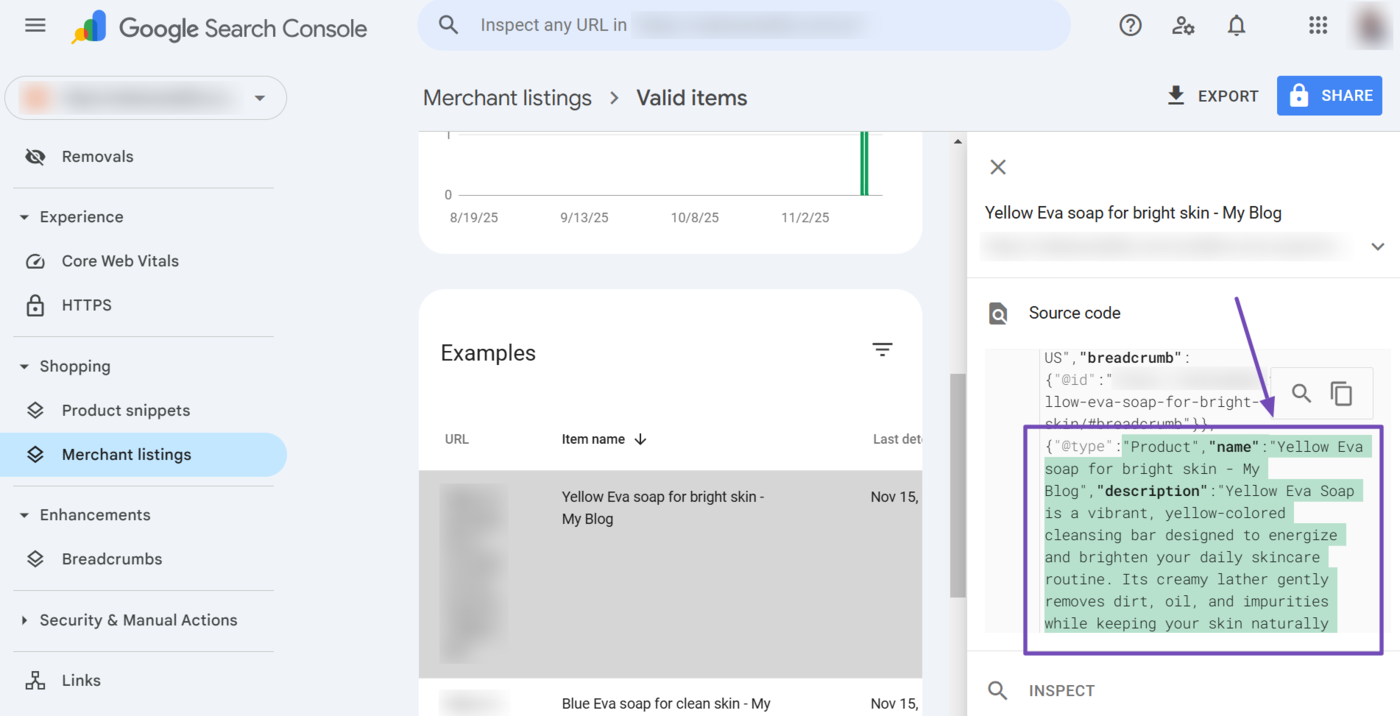
Once clicked, a sidebar showing the page’s source code will open up and the merchant listing properties will be highlighted, as shown below.
Note: The merchant listing structured data is part of the product structured data. So, it is the product structured data that actually opens up. You will review it for merchant listing properties such as price, currency, and product availability.
c. Improve Item Appearance
Google may have some recommendations on improving your merchant listing structured data. You will find these in the Improve item appearance field at the bottom of the page.
To get started, scroll down to the “Improve item appearance” field and click on any of the issues Google has detected.
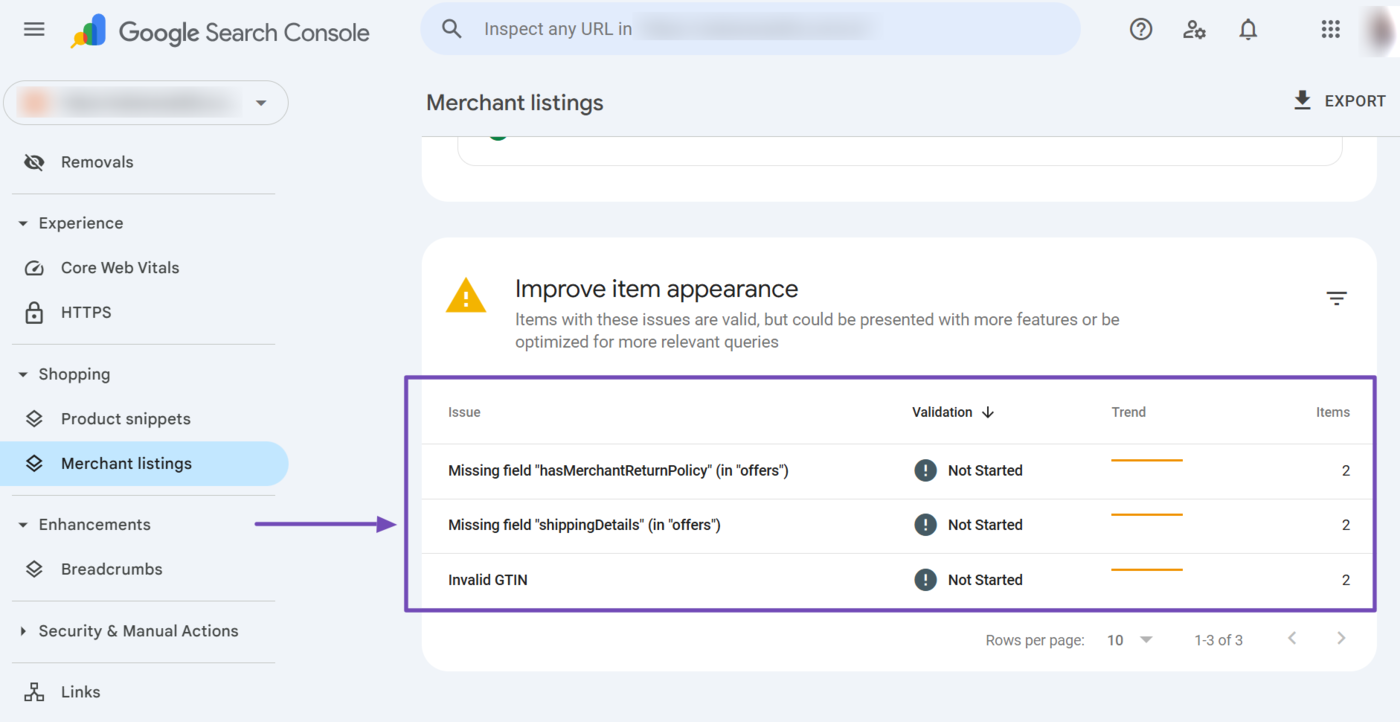
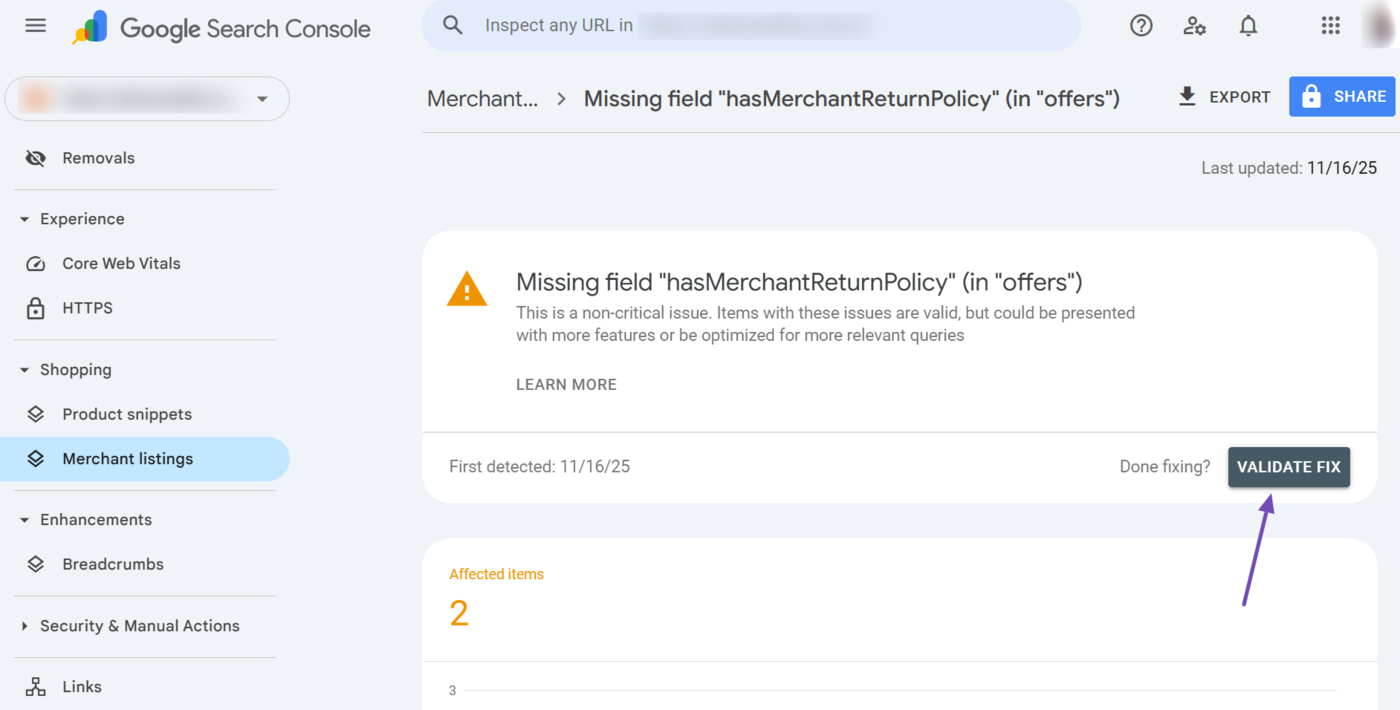
Once done, scroll down to the Examples field. Here, you will find the URLs and names of the pages missing the fields. You can now proceed to fix them.
After fixing the issues, scroll to the top of the page and click Validate Fix.
15 Merchant Opportunities
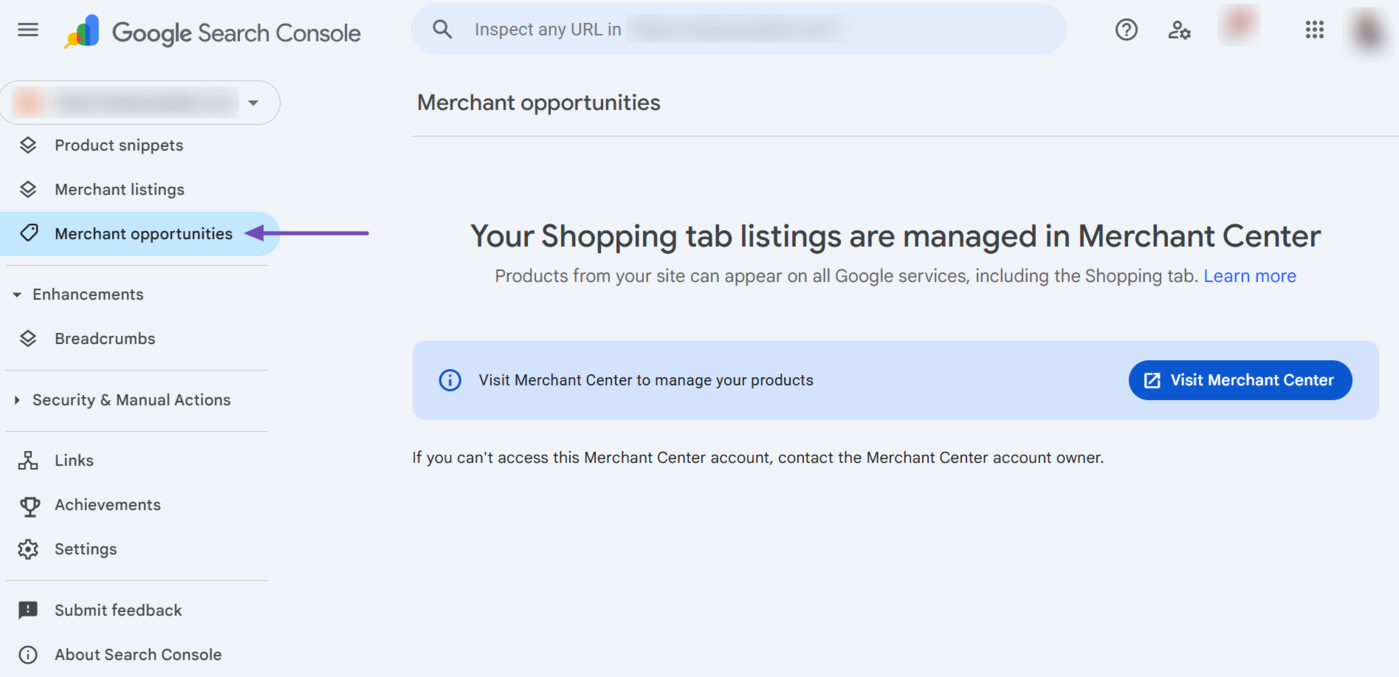
The merchant opportunities report recommends improvements you can implement to enhance how your store and products appear on Google. It is one of the reports available in the shopping dropdown.
Here, Google may inform you on where your products can appear and prompt you to manage them in the Merchant Center.
The report may also recommend adding multiple details to your site, product structured data, or Google Merchant Center, including:
- A shipping policy
- A return policy
- Payment methods
- Store ratings/reviews
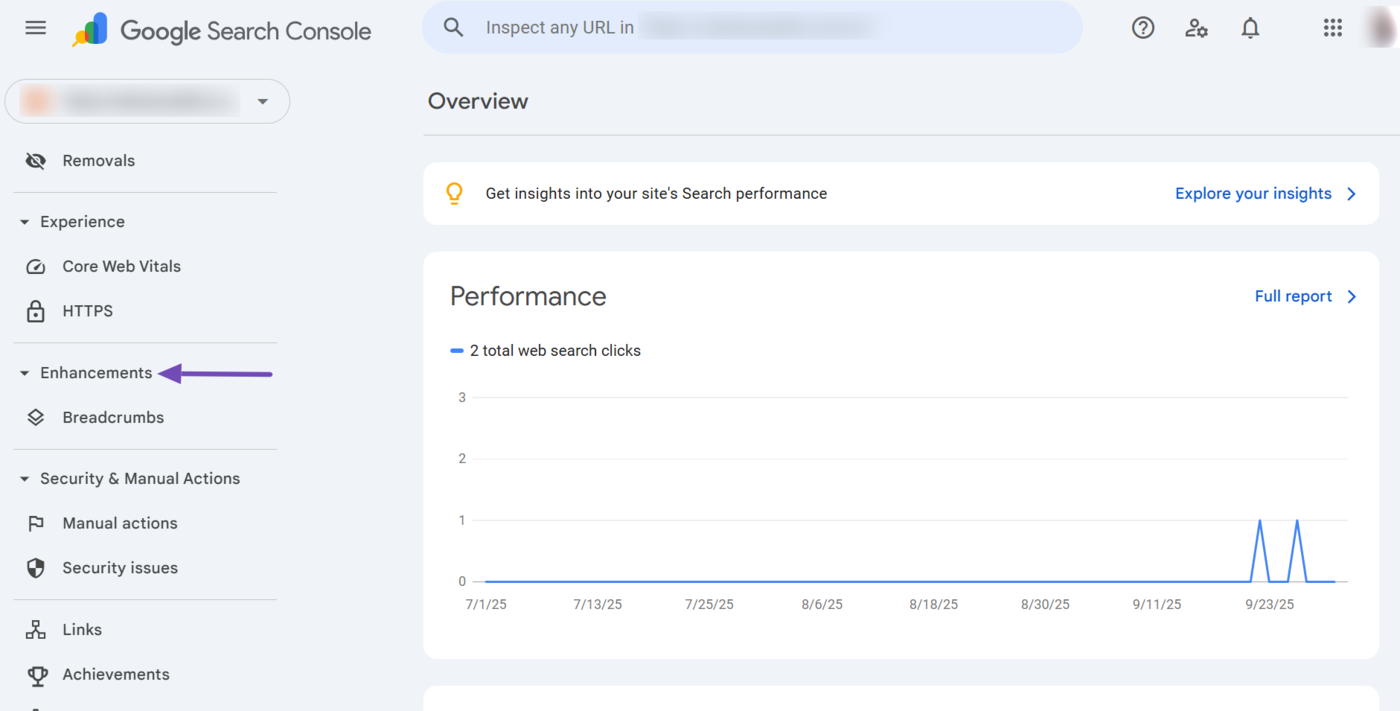
16 Enhancements
The enhancements dropdown highlights the additional features that Google detects on your site. These features enhance your site’s usability and appearance on search engine results pages.
The enhancements dropdown is only visible when Google has detected at least one enhancement on your site. Breadcrumbs are one common enhancement you will find here. We will discuss it below.
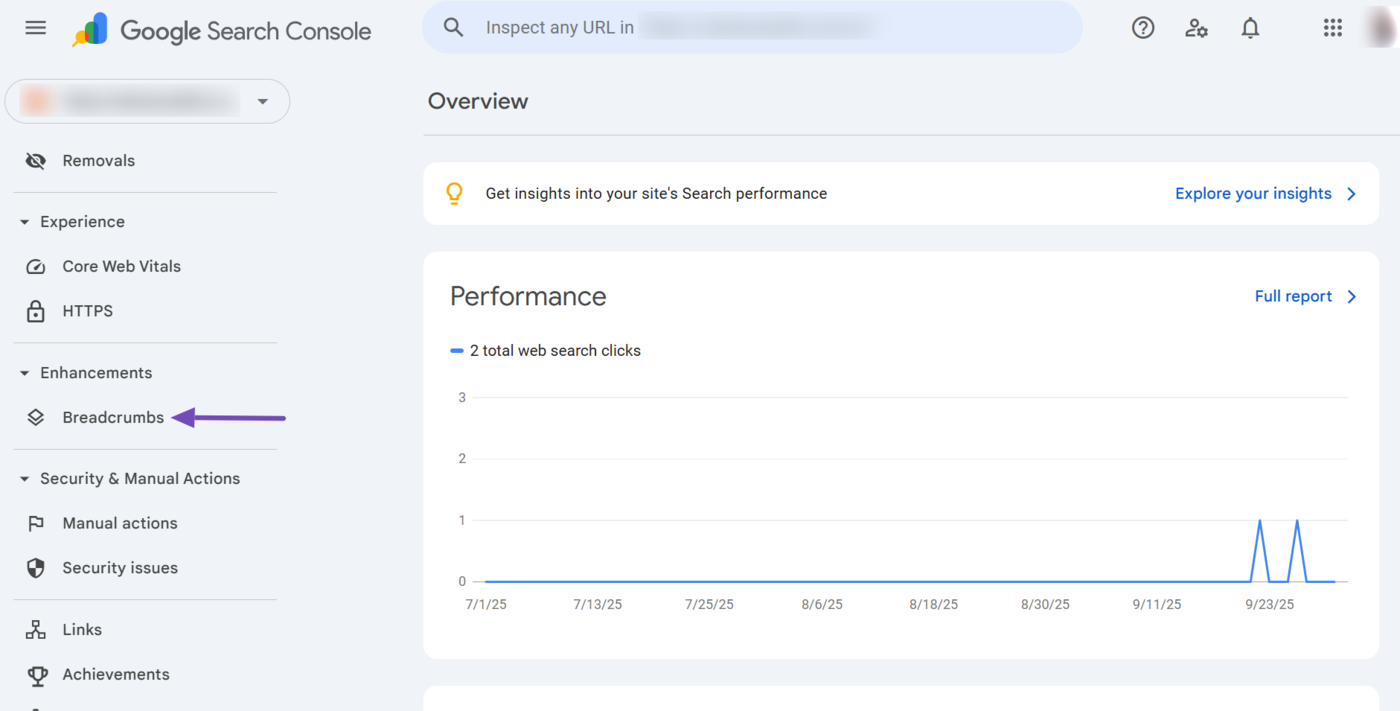
17 Breadcrumbs
The breadcrumbs report helps you to identify the valid and invalid breadcrumbs that Google has detected on your site. It is among the reports included in the enhancements dropdown.
18 Security & Manual Actions
The security & manual Actions dropdown displays the security issues Google has detected on your site, along with the manual action penalties Google has imposed against your site.
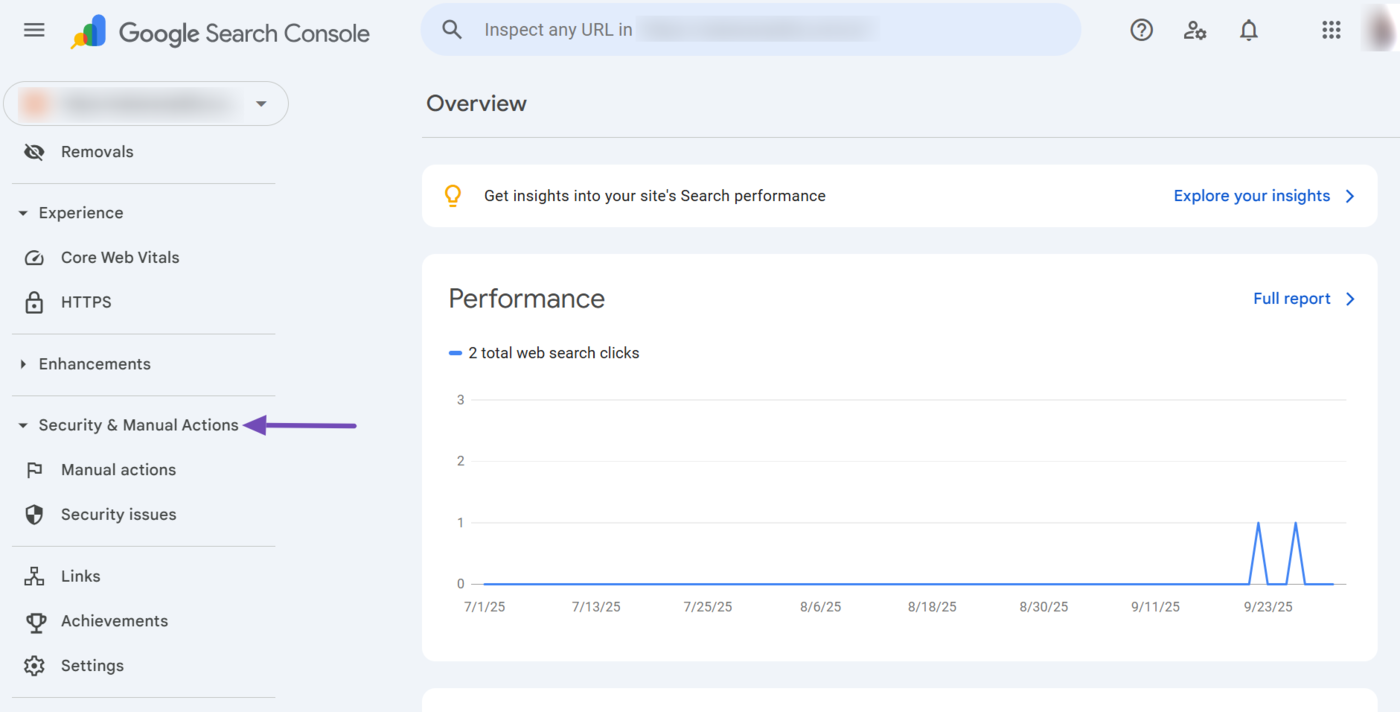
This dropdown contains two reports:
- Manual actions
- Security issues
We will explain them below.
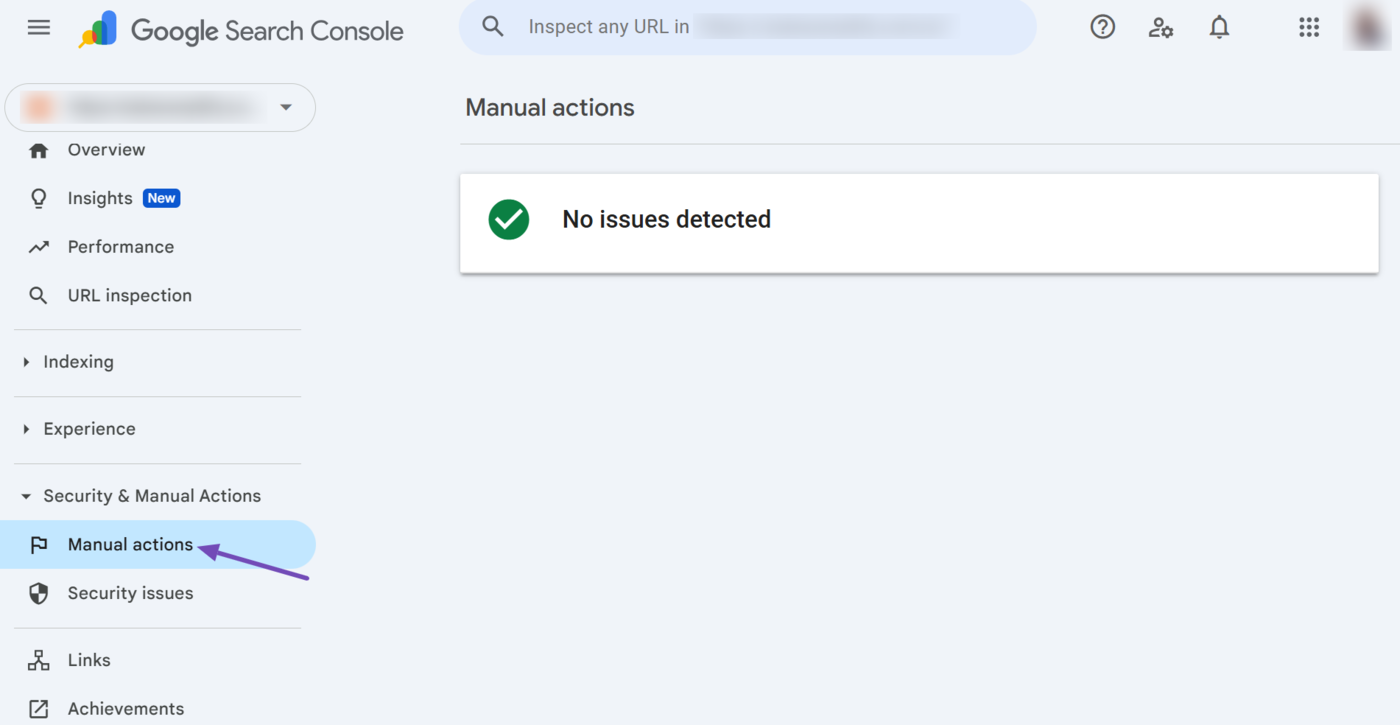
19 Manual Actions
The manual actions report lists the manual actions that have been applied to your site. Google only issues a manual action after a human reviewer concludes that a site has engaged in activities that violate its Search Essentials guidelines.
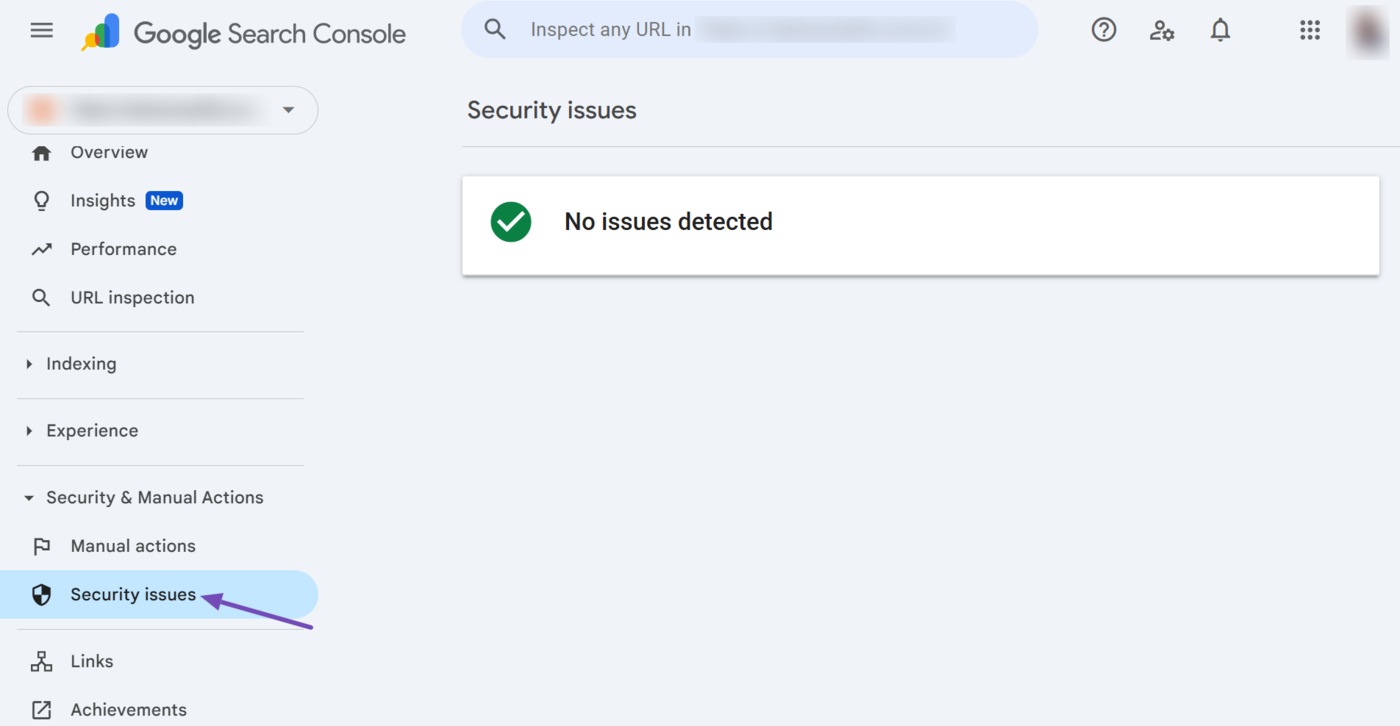
20 Security Issues
The security issues report details the security issues that Google has found on your site. Google expects you to fix these issues promptly, as they could allow hackers to compromise your site, inject malware, or display spam and other harmful content.
21 Links
The links report contains the details of the backlinks pointing to your site. The report is split into two sections:
Each section then contains multiple other reports.
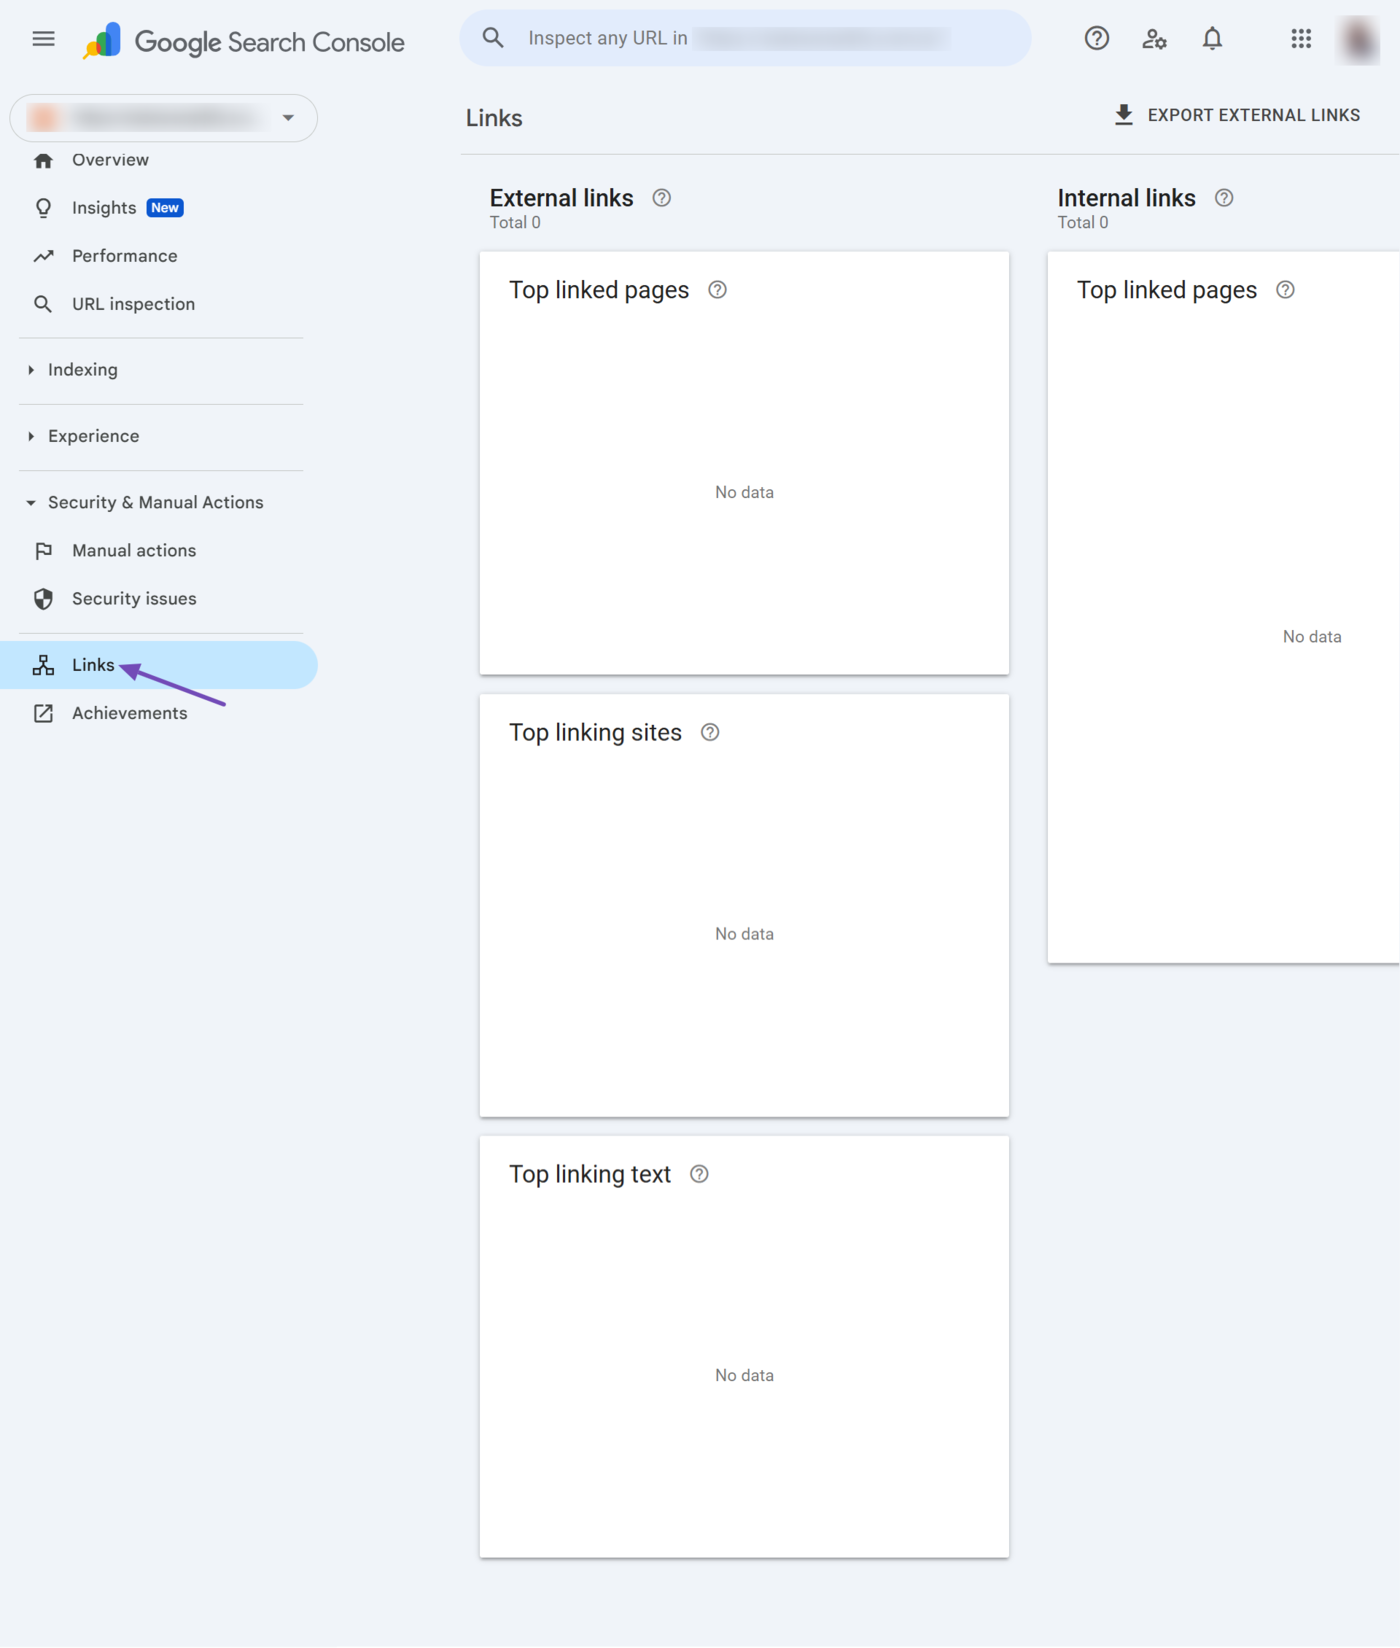
a. External Links
The external links report provides insights into the backlinks you receive from other sites. The insights provided include:
- Top linked pages: Lists the webpages that receive the most backlinks
- Top linking sites: Lists the sites that link back to you the most
- Top linking text: Displays the most common anchor text used by sites linking to you
- Top linking sites for a linking page: Shows the top sites that link to a specific page on your site. This only displays for pages included in the “top linked pages” report
- Backlinks from a given site to a given page: This shows the backlinks a specific page on your site receives from a specific site
b. Internal Links
The internal links report reports on the internal links on your site. The insights provided include:
- Top linked pages from within your own site: This shows the pages that receive the most links from other pages on your site
- Which pages link to a given page: This shows the pages that link to another page on your site
22 Achievements
The achievements tab in Google Search Console displays milestone badges and goals your site has earned or is progressing toward earning. This helps you to track your growth in a visual and motivating way.
The tab displays the milestones in two sections: In progress and achieved.
- In progress: This shows milestones your site is working toward, but yet to reach
- Achieved: This shows the milestones your site has already reached
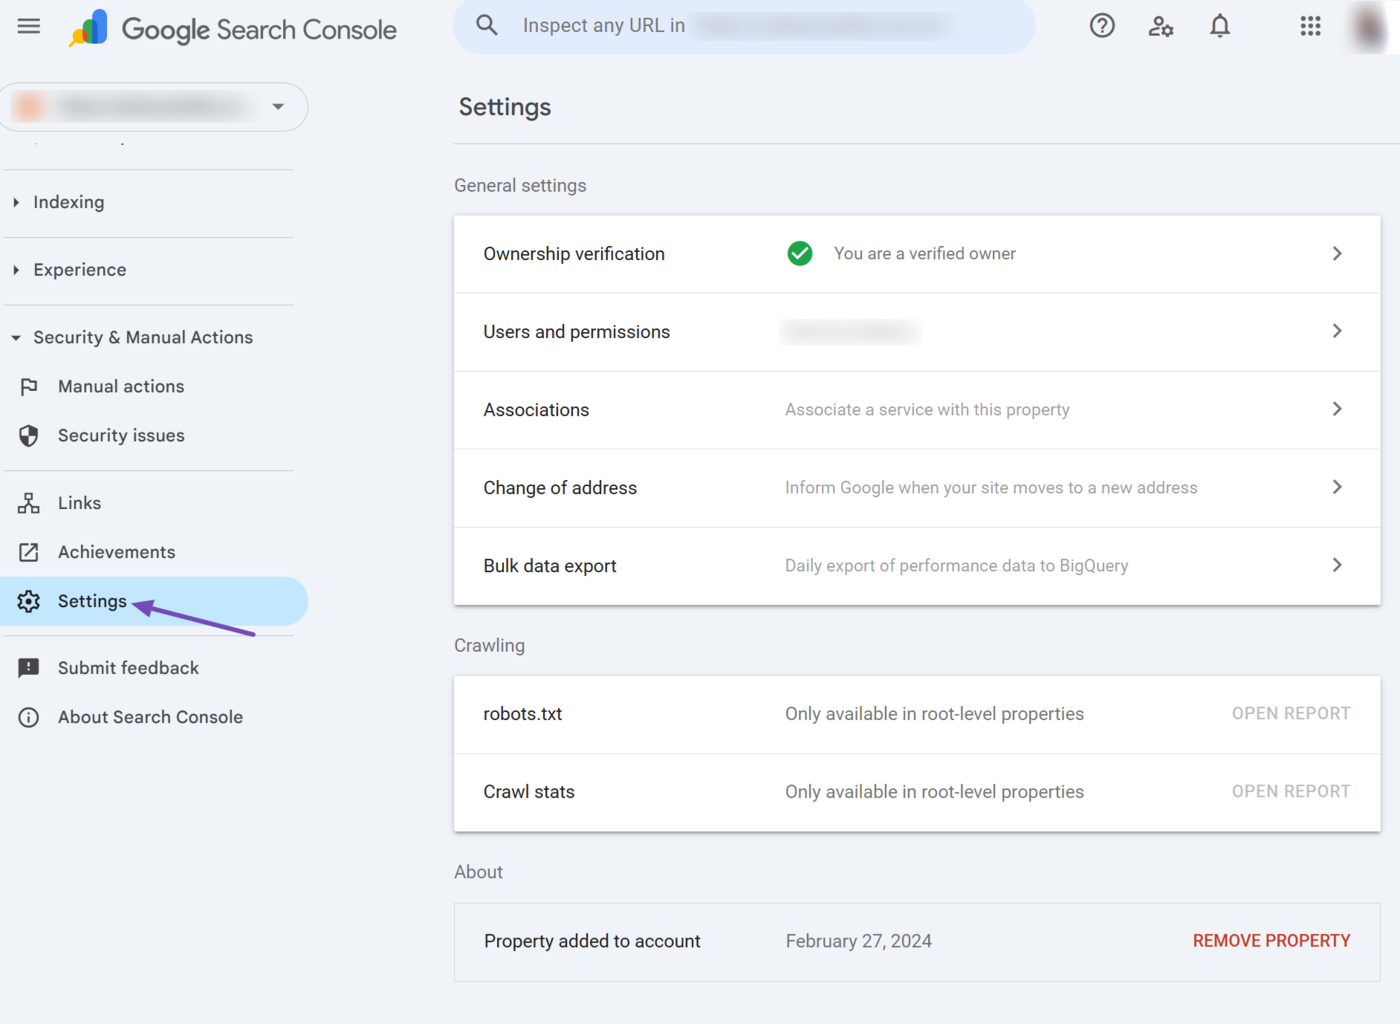
23 Settings
The settings option provides you with insights into your existing settings and allows you to modify the settings of your Google Search Console account. It also contains your robots.txt and crawl stats reports.
3 Ways to Improve SEO Using Google Search Console
The Google Search Console enables you to upload crucial data to Google and identify existing or possible issues affecting your SEO. Here are a few ways to use the Search Console to improve your SEO.
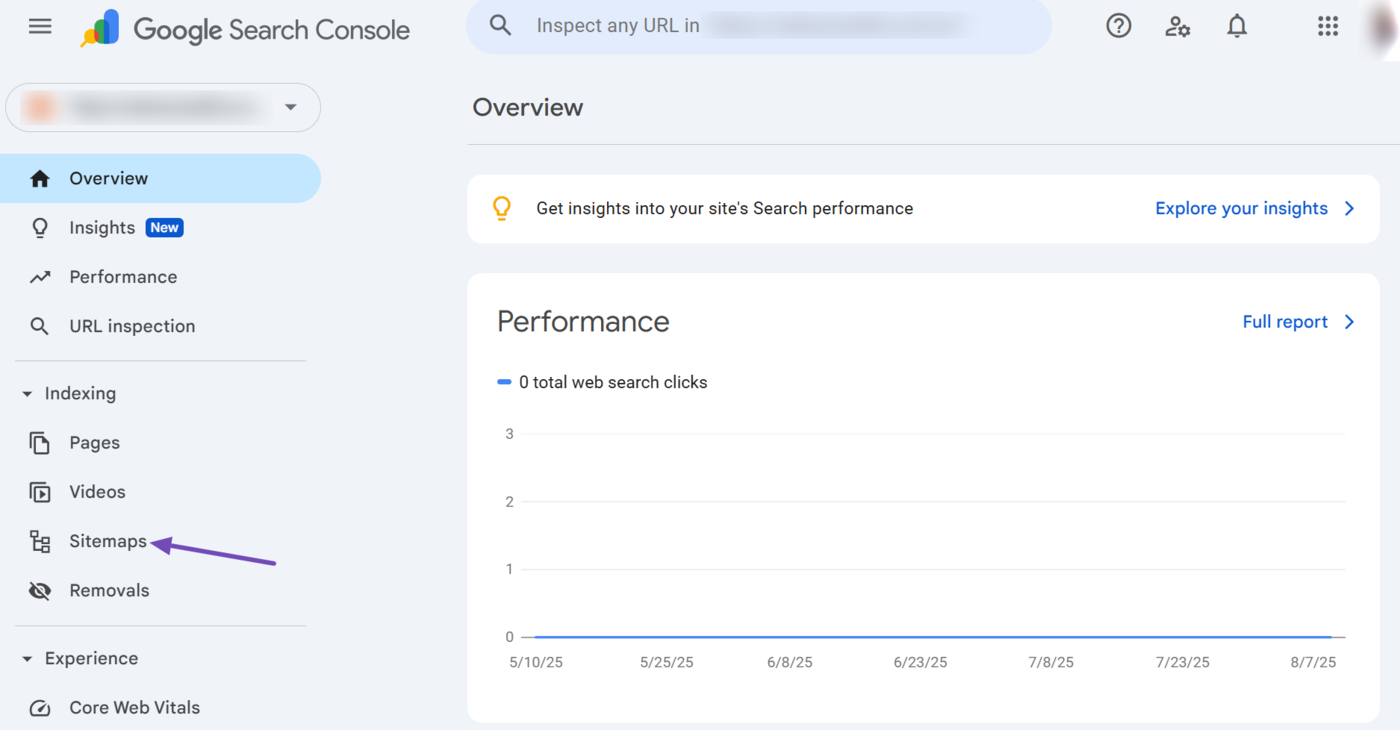
1 Upload a Sitemap to Google
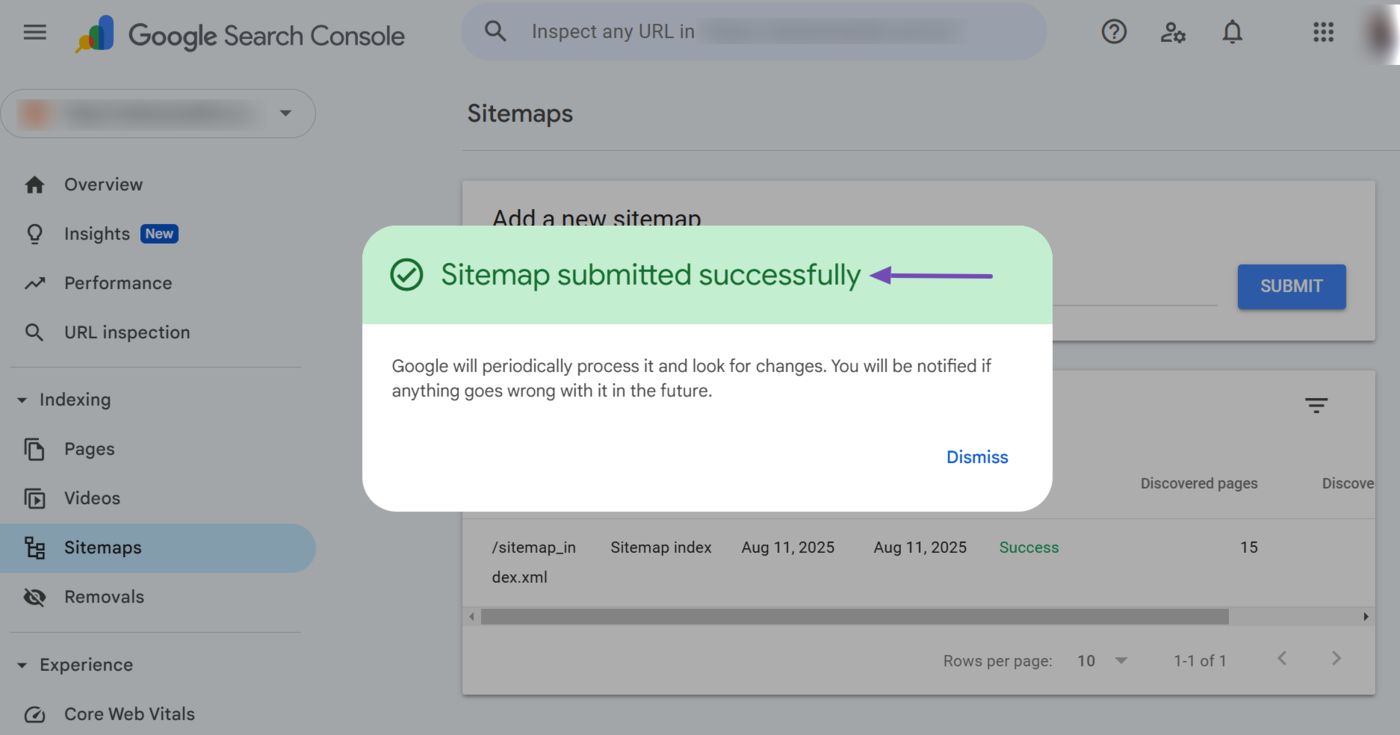
From your Google Search Console dashboard, head to Sitemaps.
Once done, paste your sitemap URL path into the available field and click Submit.
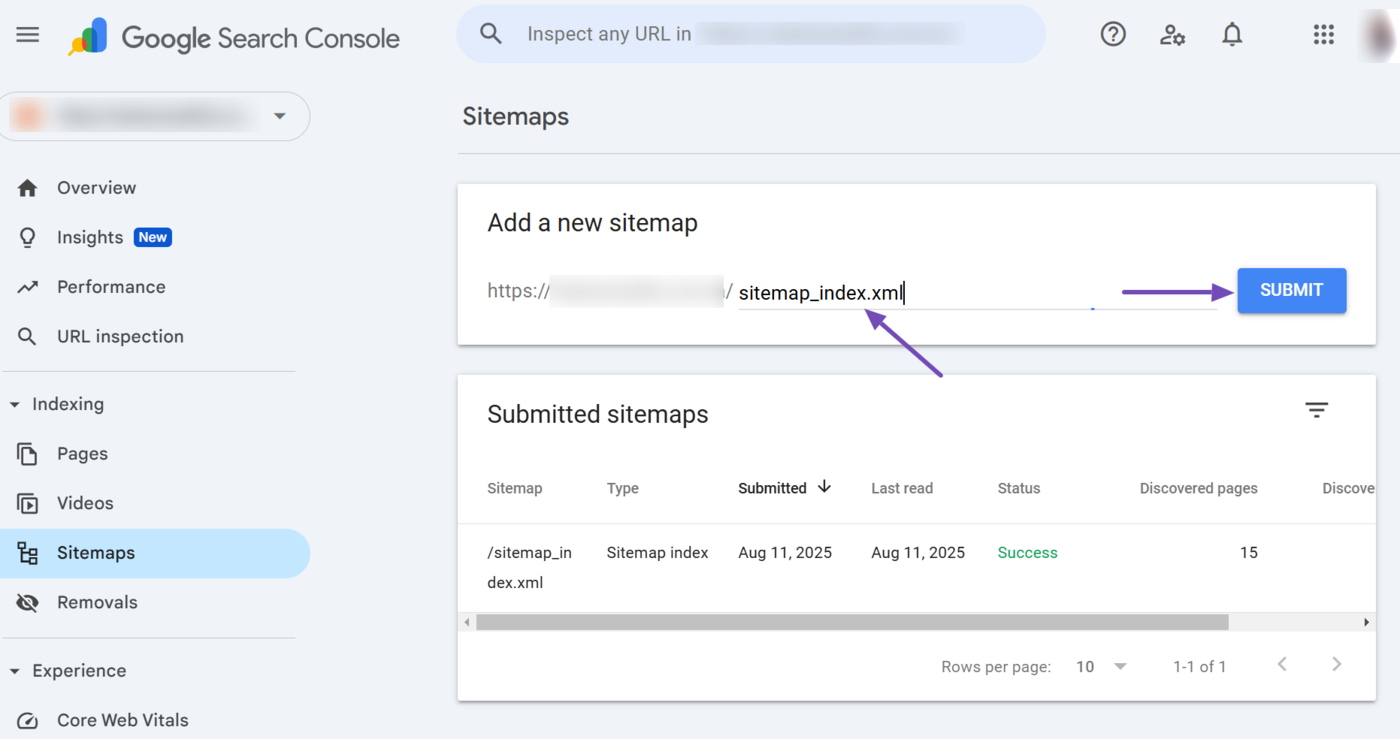
Google will show a success message indicating it received your sitemap.
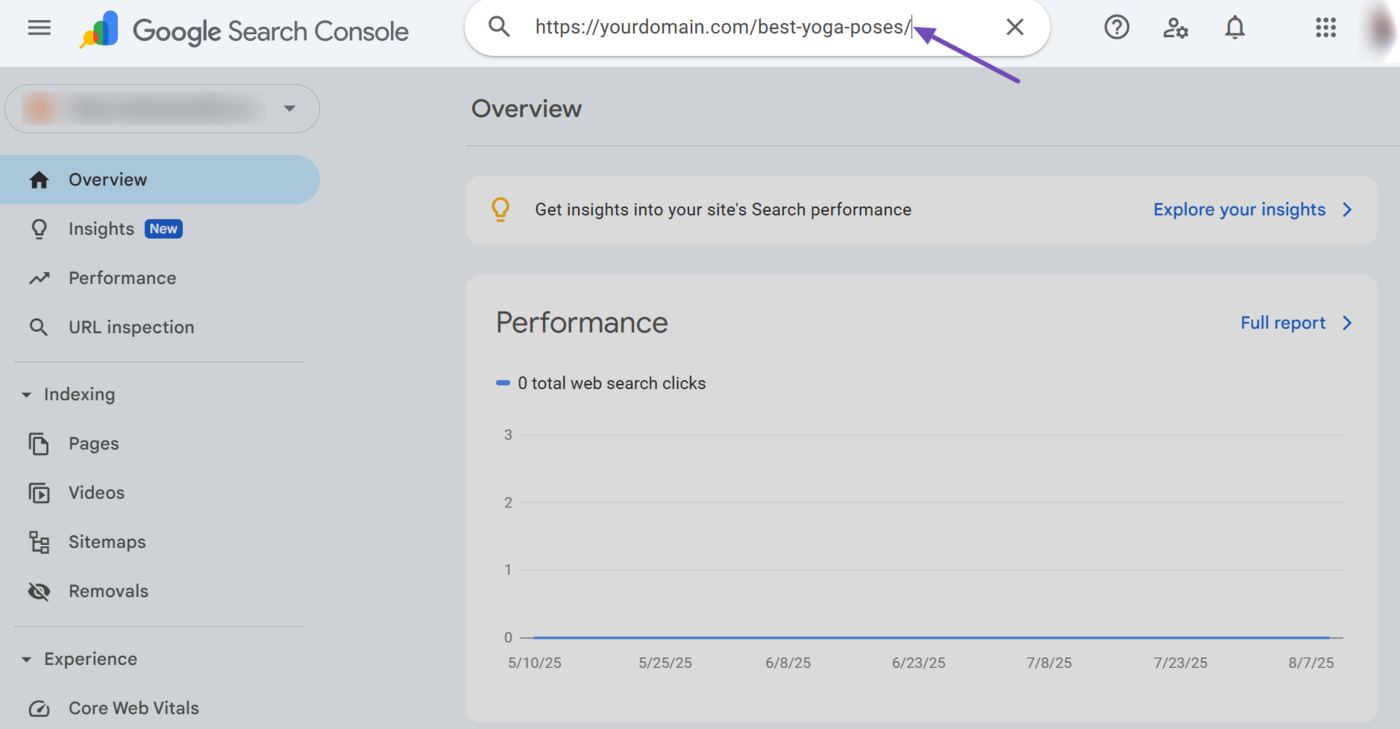
2 Request Google to Index Your Content
If you publish a new post or update an existing one, you will want Google to index it as soon as possible. To do that, click the URL inspection tool and enter the URL of the page you want to index.
Google will return with a page showing its index status. A new page may be unindexed, while an existing page should likely be indexed.
In either case, click Request indexing.
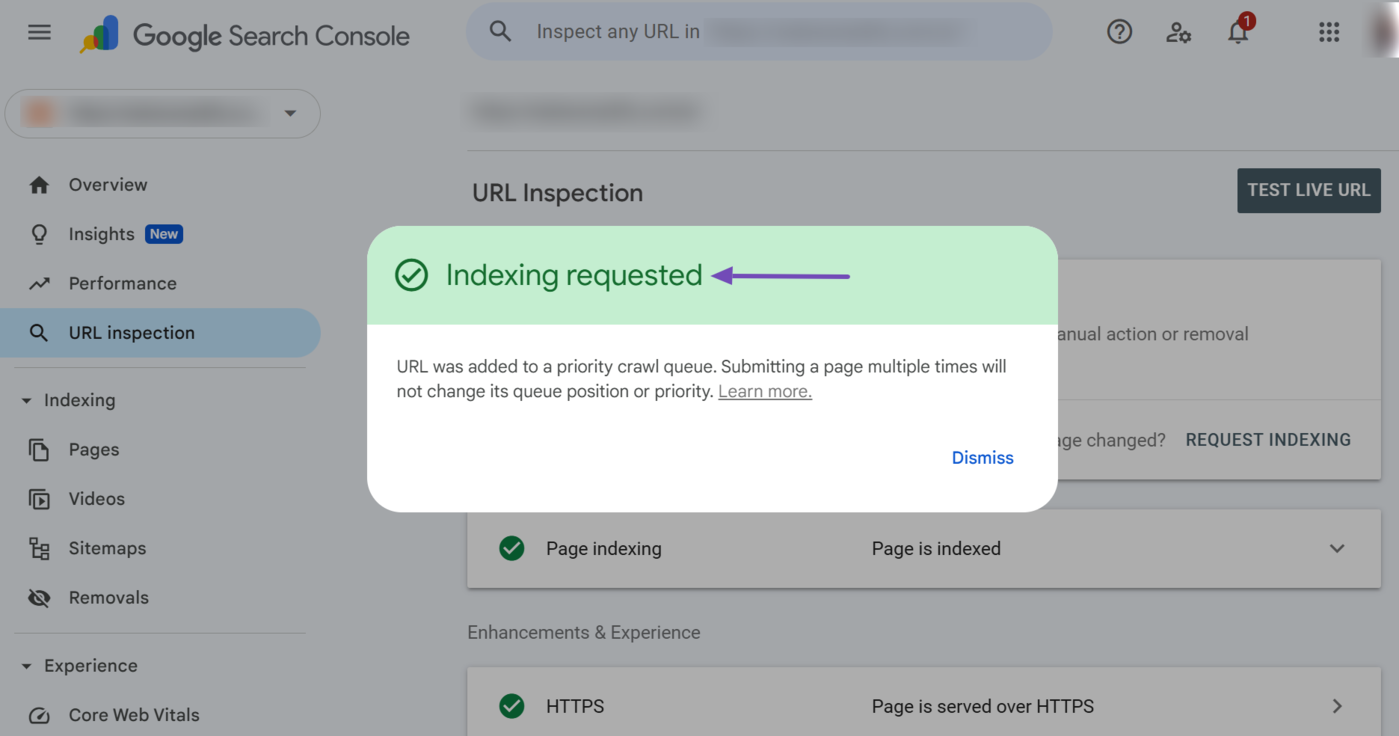
Google will check if the page can be indexed. If it is indexable, it will display a success message, as shown below.
3 Identify and Fix Indexing Issues
To identify the pages on your site, head to Pages from your Google Search Console dashboard.
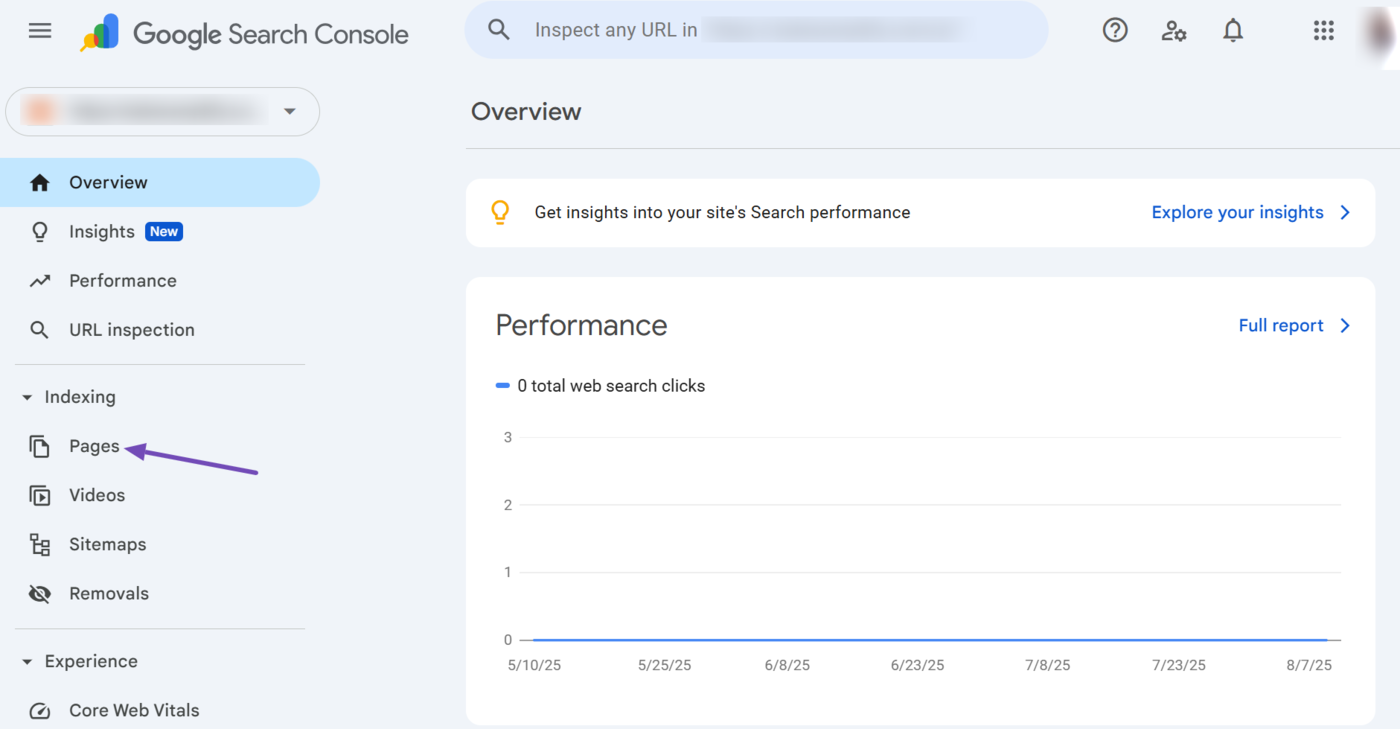
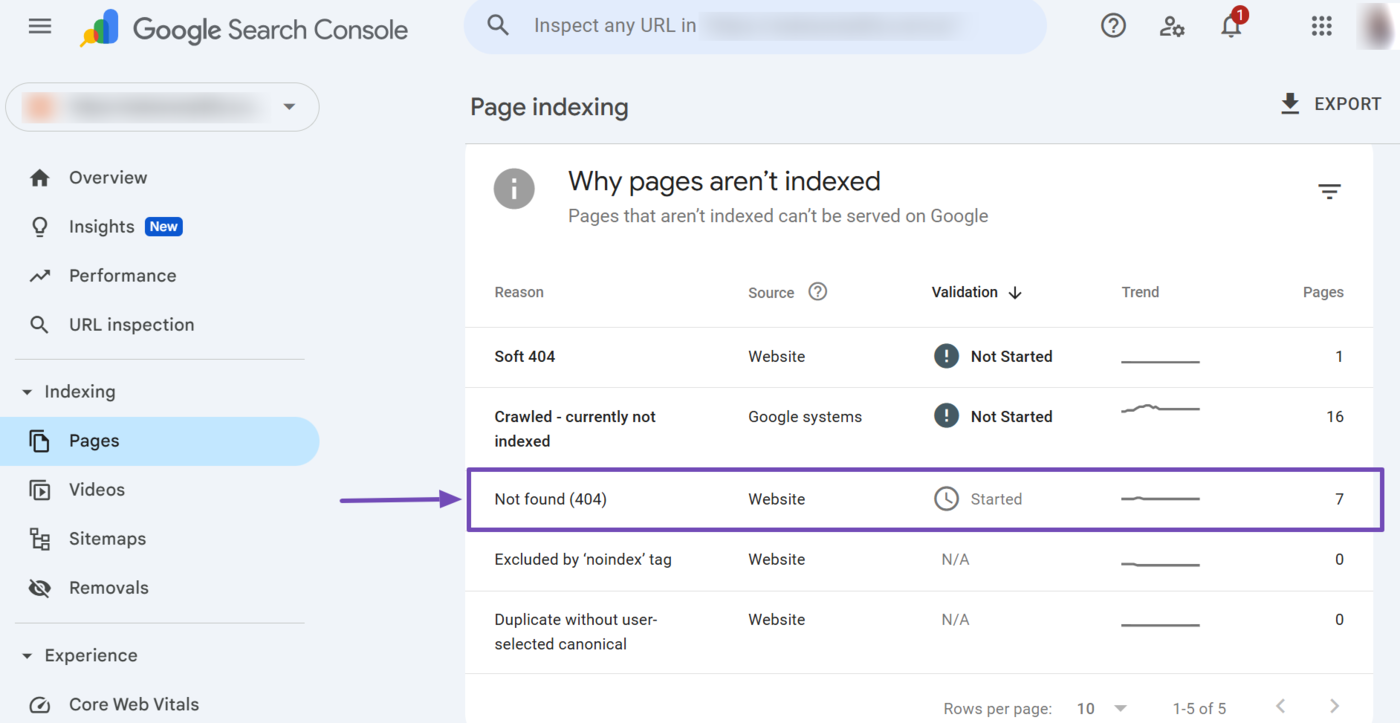
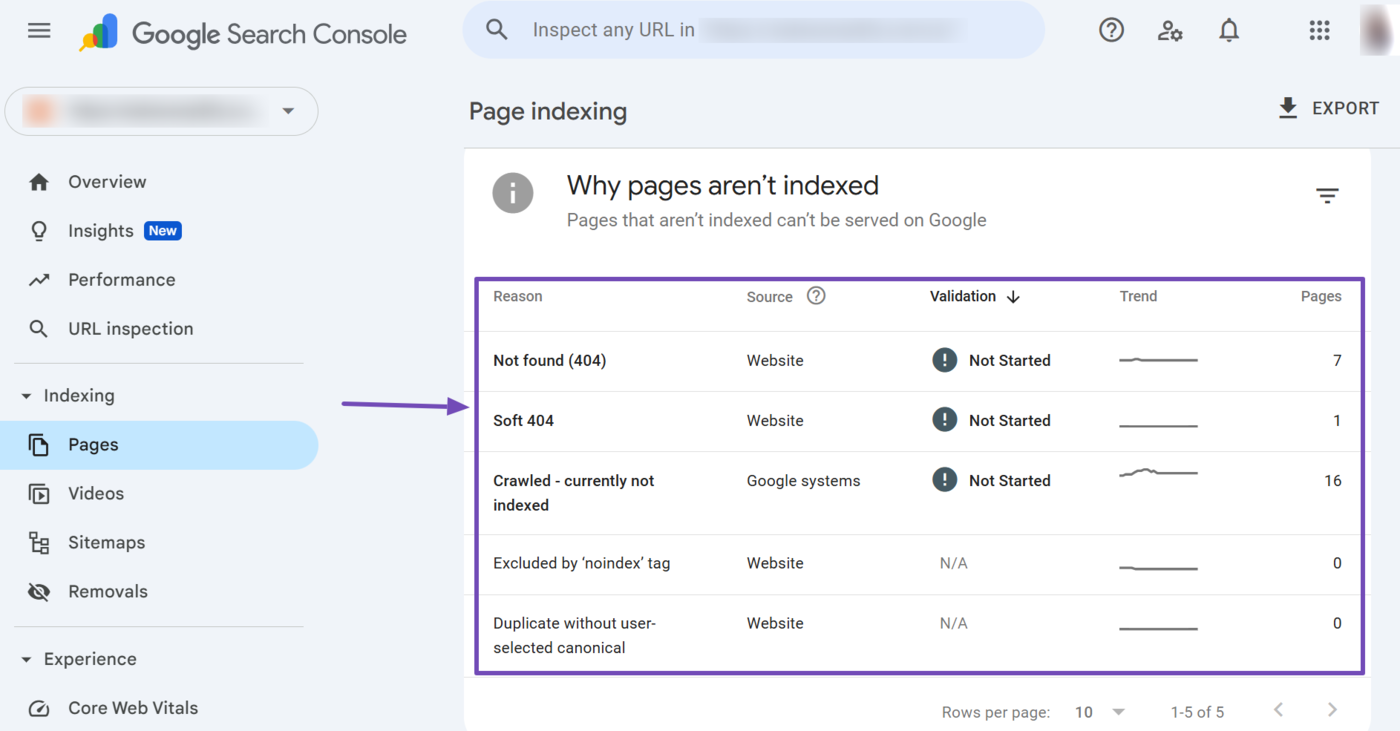
You will be presented with the indexed and unindexed pages on your site. Scroll down to the Why pages aren’t indexed field. Here, you will see a list of the unindexed pages on your site and why the pages are unindexed.
You should click on any reason for more insights into why the pages were unindexed. For this example, let us click on the Not found (404) issue.
Note: You can only fix issues if the source is listed as “Website.” Issues listed as “Google systems” come from Google and cannot be resolved by you.
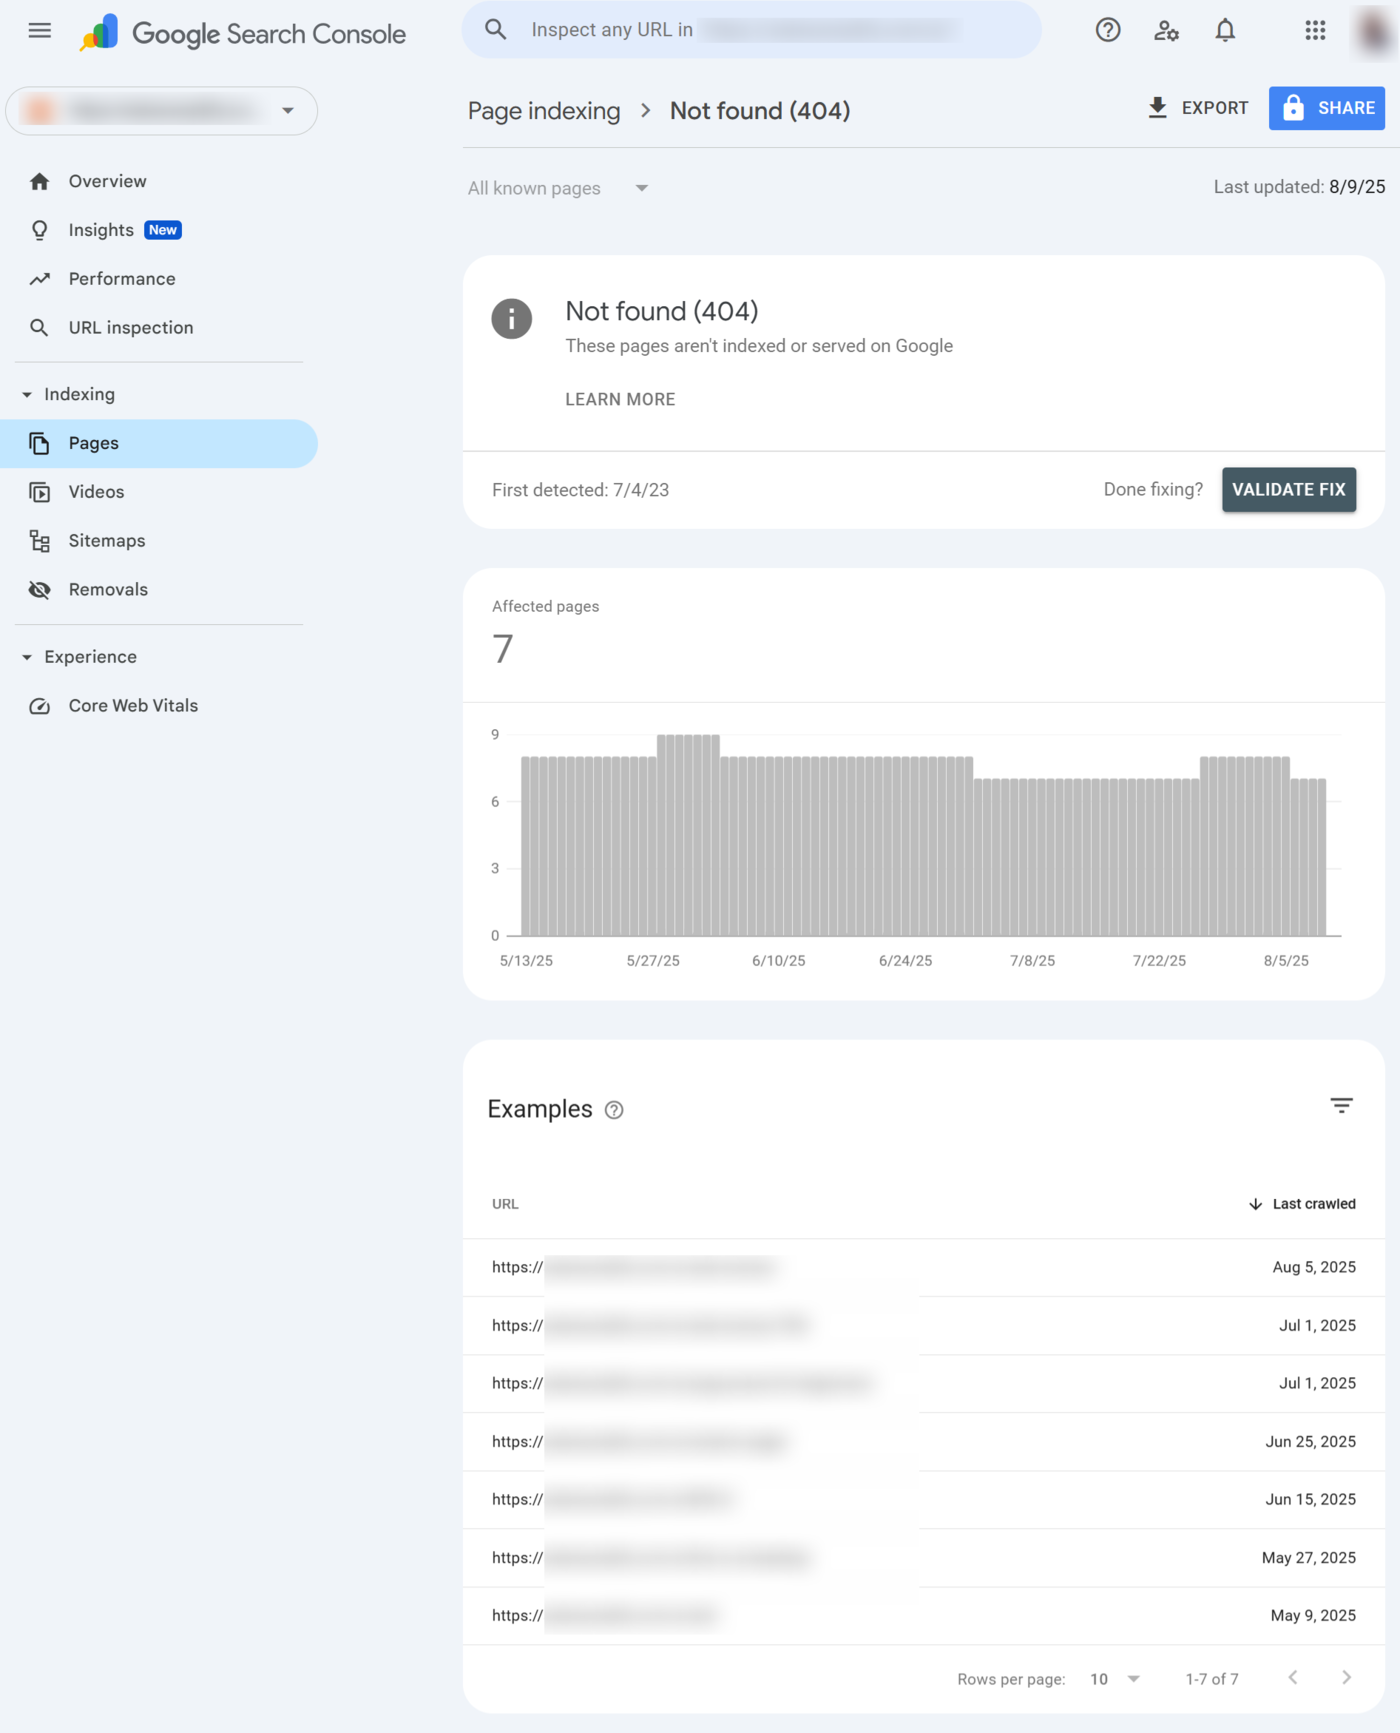
You will be presented with a list of the URLs affected by the issue. You can now proceed to fix them.
Once you have fixed all pages affected by an issue, click Validate Fix to inform Google that you have fixed the issue.
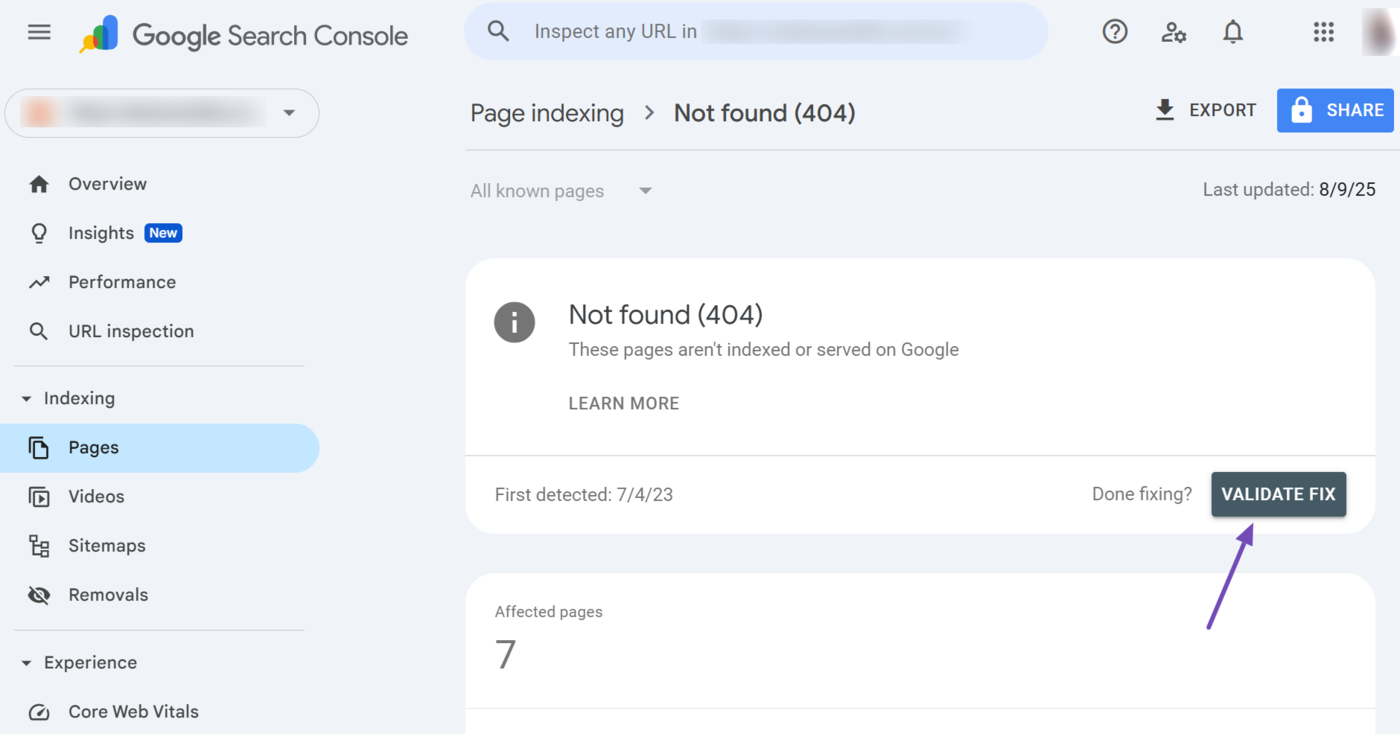
Thereafter, you can monitor the validation status from the Validation row. For example, this changed from “Not Started” to “Started” after we fixed the issue and validated the fix.