If your website loads slowly, you’re basically asking visitors to hit the back button. And trust me, they will.
I’ve been there before: compressing images, installing caching plugins, even blaming my hosting (guilty 😅)… only to realize the real problem was that I wasn’t measuring performance properly.
That’s where website speed test tools come in. They don’t just give you a random score; they show why your site is slow and what’s dragging it down. Some are packed with detailed reports (almost too geeky), while others keep it beginner-friendly but skip important insights.
And here’s the good news: if you’re running WordPress, there’s one plugin that lets you check performance right inside your dashboard without leaving admin. That’s a huge win for convenience.
So, I tested a bunch of tools, both free and premium. Below, I’ll share my honest take on the best website speed test tools in 2026, what makes each one useful, who it’s best for, and even where it falls short.
Let’s dive in.
Table Of Contents
- What Are Website Speed Test Tools?
- Top 10 Website Speed Test Tools to Optimize Your Site in 2026
- Rank Math SEO
- Google PageSpeed Insights (PSI)
- GTmetrix
- Pingdom Website Speed Test
- WebPageTest
- Google Chrome DevTools (Lighthouse)
- Cloudflare Observatory
- Geekflare Website Audit
- GiftOfSpeed
- Yellow Lab Tools
- Frequently Asked Questions
- Conclusion
1 What Are Website Speed Test Tools?
Think of a website speed test tool like a health checkup for your site. Instead of just telling you “it feels slow,” these tools break down why it’s slow and what you can fix.
They measure metrics such as page load time, server response time (TTFB), and Core Web Vitals, including LCP, FID, CLS, and the newer INP. In other words, these indicators show when a website becomes fully interactive for users, rather than just when it visually appears to have loaded.
Most of them rely on two main types of data: lab tests, which are synthetic checks run in a controlled environment (like Lighthouse audits), and field data or Real User Monitoring (RUM), which comes from actual visitors experiencing your site in real-time.
Why does this matter? Because speed isn’t just a technical detail. It directly impacts key areas such as:
- User experience — nobody likes waiting for a page to load.
- SEO rankings — Core Web Vitals are part of Google’s ranking factors.
- Conversions — a faster site keeps people around and makes them more likely to take action.
A good speed test tool doesn’t just give you a score; it helps you spot issues like heavy images, JavaScript issues, or sluggish servers and offers actionable recommendations to fix them.
2 Top 10 Website Speed Test Tools to Optimize Your Site in 2026
There are numerous website speed test tools available, but these are the ones I’ve actually tested and found to be useful. Some are simple and beginner-friendly, while others give advanced reports that developers value. Let me walk you through the best options.
2.1 Rank Math SEO
I’m starting with Rank Math SEO because, honestly, if you’re on WordPress, this one feels like a cheat code.
In addition to being the #1 SEO plugin, Rank Math also works as a WordPress page speed test tool directly within your dashboard. You don’t need extra tabs or to copy and paste your URL into another site.
Once you have installed it and enabled the Analytics module, you can turn on the frontend stats bar. That little bar sits at the top of your page and instantly shows load times for both desktop and mobile.
Just click the Rank Math logo, and you get a clear speed score with traffic-light indicators and the option to refresh whenever you want.
I personally use it while reviewing content. If I want to check how optimized a post is, I go to Rank Math SEO → Analytics → Site Analytics, select the post, and test its speed there. It’s fast, simple, and just fits my workflow.
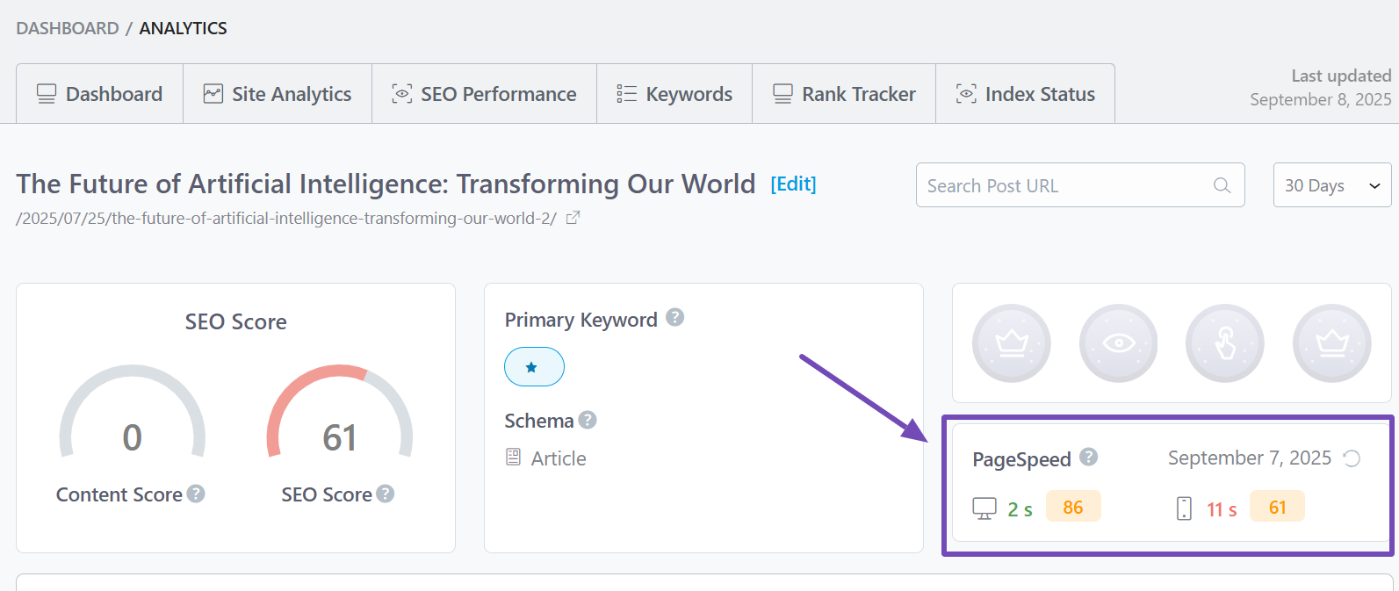
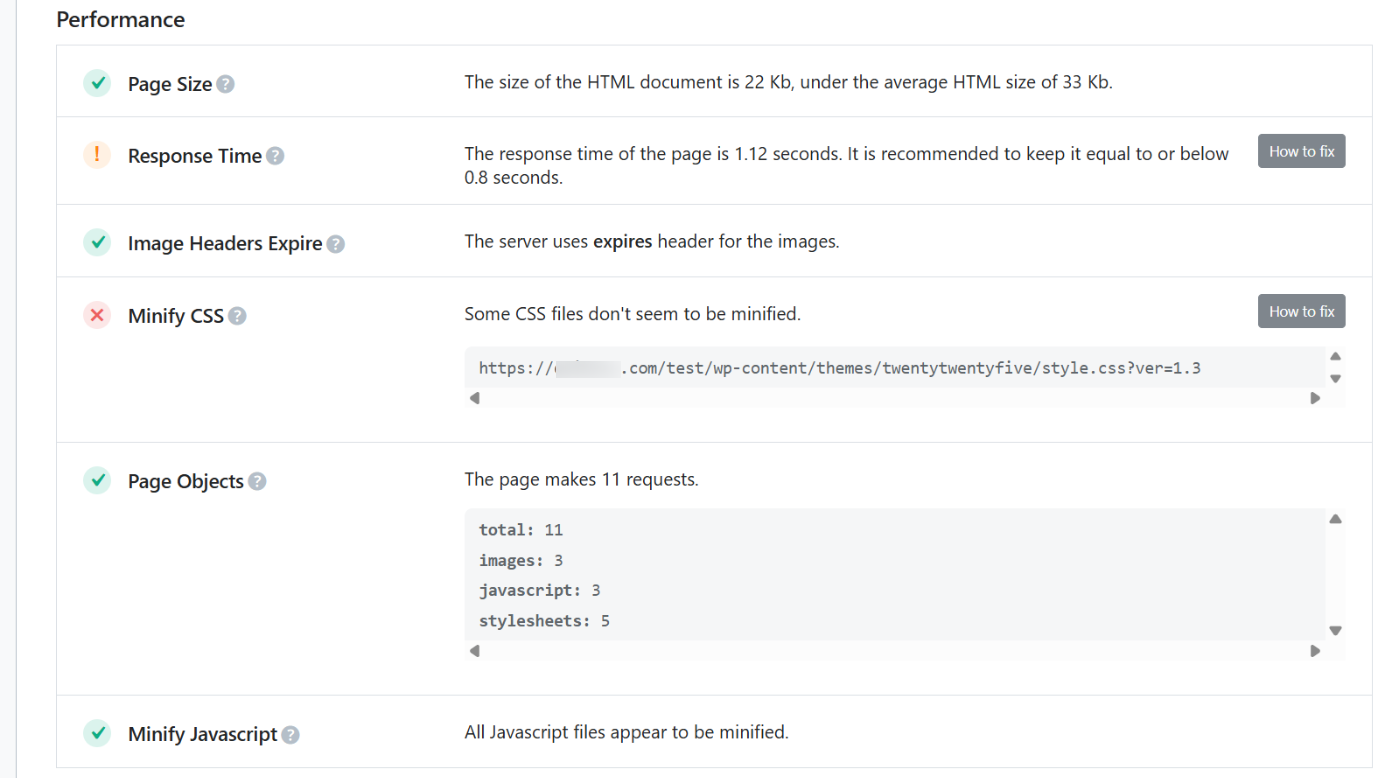
Rank Math also comes with an SEO Analyzer that scans your site for technical SEO issues and gives suggestions.
You receive performance metrics, such as page size, server response time, and speed score, along with issues and tips on how to fix them.
Now, to be fair, Rank Math won’t replace advanced testing platforms. If you’re looking for detailed waterfall charts, precise TTFB measurements, or a breakdown of Core Web Vitals, such as LCP and CLS, you’ll want to pair it with some of the other tools I’ll cover below.
But if you’re a blogger, site owner, or content creator who just needs a quick website speed test inside WordPress (without breaking your flow), Rank Math SEO does the job beautifully.
Pricing: Free, but the frontend page speed feature is part of the PRO plan, starting at $95.88 for the first year, which can be renewed at $107.88 later.
2.2 Google PageSpeed Insights (PSI)
When I built my first website, the first tool I ran was Google PageSpeed Insights. It’s the most recognized free tool for checking how fast a site actually feels on both mobile and desktop.
PSI combines two types of data:
Field data (real user data) from the Chrome User Experience Report (CrUX), which reports on actual user experiences over the past 28 days, covering metrics like FCP, LCP, INP, CLS, and an experimental TTFB.
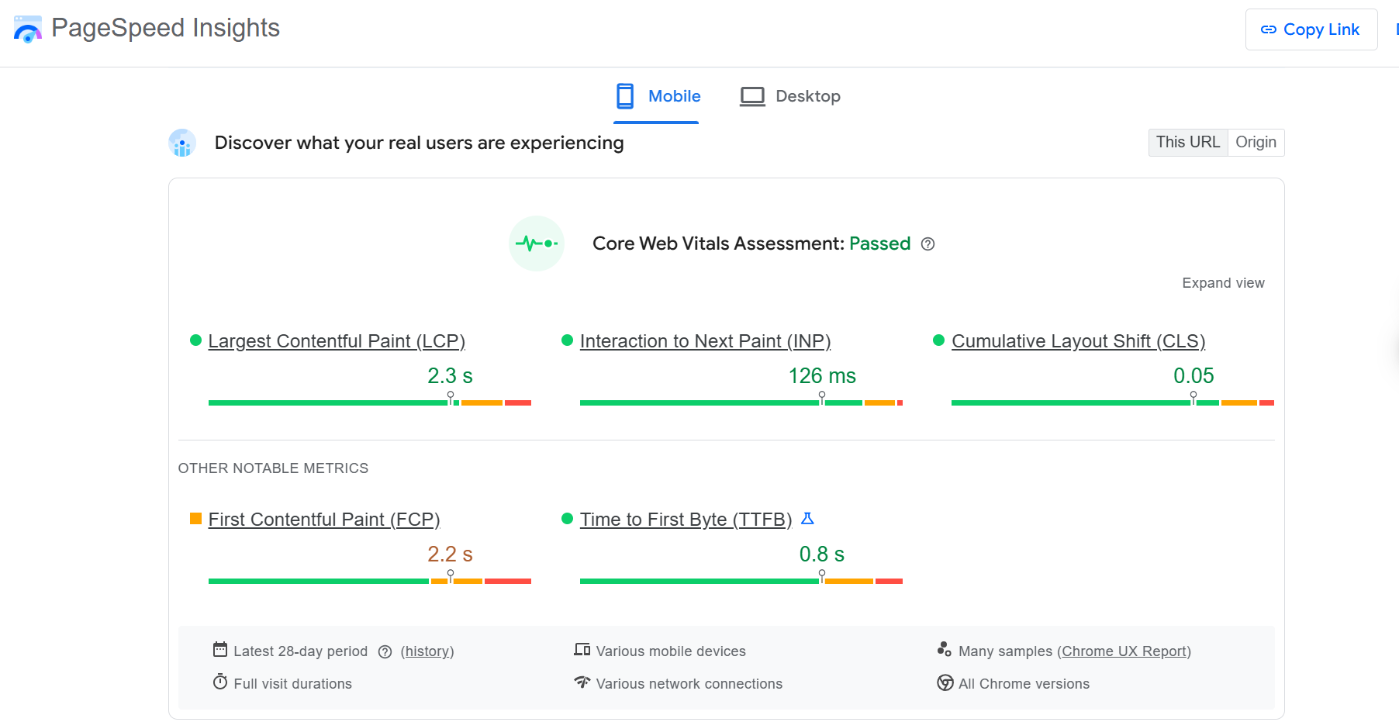
And Lab data, powered by Lighthouse, runs in a controlled environment to flag issues and provide a performance score. You also receive actionable tips, such as image optimization, CSS/JS minification, and reducing redirects.
What I love most is how simple it is. Just plug in a URL and instantly see separate scores for mobile and desktop. You also get a breakdown of Opportunities (fix these now) and Diagnostics (factors that might be slowing you down).
PSI also highlights issues that impact SEO rankings and overall user experience (UX).
There are some limits, though. New or low-traffic sites might not have field data yet. Sometimes it only shows origin-level numbers instead of page-specific scores. And remember, PSI is a snapshot, not a continuous monitoring tool.
Even with that, for website owners, developers, and SEOs who want a free, reliable way to audit site speed and check Core Web Vitals, Google PageSpeed Insights is essential.
Pricing: Completely free via the web interface.
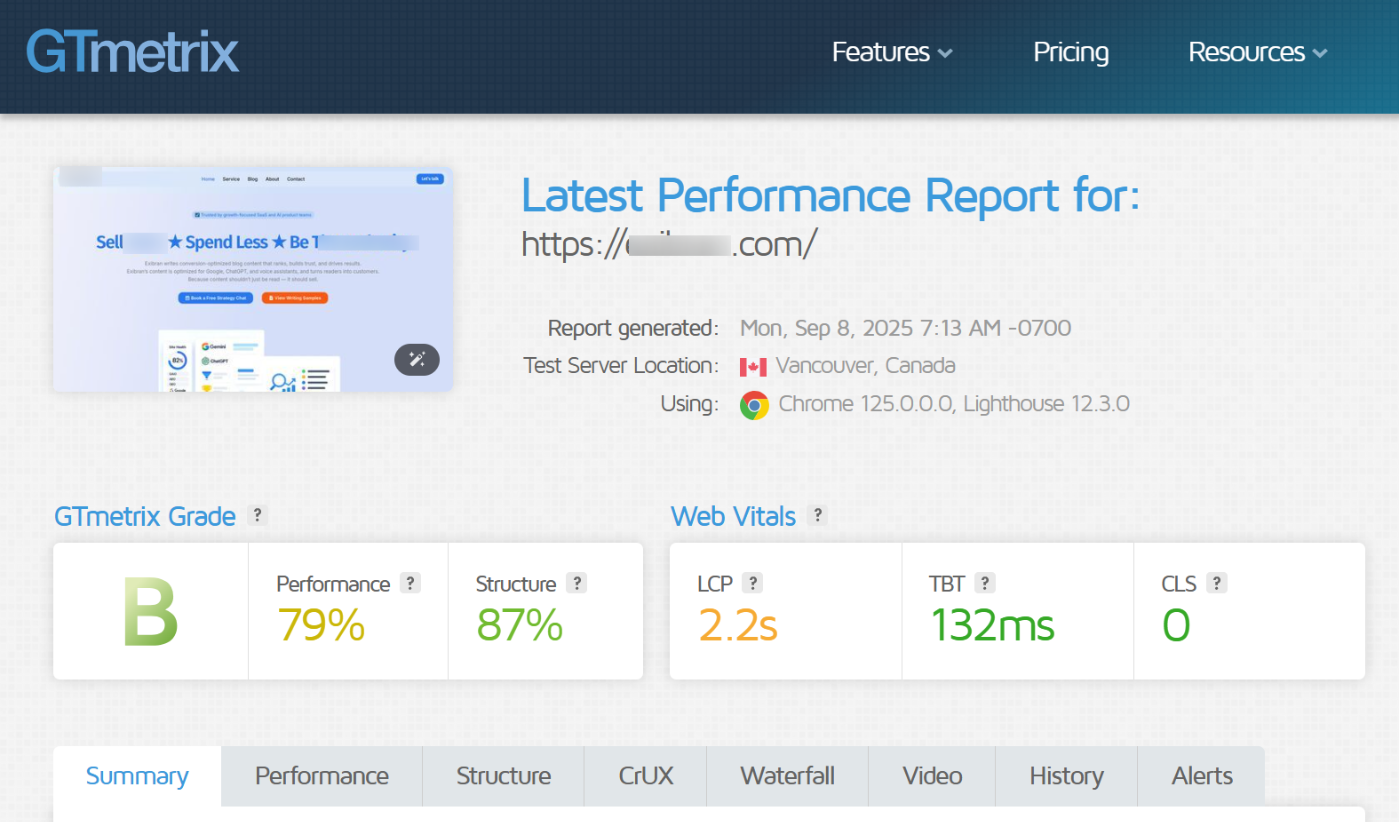
2.3 GTmetrix
GTmetrix is the tool I turn to when I want a deeper look at my site speed, or just an alternative to PageSpeed Insights. And honestly, it makes you feel like a pro debugger, given the level of detail it provides.
You type in your site’s URL, hit “Test,” and GTmetrix scans everything. The results are neatly organized into tabs like Summary, Performance, Structure, CrUX data (real-user metrics), Waterfall, Video, History, and Alerts. Each one digs into different aspects of your site speed.
Now, here’s the catch: you won’t see your full Core Web Vitals (like LCP, TBT, or CLS) unless you’re logged in.
Once you log in, you unlock detailed metrics, page speed visualizations, and my favorite, the waterfall chart, which shows every resource your page loads, step by step.
GTmetrix also goes beyond one-off tests. You can schedule tests daily, weekly, or monthly, set up alerts, test from different locations and devices, and even simulate slower connections to see how your site performs for all users.
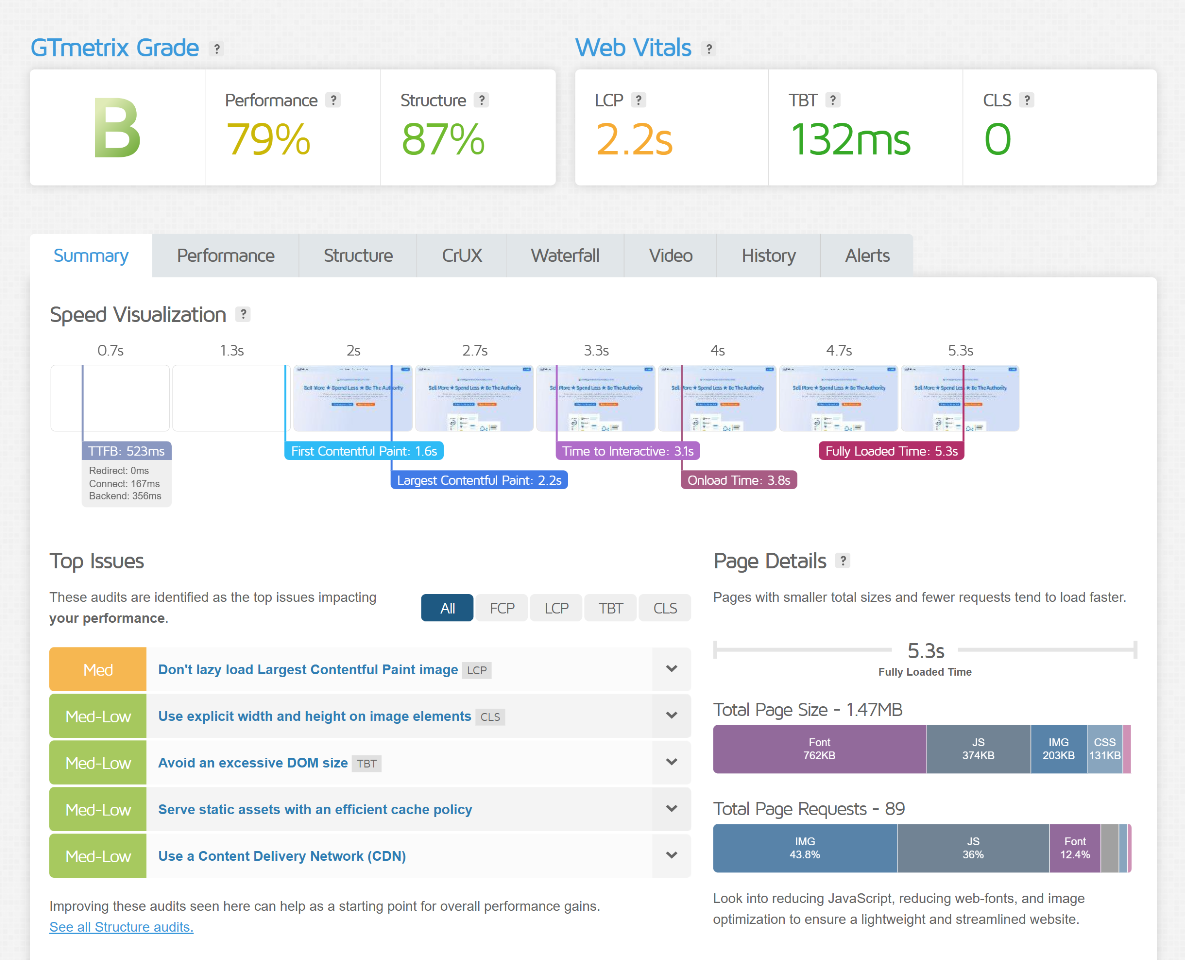
It combines lab data from Lighthouse audits with field data from CrUX, giving a balanced view of both synthetic and real-world performance.
What I love most is how it pairs diagnostics with visuals. Performance reports, page load videos, and historical trend tracking make it easy to identify bottlenecks and continually improve over time.
Pricing: Free with limited features. Paid plans start at $4.25/month (billed annually).
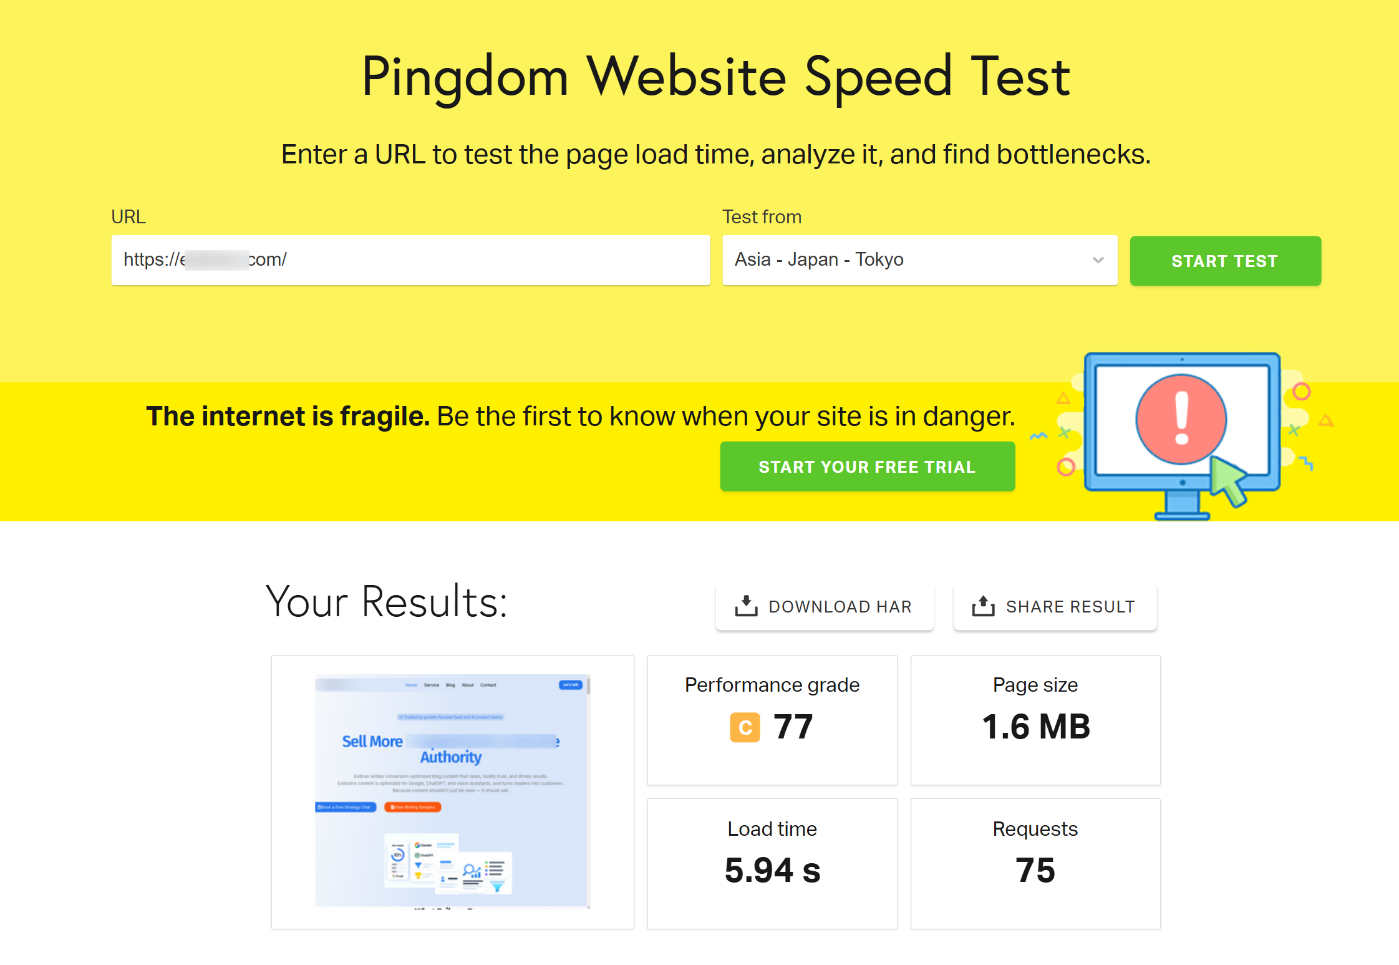
2.4 Pingdom Website Speed Test
Pingdom is a great option when you need quick, straightforward results. It clearly highlights the areas where your site is slowing down without unnecessary complexity.
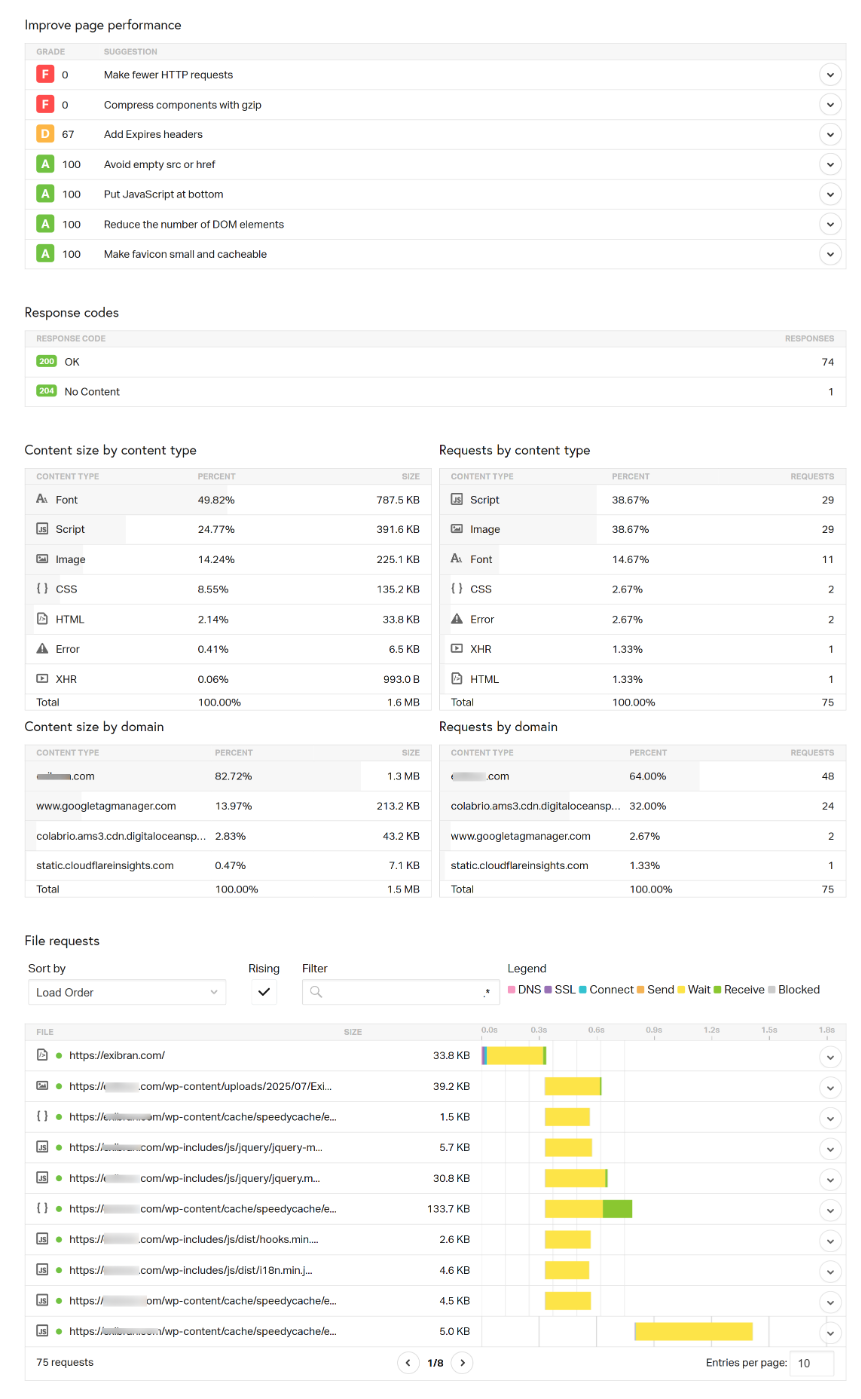
With the free version, just enter your site’s URL, pick a global test location, and within seconds, you get a performance grade, page size, load time, and number of requests.
The results also include a waterfall chart, content-size breakdown, response codes, and actionable tips, such as enabling GZIP compression, reducing HTTP requests, or setting cache headers.
Upgrading to a paid plan unlocks additional features, including synthetic monitoring, uptime alerts, transaction tracking, and real-user monitoring (RUM) through SolarWinds integration.
That means you get ongoing insights, not just one-off reports.
What I love about Pingdom is how smooth and beginner-friendly it is. The reports are super easy to understand at a glance, so even if you’re not technical, you’ll quickly see whether your site is bloated or just needs a bit of optimization.
That said, the free version has some limits. You only have access to a handful of test locations, and more advanced features like monitoring are behind a paywall.
Pricing: Free for one-off tests. Paid plans start at $15/month (or $120/year).
2.5 WebPageTest
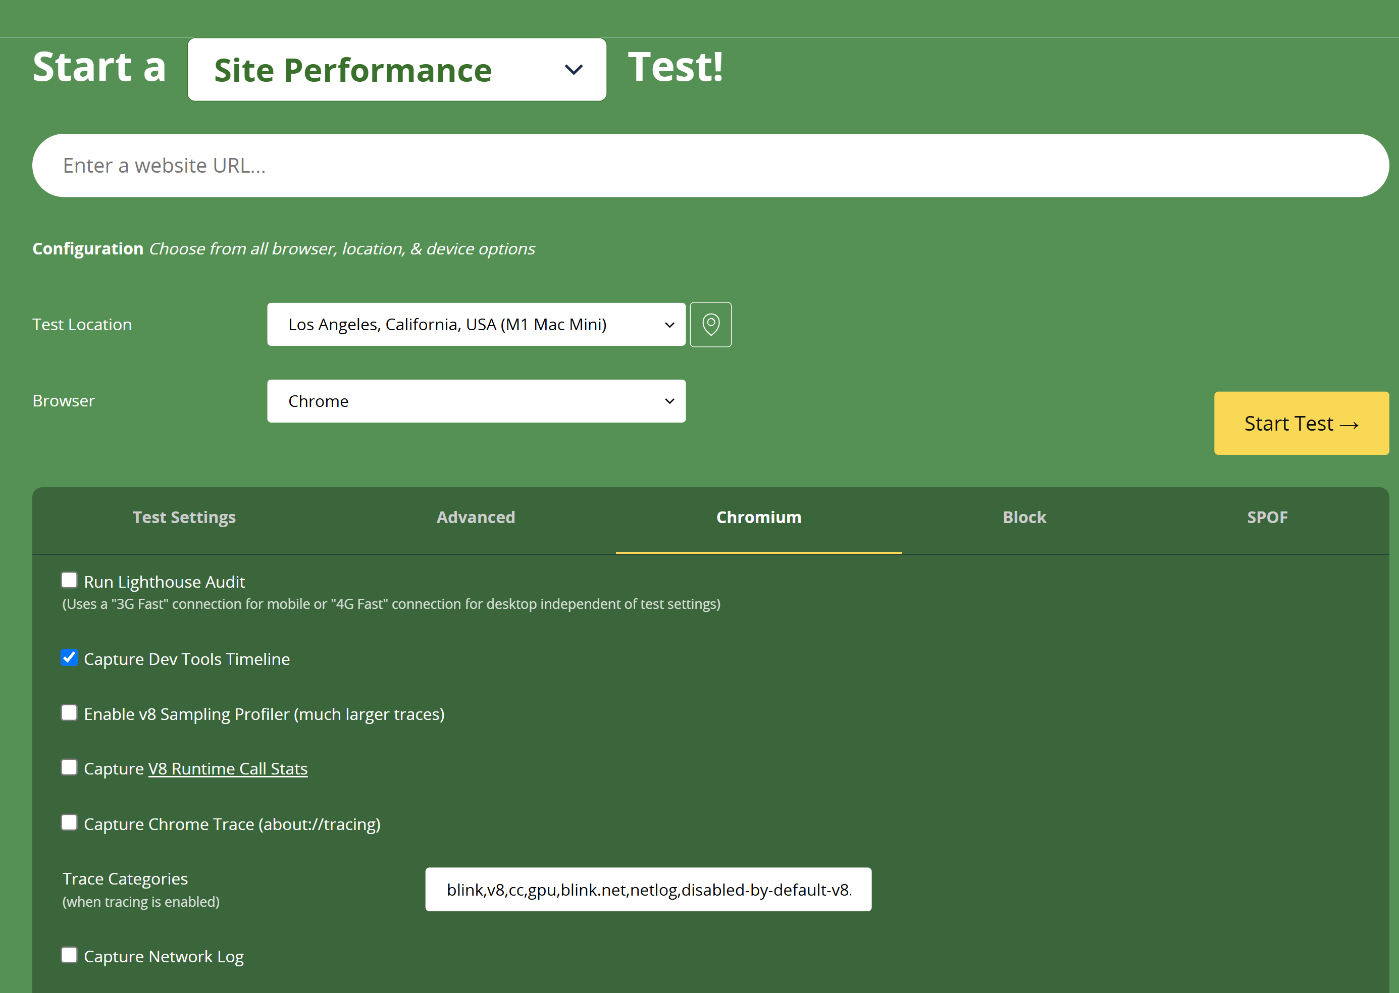
WebPageTest is one of the most powerful website performance testing tools available, and it’s completely free and open-source. All you need to do is enter your site’s URL, choose a test location and browser, and hit start.
What sets WebPageTest apart is its advanced customization capabilities. You can tweak network speeds (simulate 4G or even old-school 56K dial-up), device screen sizes, scripted test flows, or block certain domains to see how they impact load time.
After the test, you get detailed visuals: waterfall charts, a filmstrip view showing how your site loads frame by frame, and metrics like Speed Index, FCP, TTFB, and more. You can also save your test history for over a year, even on the free plan.
I admire how customizable it is. Whether you want to test a mobile visitor in Tokyo on a slow 3G connection or a desktop visitor in New York on a fiber connection, WebPageTest makes it possible.
The downside? The tool can be overwhelming for beginners due to its numerous settings, and free users often end up waiting in a queue before receiving results.
Pricing: Free to use (open source). Premium plans with faster processing and priority features start at $180/year.
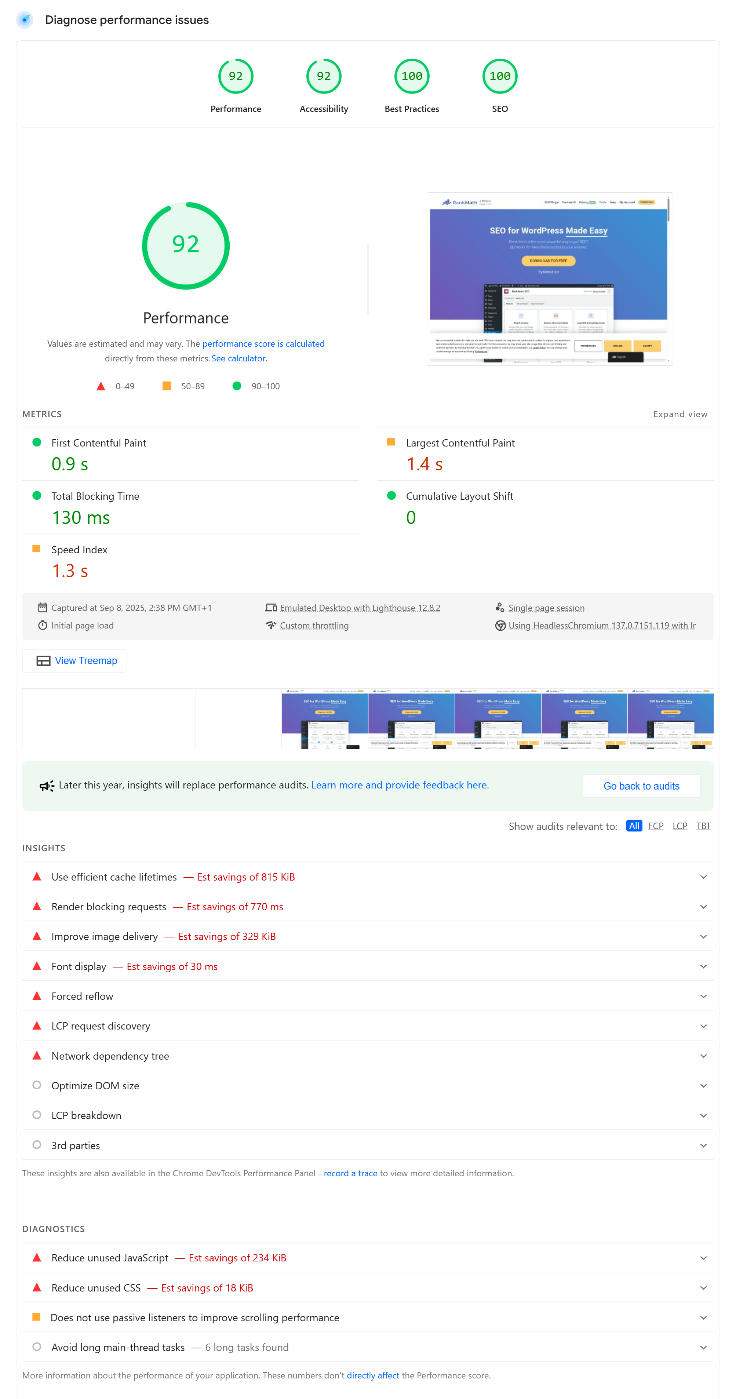
2.6 Google Chrome DevTools (Lighthouse)
Google Chrome DevTools (with Lighthouse audits) is like having a developer toolkit right inside your browser. Even if you’re not super technical, it makes you feel like one. 😂
You can open it anytime by right-clicking on a page, hitting Inspect, and heading to the Lighthouse tab. From there, you choose the device type (mobile or desktop), the categories you want to test (Performance, Accessibility, Best Practices, SEO), and click Analyze page load.
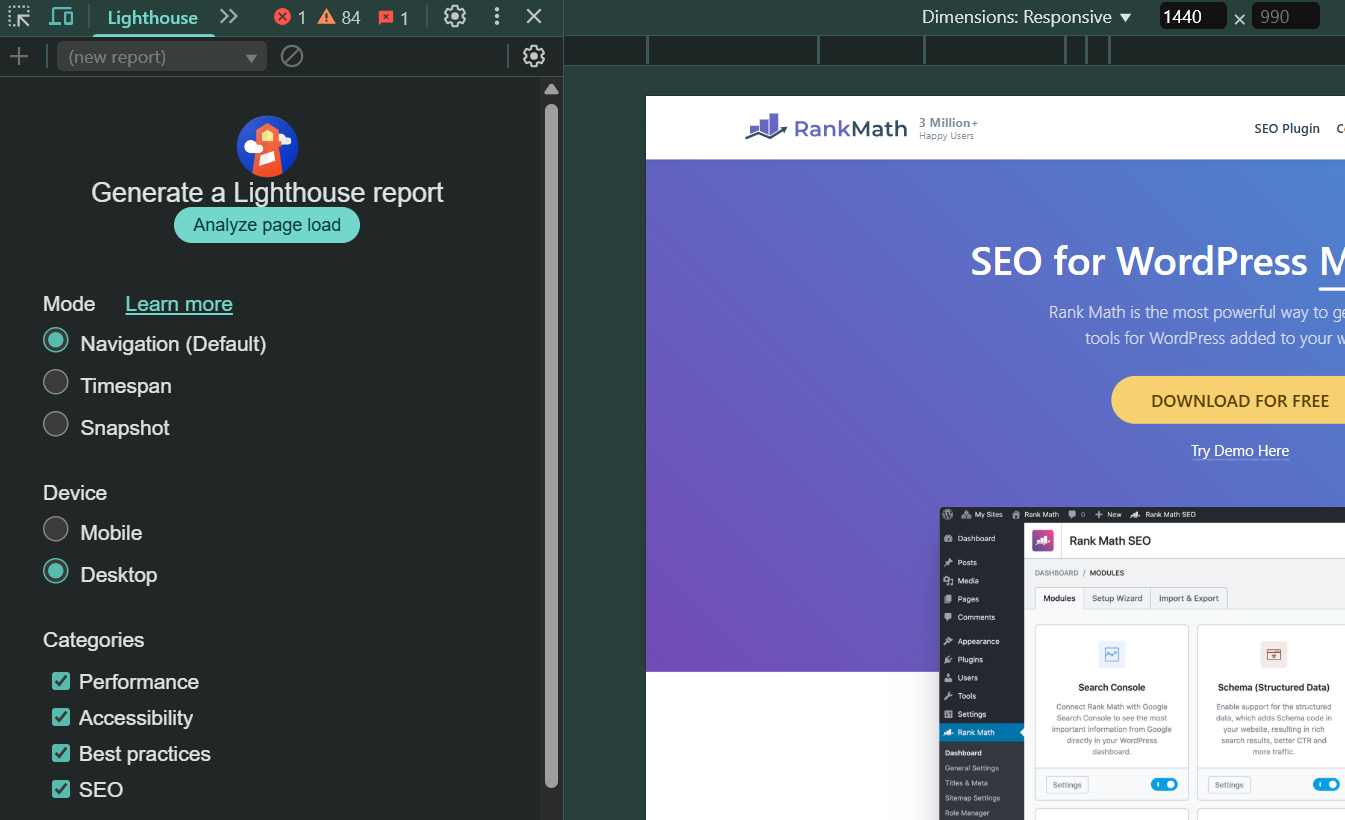
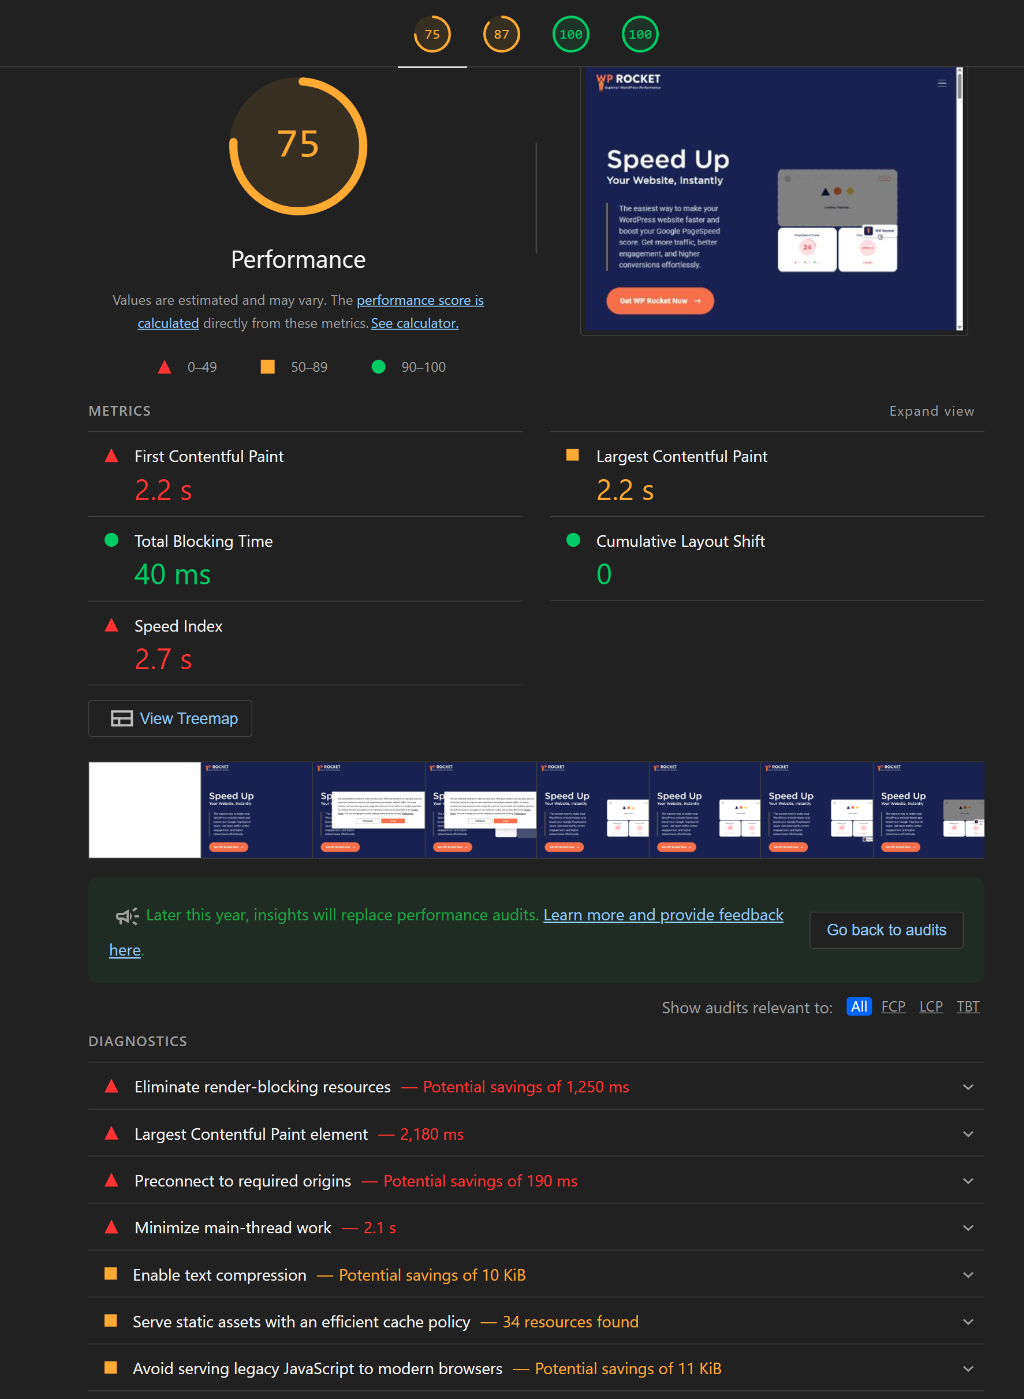
In seconds, Lighthouse provides a 0–100 performance score, along with detailed metrics: FCP, LCP, TBT, and CLS, essentially covering the full Core Web Vitals package. You also get extra visuals like the treemap view and clear diagnostics with “how to fix” tips.
What I like most is how accessible it is. You don’t need to open another website or tool because it’s right there in Chrome, ready whenever you want to run a quick page speed test on any page.
That said, there are a couple of drawbacks: it’s limited to the Chrome ecosystem, results can be skewed by active Chrome extensions, and unlike some of the online tools, there’s no continuous monitoring or alert system.
Pricing: 100% free, already built into Google Chrome.
2.7 Cloudflare Observatory
Cloudflare’s Observatory may still be in beta, but honestly, it feels like a hidden gem. It combines synthetic tests powered by Lighthouse with real-user monitoring (RUM) from your actual visitors, providing both lab-style precision and real-world performance insights.
Inside the Cloudflare dashboard, you’ll find it under Speed → Observatory. Simply enter your website, select the region and frequency, and choose whether to test on mobile or desktop.
Once the test runs, you’ll see performance scores (1–100), along with Core Web Vitals metrics like TTFB, FCP, LCP, CLS, and INP. Results are displayed in a traffic light style, making it easy to identify issues.
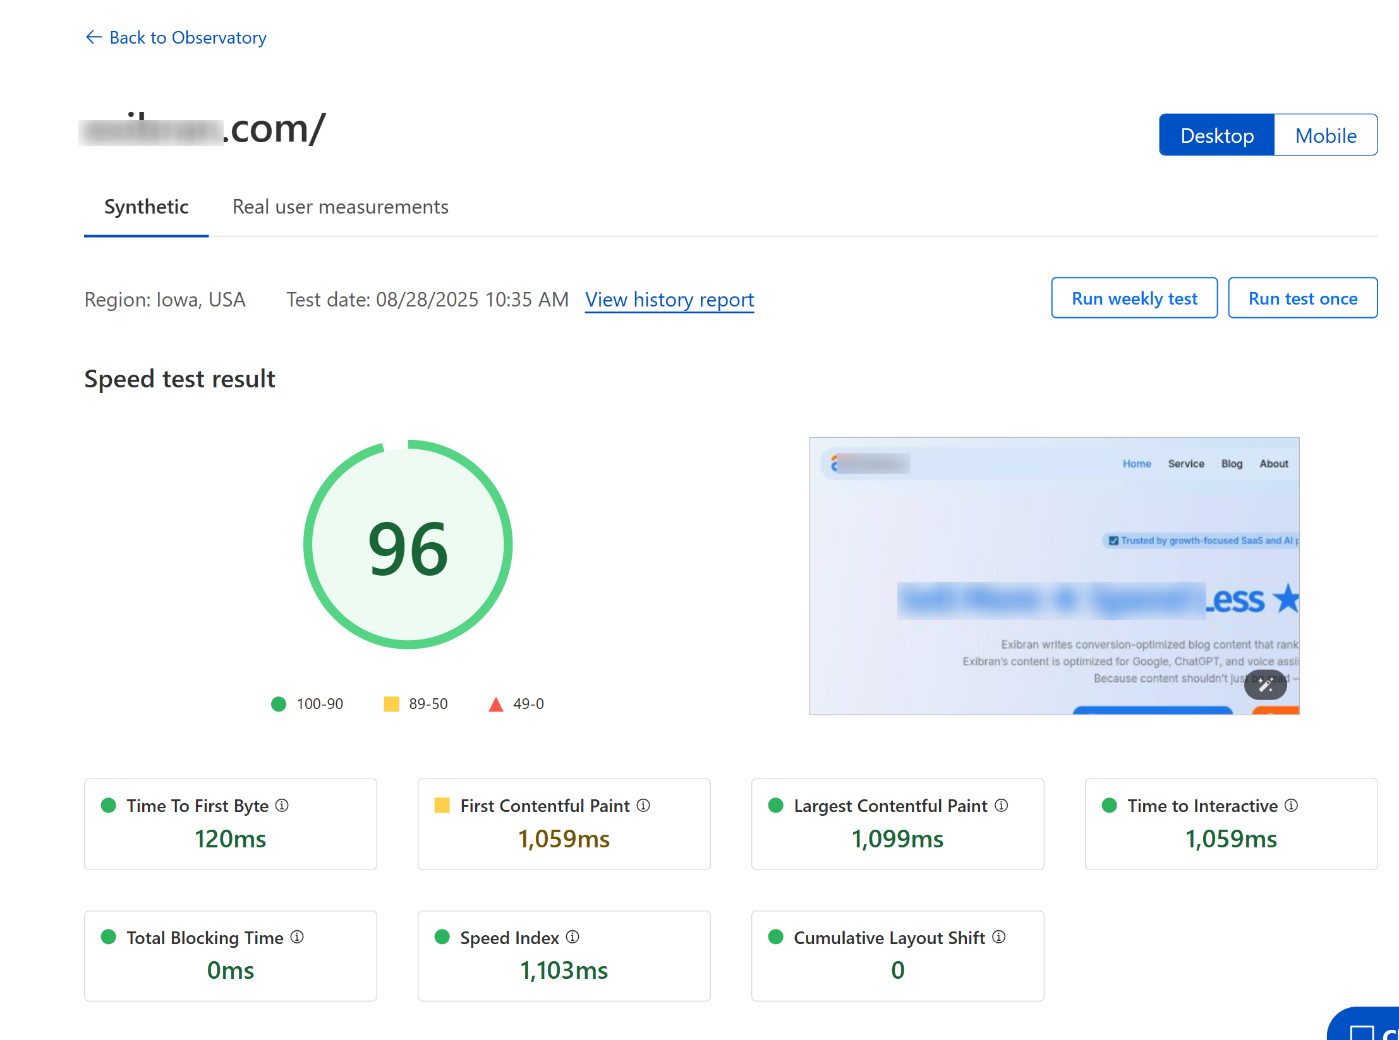
What I find most helpful is that it doesn’t just highlight problems. It also recommends Cloudflare features, such as caching and image optimization, that you can enable immediately to boost page speed.
You can schedule recurring tests, compare past results, and track improvements over time.
The downside is it’s tied to the Cloudflare ecosystem. Free-tier users get only one test region (Iowa, USA) and weekly scheduled tests.
More advanced features, such as multiple test regions and more frequent scheduling, are reserved for Pro users.
Pricing: Free with basic usage (about 30 tests/month). Pro plans start at $20/month, billed annually.
2.8 Geekflare Website Audit
Geekflare Website Audit feels simple but delivers more than you’d expect. It’s a free, no-login tool that runs a full Lighthouse-style audit in your browser, covering performance, SEO, accessibility, and security.
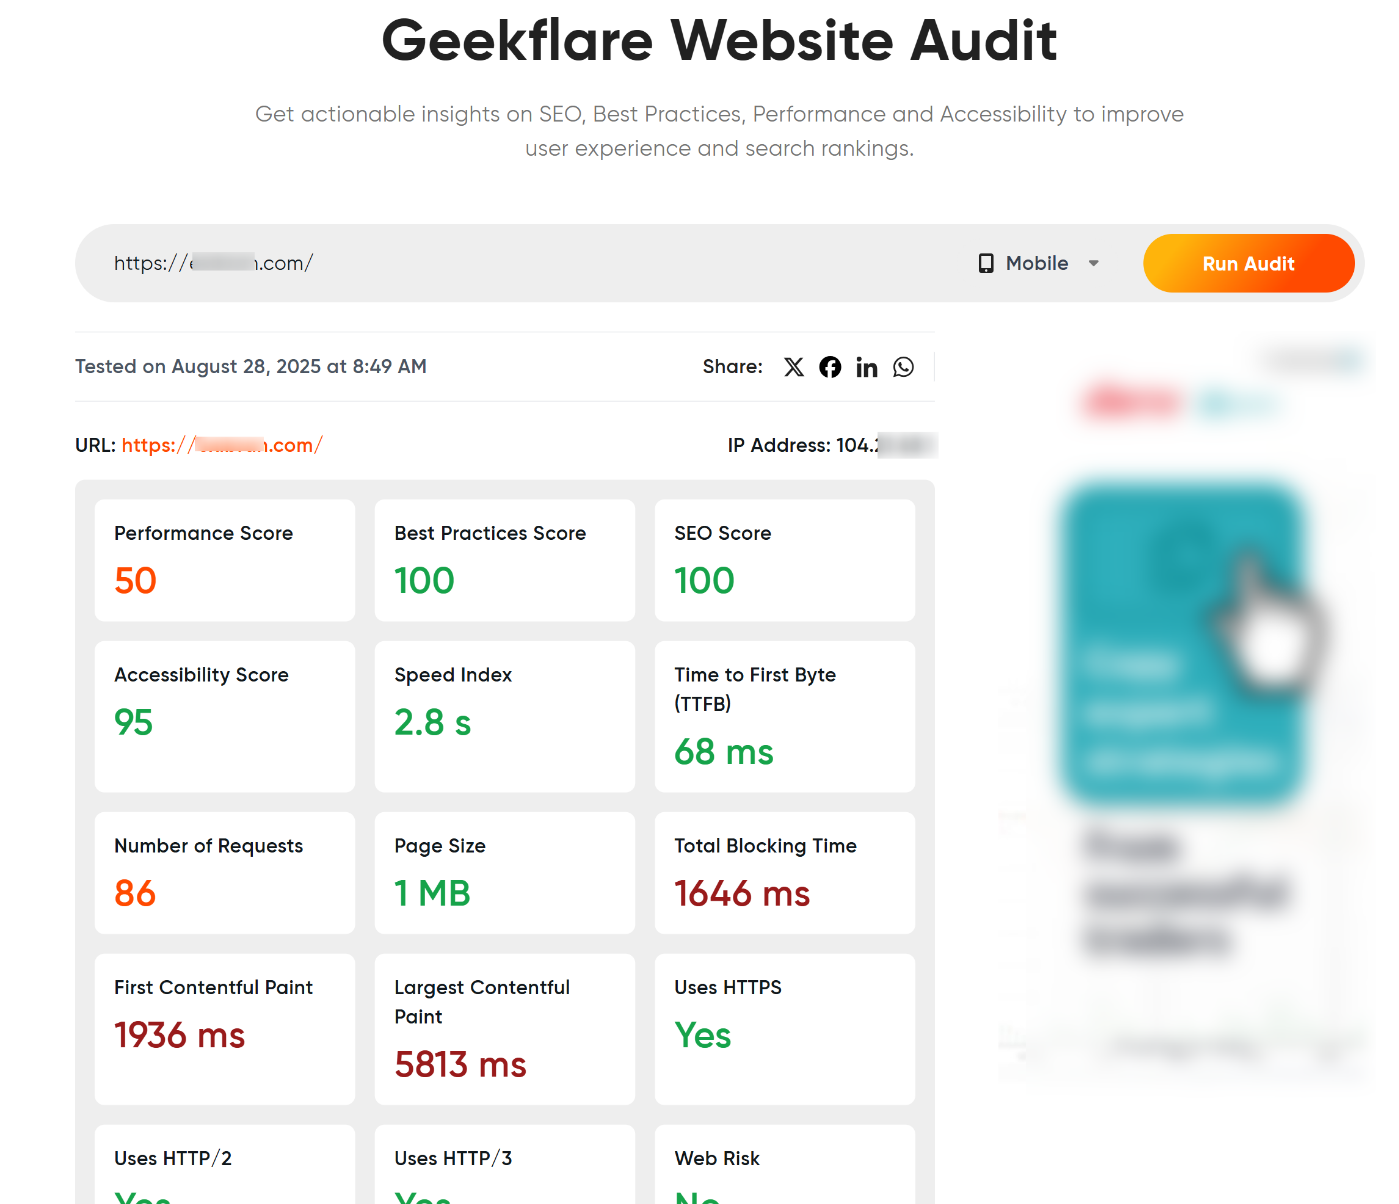
Simply enter your website, select either desktop or mobile, and click Run Audit. Within seconds, you get scores for Performance, Best Practices, SEO, and Accessibility.
It also provides details like server IP, test time, TTFB, LCP, FCP, total page size, number of requests, HTTP/2 or HTTP/3 support, and even Google Safe Browsing status.
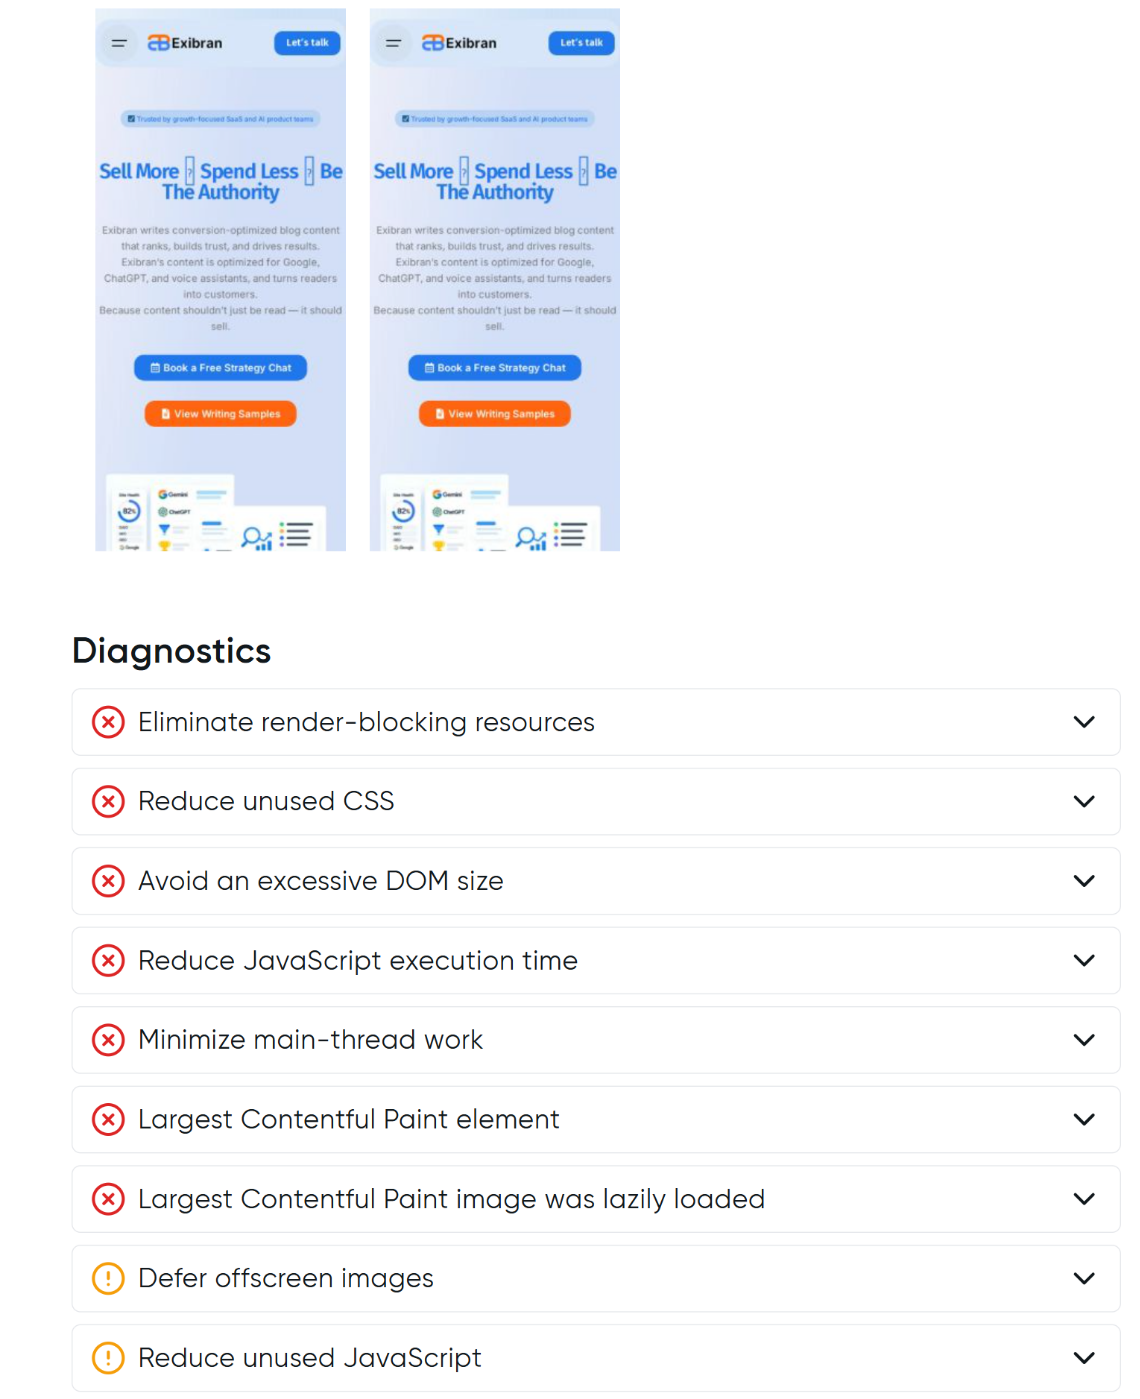
A nice touch is the loading sequence snapshots and diagnostics section, which visually shows how your page loads and where it may be slowing down.
What I like most is that Geekflare doesn’t hide any features behind a login or paywall. It’s generous for a free tool and offers insights that some bigger platforms don’t.
That said, it’s not built for deep-dive performance engineers. You won’t find advanced options like global test locations, historical tracking, or continuous monitoring.
Pricing: 100% free to use, with no registration required.
2.9 GiftOfSpeed
GiftOfSpeed was a fun discovery. It runs on Google’s Lighthouse engine, so you get trusted performance insights, but it adds its own twist with monitoring and trend tracking.
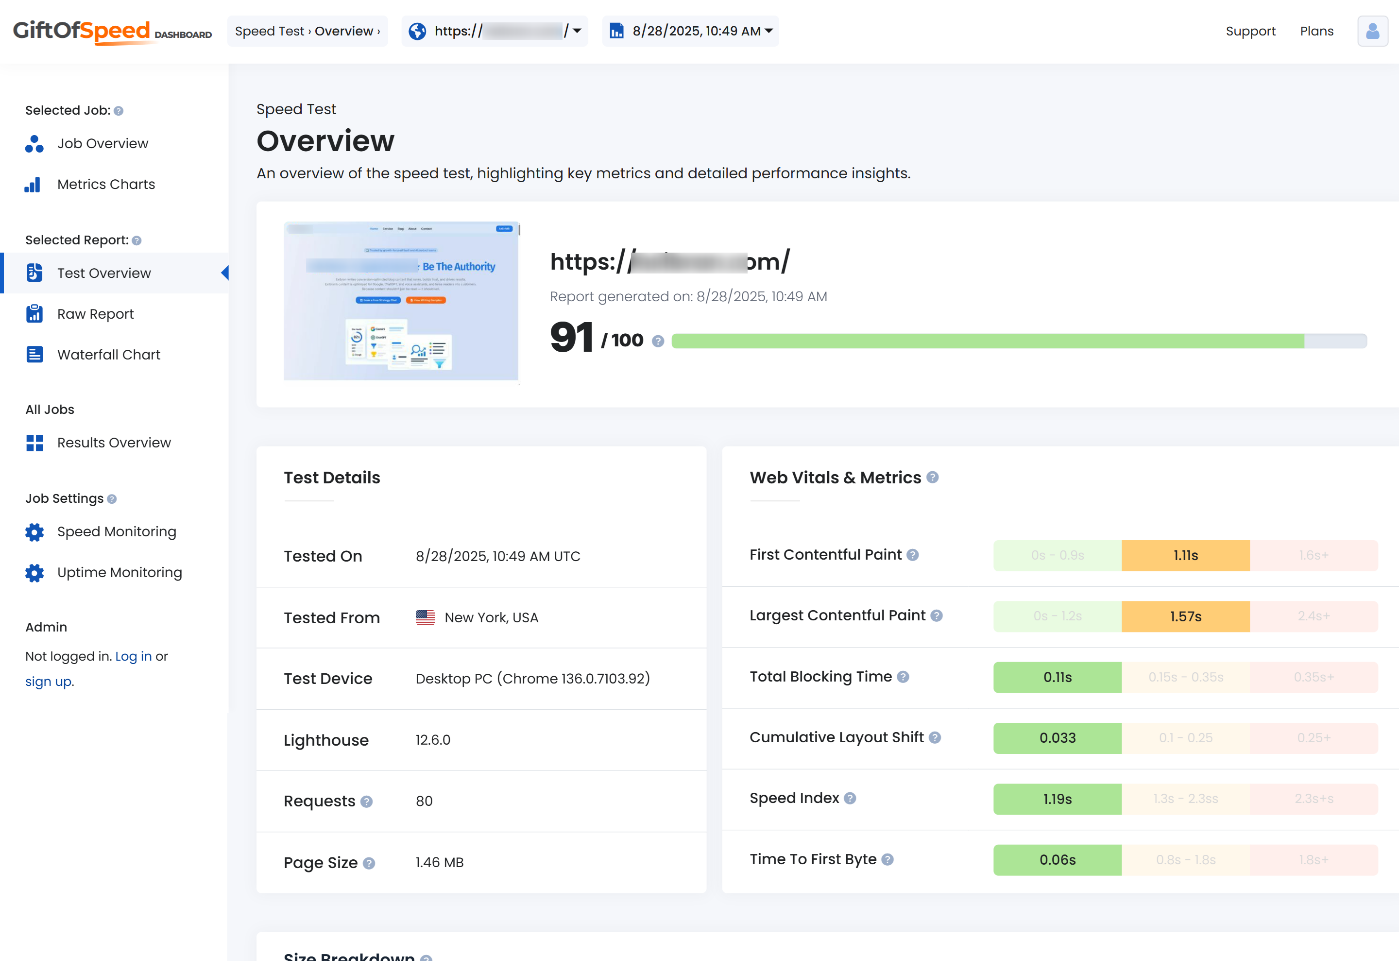
The tool provides detailed results on Core Web Vitals, including FCP, LCP, TBT, CLS, and TTFB, as well as the Speed Index.
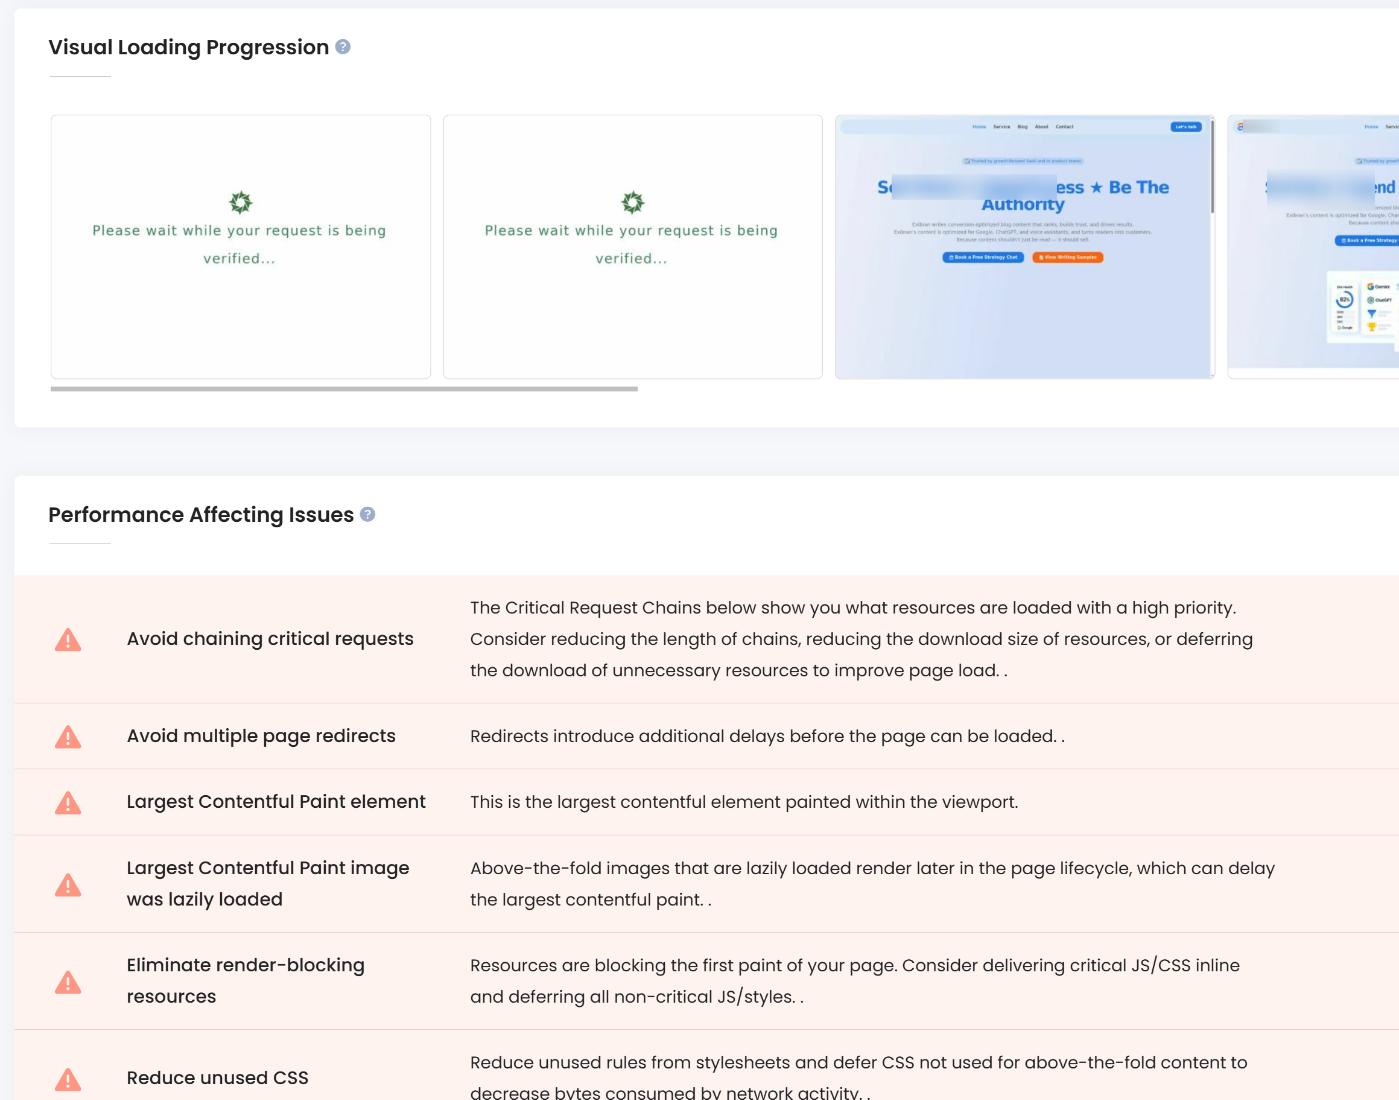
You can also see which local or external resources are slowing your site and view a visual loading progression that makes bottlenecks easy to spot.
What sets GiftOfSpeed apart is its monitoring feature. You can set up real-time alerts, so if your site slows down or goes offline, you’ll know instantly.
It also stores your test history and presents it in charts, so you can track performance over time instead of relying on one-off snapshots.
For solo site owners, bloggers, or small agencies, this is a great tool to cover both quick audits and ongoing performance monitoring.
The only catch is that you’ll need to log in to unlock those monitoring, job, and report features.
Pricing: Free for basic use. Monitoring and advanced features start at $4/month.
2.10 Yellow Lab Tools
I came across Yellow Lab Tools while looking for more than just speed scores. It also analyzes frontend code quality, and it turned out to be a pleasant surprise.
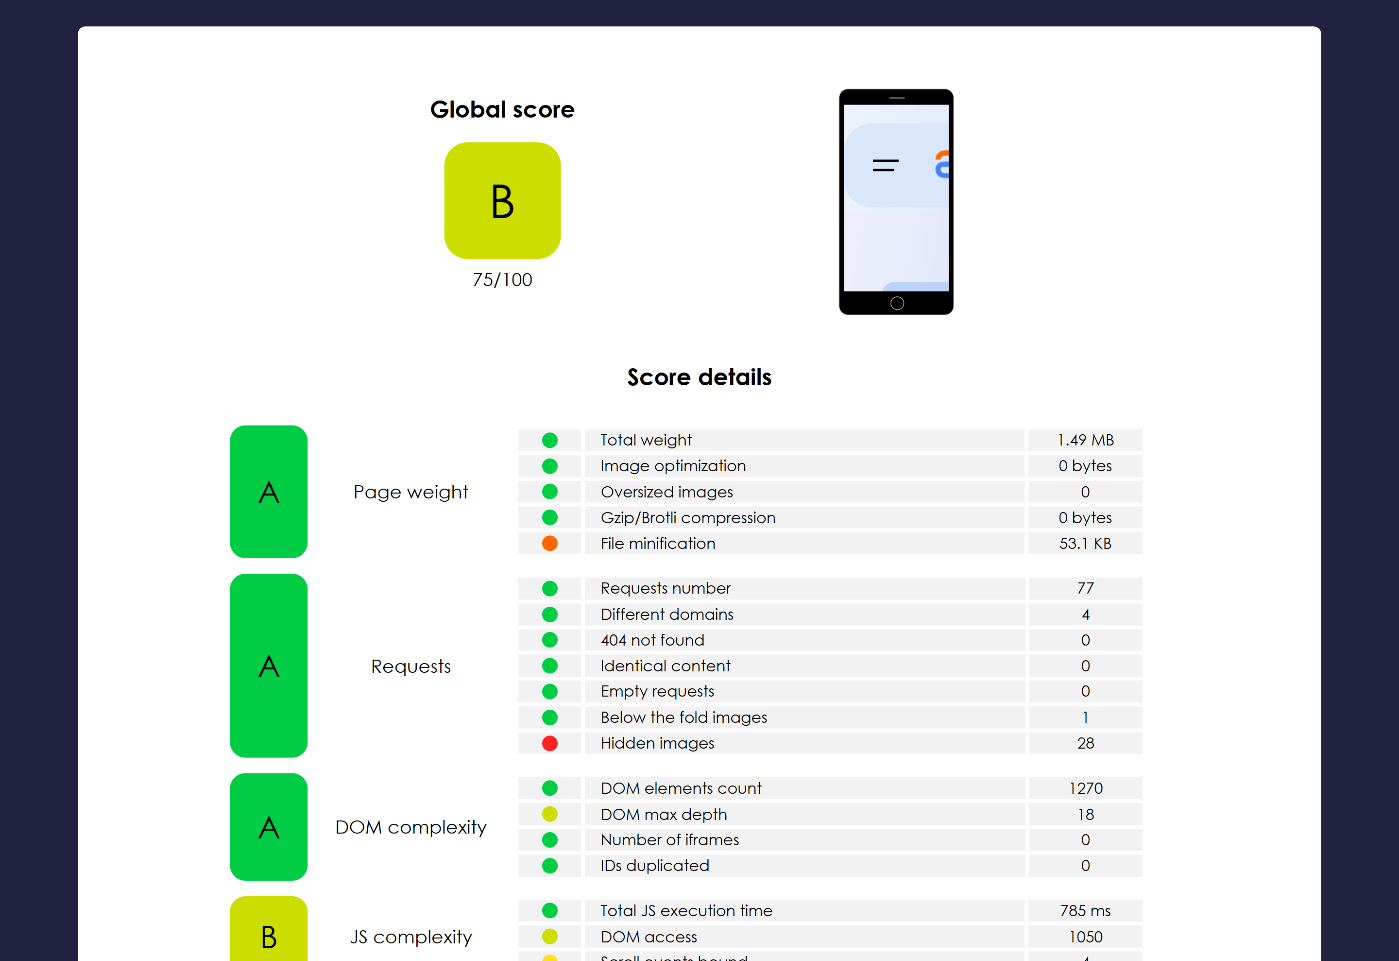
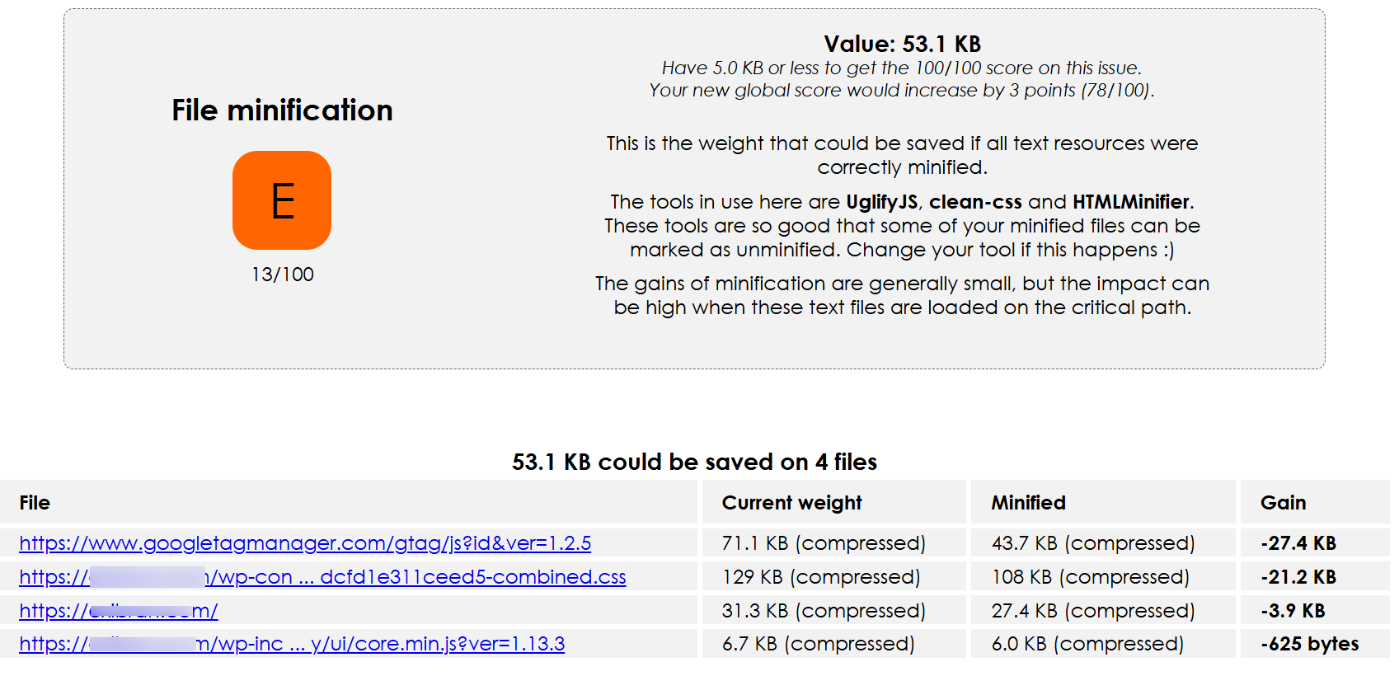
When you test your site, you get both a grading summary (A–F) and a 1–100 score. The real value is in what it checks: page weight, DOM complexity, CSS and JavaScript quality, font loading, number of requests, and even server configuration.
It doesn’t just focus on load time. It also shows where your frontend code might be causing slowdowns.
The reports are very visual. Each section opens to show the issue, its impact, and recommendations for fixing it.
I especially liked how it flagged CSS and JavaScript complexity that other tools often miss.
It’s simple, fast, and free with no signup required. If you’re building modern responsive pages and want a quick way to spot bad code practices alongside speed bottlenecks, this tool is excellent.
It’s not as advanced as GTmetrix or WebPageTest. You won’t get historical tracking, real-user monitoring, or global test locations. But for a free, instant check on frontend performance and code health, it’s hard to beat.
Pricing: 100% free.
3 Frequently Asked Questions
What tools do you use to test website speed?
Some of the most popular tools are Rank Math SEO’s built-in speed analyzer, Google PageSpeed Insights, GTmetrix, Pingdom, and WebPageTest. Each gives a slightly different perspective. Rank Math is great for WordPress users, PageSpeed shows Google’s benchmarks, and GTmetrix or Pingdom provides deeper technical insights.
What are the best ways to test website speed?
Using more than one tool is the best practice. For example, start with Rank Math SEO and PageSpeed Insights for quick benchmarks, then confirm results with GTmetrix. Always test on both mobile and desktop, try different locations if possible, and repeat tests multiple times to account for caching or traffic fluctuations.
What is the most accurate speed testing tool?
Accuracy depends on what you want to measure. For WordPress users, Rank Math SEO gives reliable in-dashboard insights. For lab-based data, Google PageSpeed Insights and Lighthouse are very precise.
What are some reliable website speed test tools?
Reliable options include Rank Math SEO, Google PageSpeed Insights, GTmetrix, Pingdom, WebPageTest, and Cloudflare Observatory. These tools provide consistent, actionable reports that cover load times, Core Web Vitals, and front-end performance.
What are the best alternatives to PageSpeed Insights?
If you want a different perspective, consider using Rank Math SEO for WordPress integration, GTmetrix for waterfall charts, Pingdom for simplicity, WebPageTest for advanced testing, or Yellow Lab Tools for in-depth front-end code analysis.
Why do speed test results fluctuate?
Results may vary due to factors such as server load, network conditions, caching, or third-party scripts. If your hosting server is busy or your CDN hasn’t cached content, your site may appear slower. That’s why it’s best to run tests multiple times and focus on consistent patterns rather than a single score.
What is a good PageSpeed score?
On Google PageSpeed Insights, 90 or above is excellent, 50–89 shows room for improvement, and below 50 is poor. But don’t chase a perfect 100. Focus on Core Web Vitals like Largest Contentful Paint (LCP), First Input Delay (FID), and Cumulative Layout Shift (CLS), as these directly affect SEO and user experience.
4 Conclusion
At the end of the day, the best website speed test tool depends on what you’re trying to achieve.
For quick checks, PageSpeed Insights is perfect. For in-depth diagnostics, GTmetrix and WebPageTest provide detailed insights. Tools like Cloudflare Observatory and Geekflare let you track real-world performance over time.
WordPress users have an extra advantage with Rank Math SEO, which allows you to monitor your page speed directly in your dashboard without needing to switch between tools.
The main takeaway is this: don’t just chase perfect scores. Focus on what actually improves your site’s performance for real visitors.
Faster load times lead to a better user experience, lower bounce rates, increased conversions, and more substantial SEO rankings. Even minor improvements, such as shaving a second off load time, can make a significant difference.
If you like this post, let us know by Tweeting @rankmathseo.