What Is Total Blocking Time (TBT)?
Total blocking time (TBT) is a metric that measures how long the main thread is blocked, such that it cannot quickly respond to user inputs, such as mouse clicks, keyboard presses, and screen taps.
The blocking of the main thread causes a delay between the moment a user interacts with the page and when the page responds.
The main thread itself is considered blocked when a task runs on it for over 50 milliseconds. For example, the image below illustrates a main thread that runs four tasks: A, B, C, and D.
Only task C (the third task) runs below 50 milliseconds. This means it does not block the main thread and therefore does not contribute to your total blocking time.
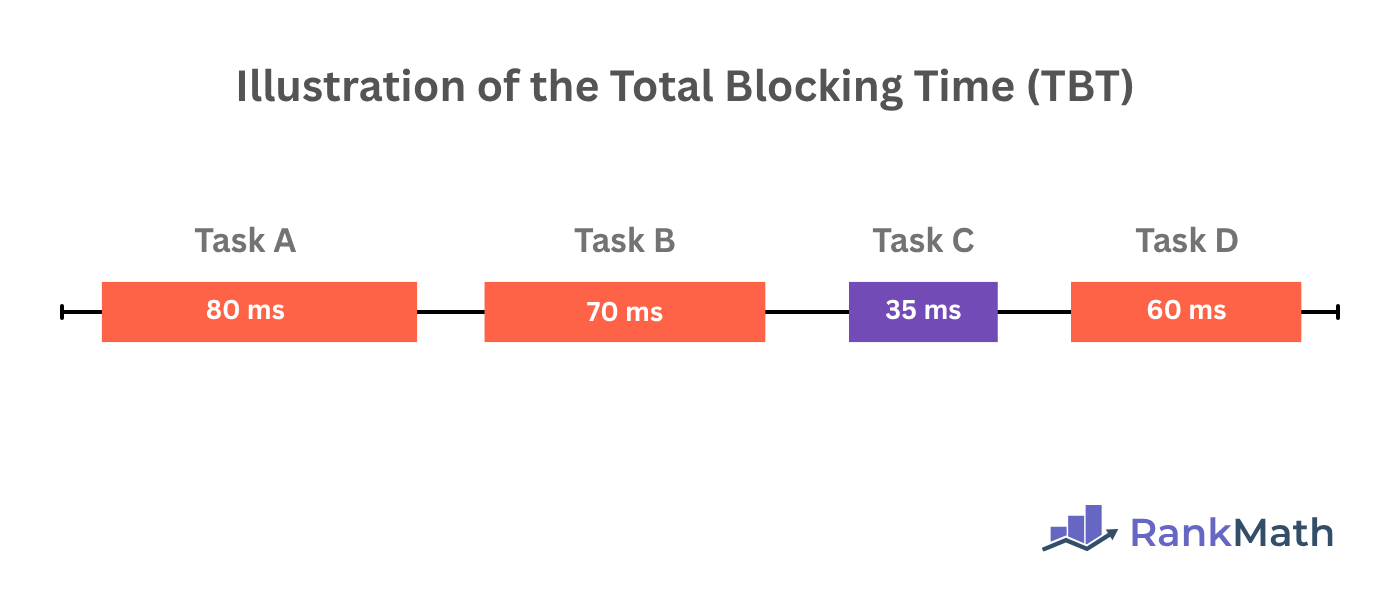
The three other tasks (tasks A, B, and D) take more than 50 milliseconds to complete, which means they block the main thread and therefore count towards your total blocking time.
Google begins to evaluate the total blocking time when the first contentful paint (FCP) starts and terminates it when the time to interactive (TTI) begins.
- First contentful paint is the time it takes for the first visible element to appear on the screen
- Time to interactive is the moment a webpage becomes reliably interactive
With that said, to better understand the total blocking time, we should understand the main thread.
In this article, we’ll cover:
What Is the Main Thread?
The main thread is the part of the browser that renders most of the elements that make up the webpage.
Rendering itself is the process of converting code into the visible webpage that we see. It includes actions such as parsing HTML, applying CSS code for style and layout, and executing JavaScript files for interactivity.
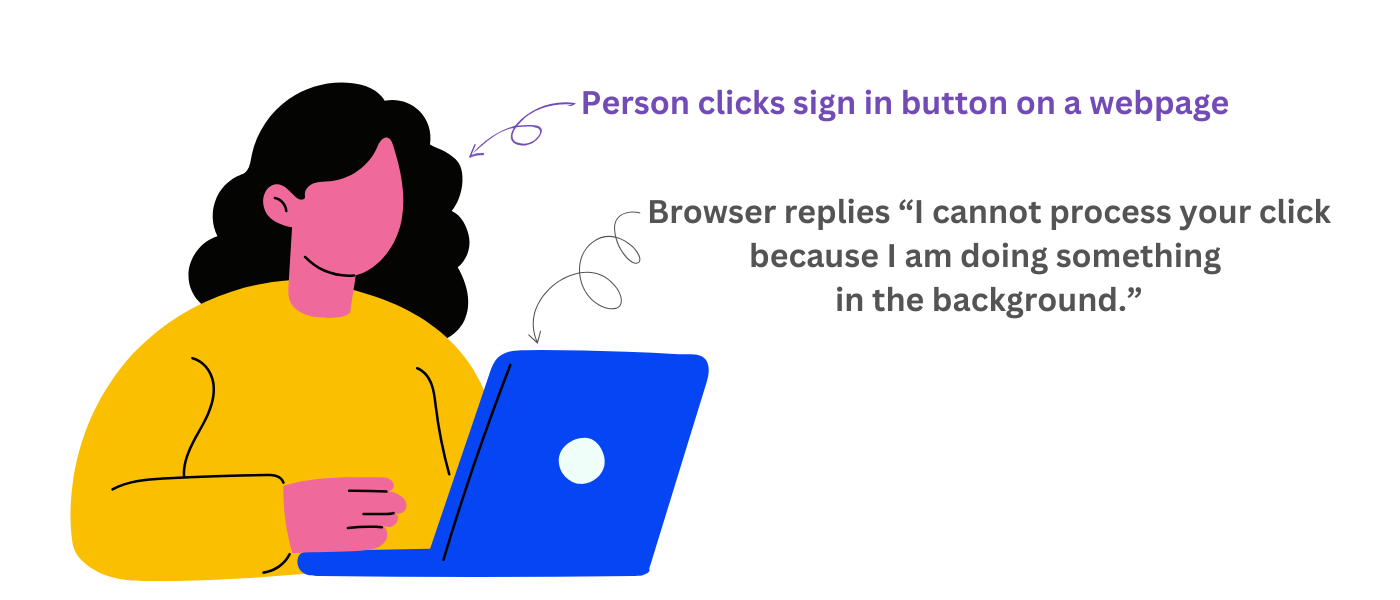
When the main thread is busy, possibly because it is parsing an HTML file, applying CSS code, or executing a JavaScript file, it will be unable to respond to user interactions, such as mouse clicks, screen taps, and keyboard inputs.
So, when a user, for example, clicks on a button on the page, the browser will not process the click until the main thread is free.
This is undesirable because the user may notice this delay and will assume the page is broken or not responsive. This results in a poor user experience, and depending on the length of the delay, may cause them to leave the page for another site.
How the Total Blocking Time Is Evaluated
The total blocking time (TBT) is evaluated based on main thread tasks that run between the first contentful paint (FCP) and the time to interactive (TTI). Specifically, it only includes long tasks, that is, tasks that run for more than 50 milliseconds.
The part of the task that exceeds the 50-millisecond mark is considered the blocking portion. The blocking portion of every long task is then summed up to calculate the total blocking time.
For example, if a main task takes 65 milliseconds to complete, the blocking portion will be 15 milliseconds. If another main task takes 70 milliseconds to complete, the blocking portion will be 20 milliseconds.
If a third task takes 40 milliseconds to complete, then it won’t have a blocking portion since it was completed before reaching the 50-millisecond limit.
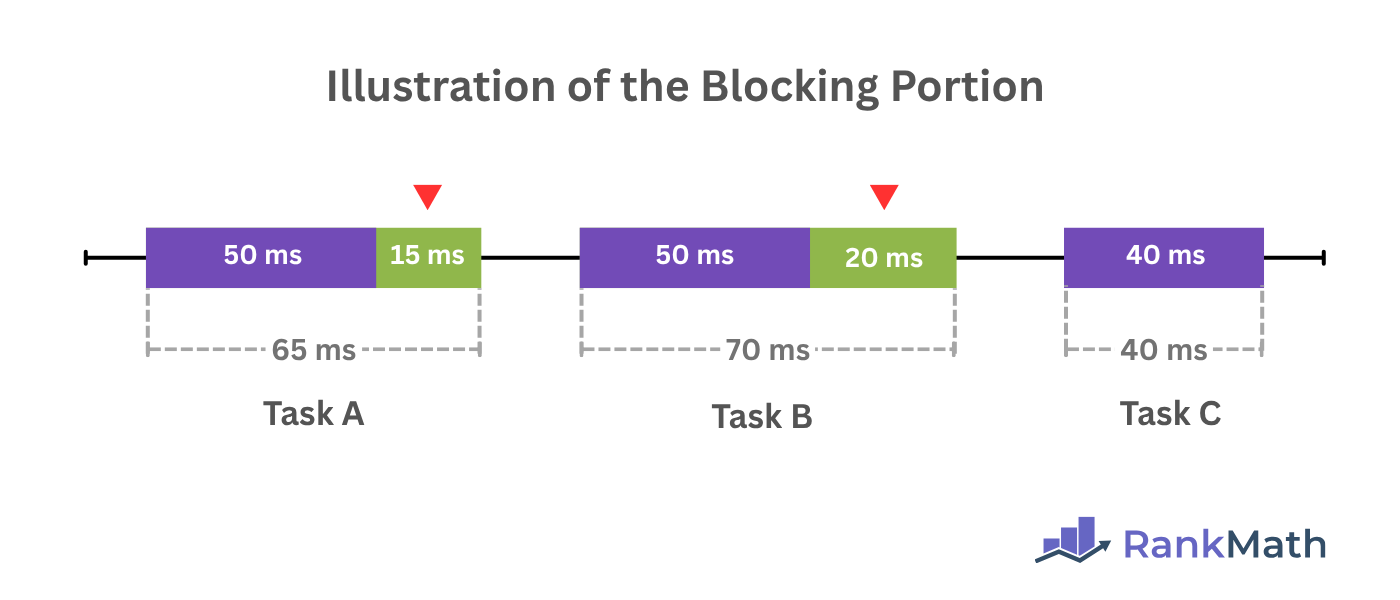
Both blocking portions (15 and 20 milliseconds) will then be summed together to arrive at a total blocking time of 35 milliseconds.
Importance of the Total Blocking Time
The total blocking time is important because it allows developers and search engines to evaluate the interactiveness of a webpage.
Search engines already have a metric for measuring interactiveness, which is known as the interaction to next paint (INP). However, the interaction to next paint can only be evaluated when a real-life user interacts with the webpage.
This means the interaction to next paint cannot be used in a lab environment, which is a controlled setting where developers and search engines simulate how a webpage behaves during loading and interaction.
So, developers and search engines use the total blocking time in place of the interaction to next paint in the lab environment.
That way, the total blocking time allows developers and search engines to uncover whether a webpage can respond to a user’s input, while the interaction to next paint shows developers and search engines how the page actually responds.
How to Measure the Total Blocking Time
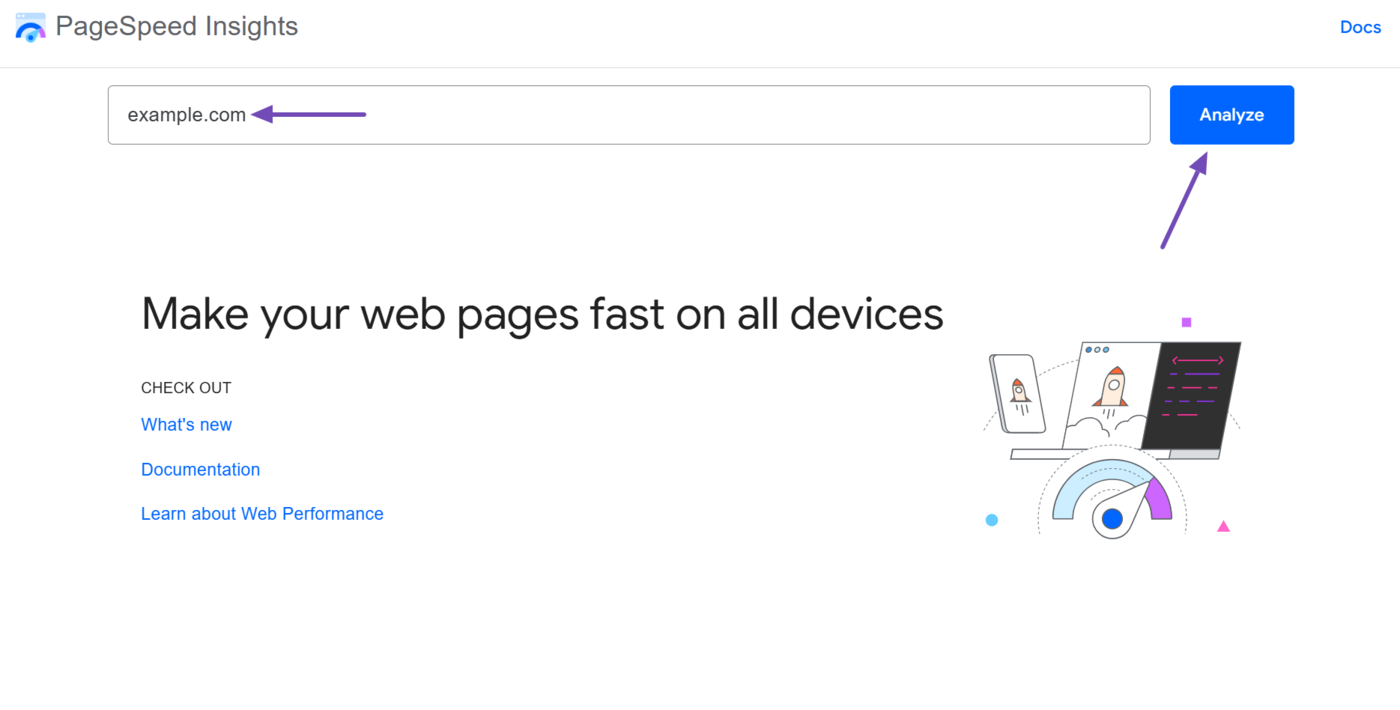
You can measure the total blocking time using PageSpeed Insights. To get started, head to the PageSpeed Insights tool and enter the URL you want to inspect. Once done, click Analyze.
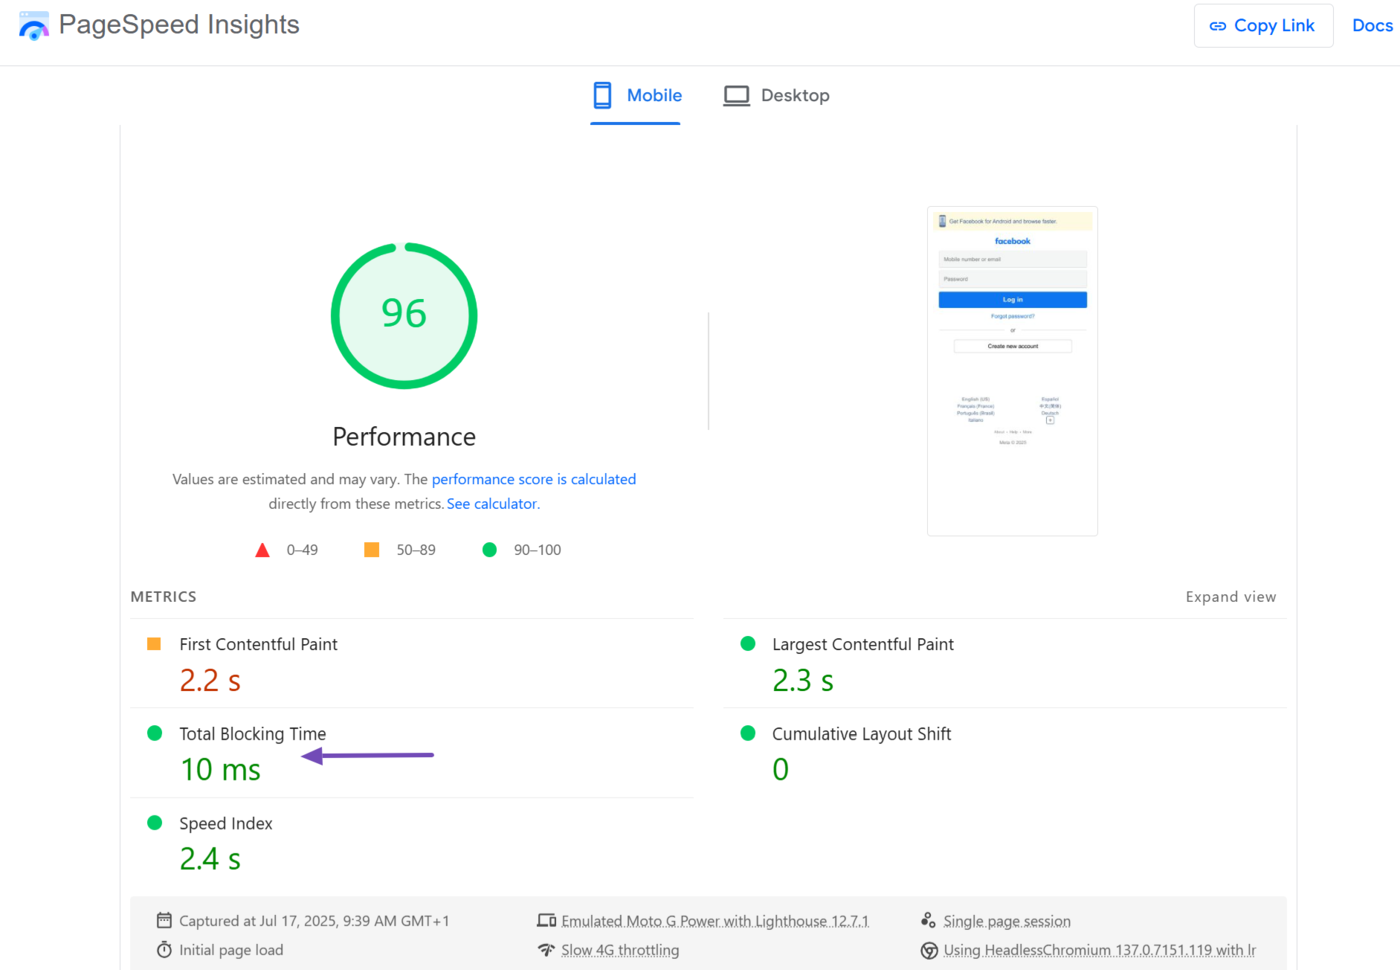
The PageSpeed Insights tool will return multiple metrics for the URL. Now, scroll to the Diagnose performance issues field. The total blocking time will be displayed, as shown below.
Note that this is the total blocking time for the mobile version of the URL. A good one should be 200 milliseconds or below.
- Green: 0 – 200 milliseconds (Your total blocking time is okay)
- Orange: 200 – 600 milliseconds (Your total blocking time is moderate)
- Red: Over 600 milliseconds (Your total blocking site is slow)
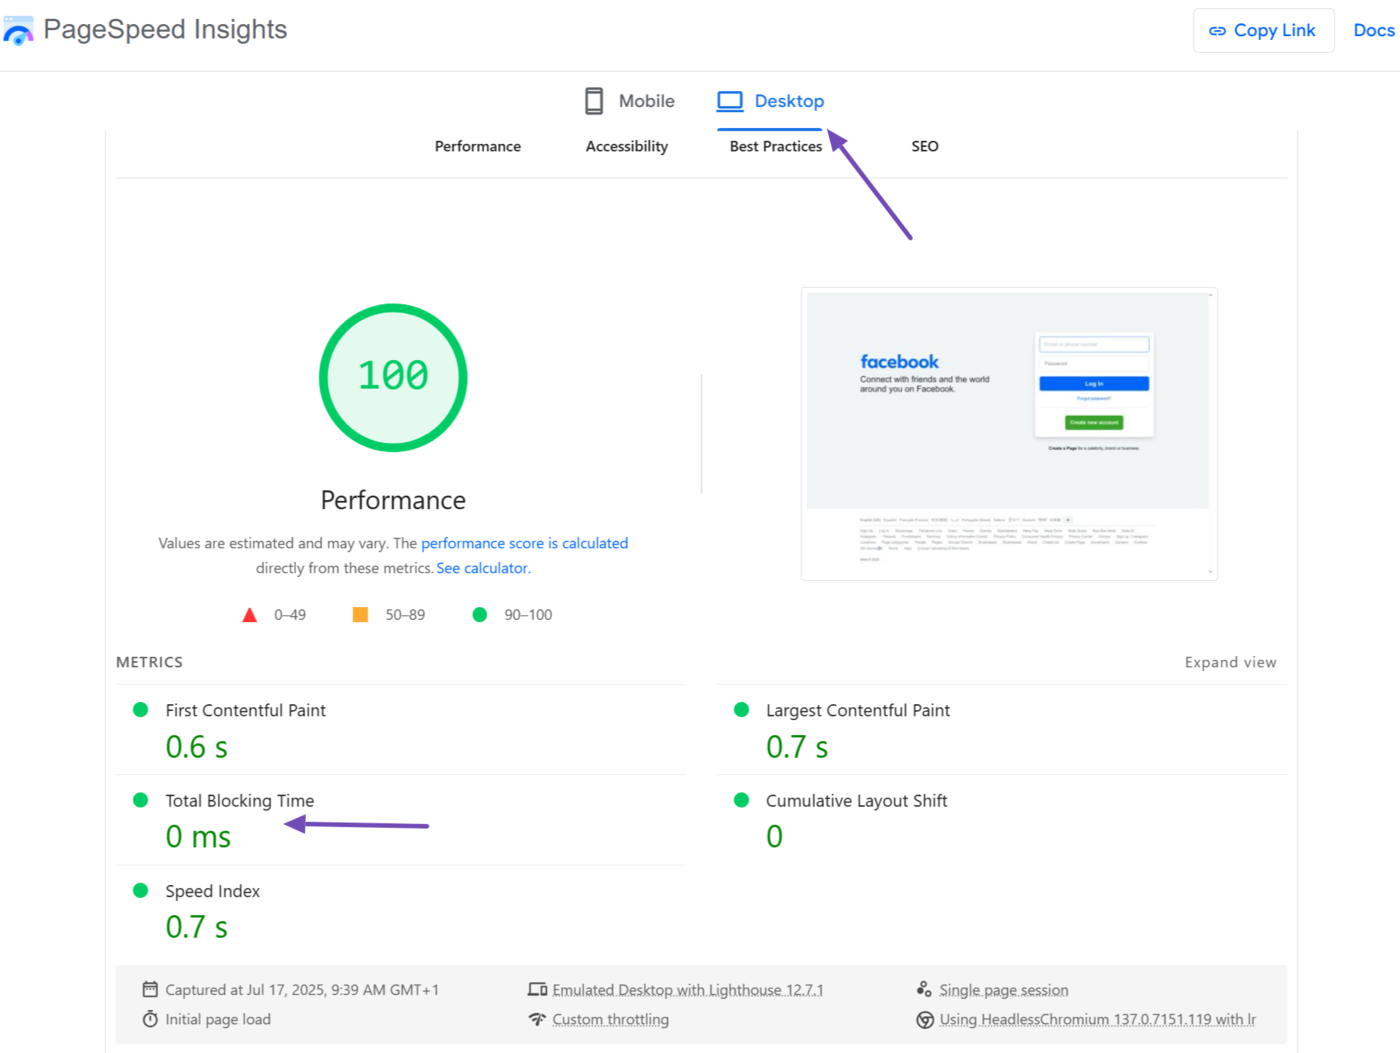
Once done, click Desktop at the top of the page to view the total blocking time for the desktop version of the URL.
- Green: 0 – 150 milliseconds (Your total blocking time is okay)
- Orange: 150 – 350 milliseconds (Your total blocking time is moderate)
- Red: Over 350 milliseconds (Your total blocking site is slow)
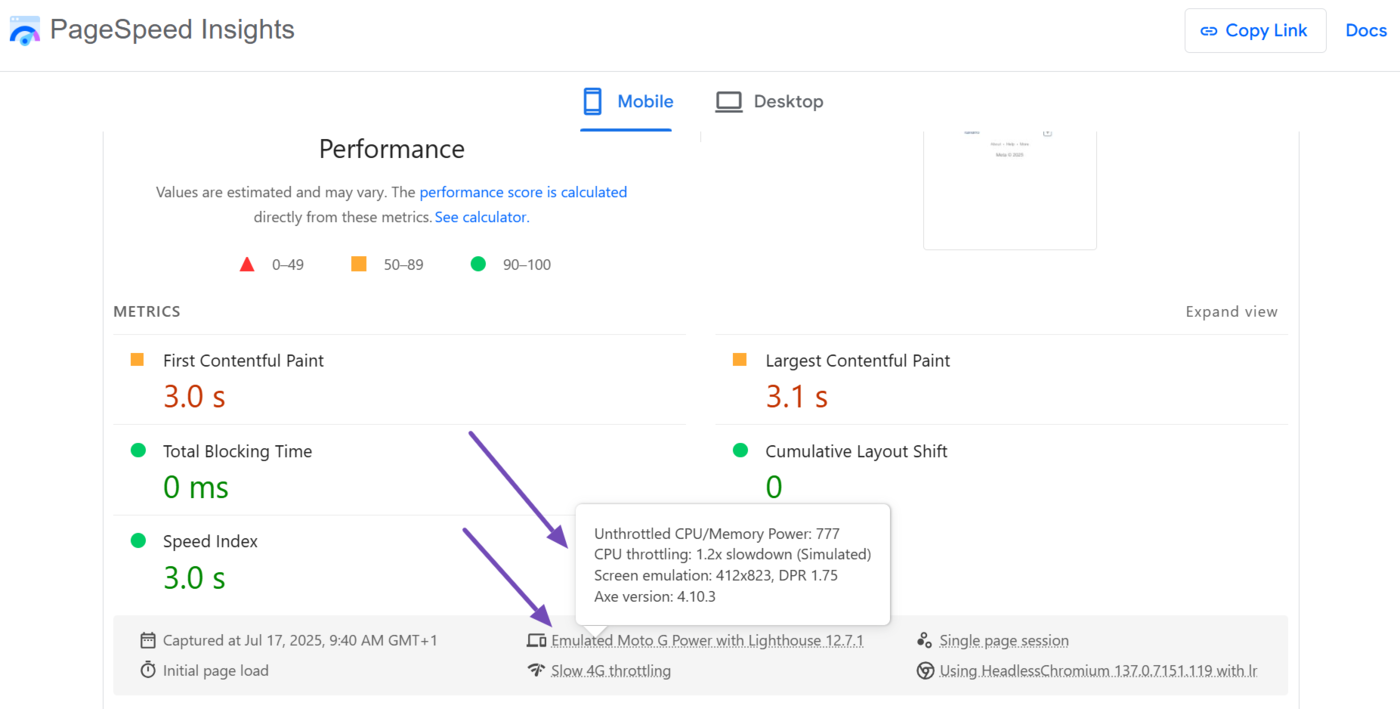
As we previously mentioned, the total blocking time is a lab metric. That is, it is measured in a stimulated environment using a device that mimics a real-life device.
You can view the device PageSpeed Insights used for this test by hovering over the applicable option, as shown below.
How to Improve Your Total Blocking Time
A poor total blocking time and interaction to next paint score is typically caused by large, unnecessary, or inefficient JavaScript code executing on the page.
However, total blocking time alone has limited real-world use, so it is better to focus on improving your interaction to next paint instead. Improving the interaction to next paint will also typically improve the total blocking time.
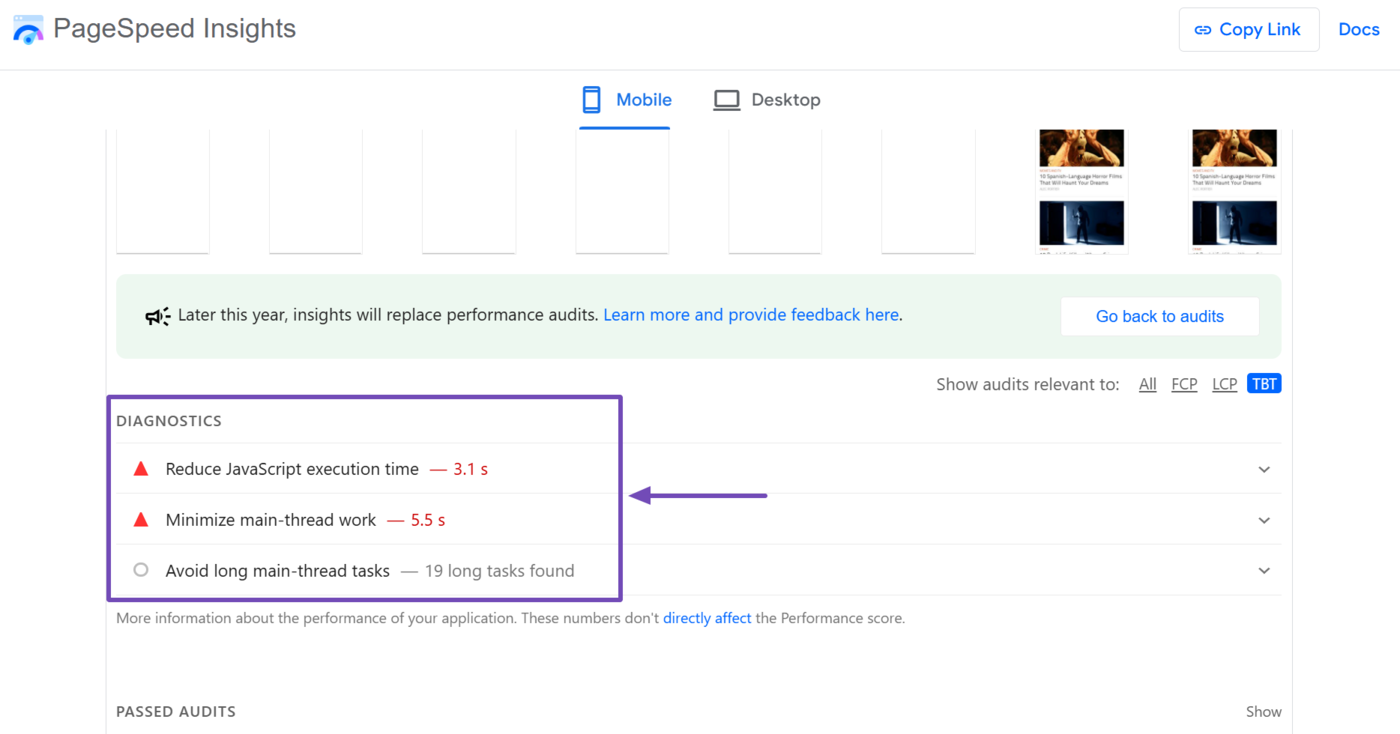
However, if you want to focus on the total blocking time, click on TBT in the Performance section of PageSpeed Insights, as shown below.
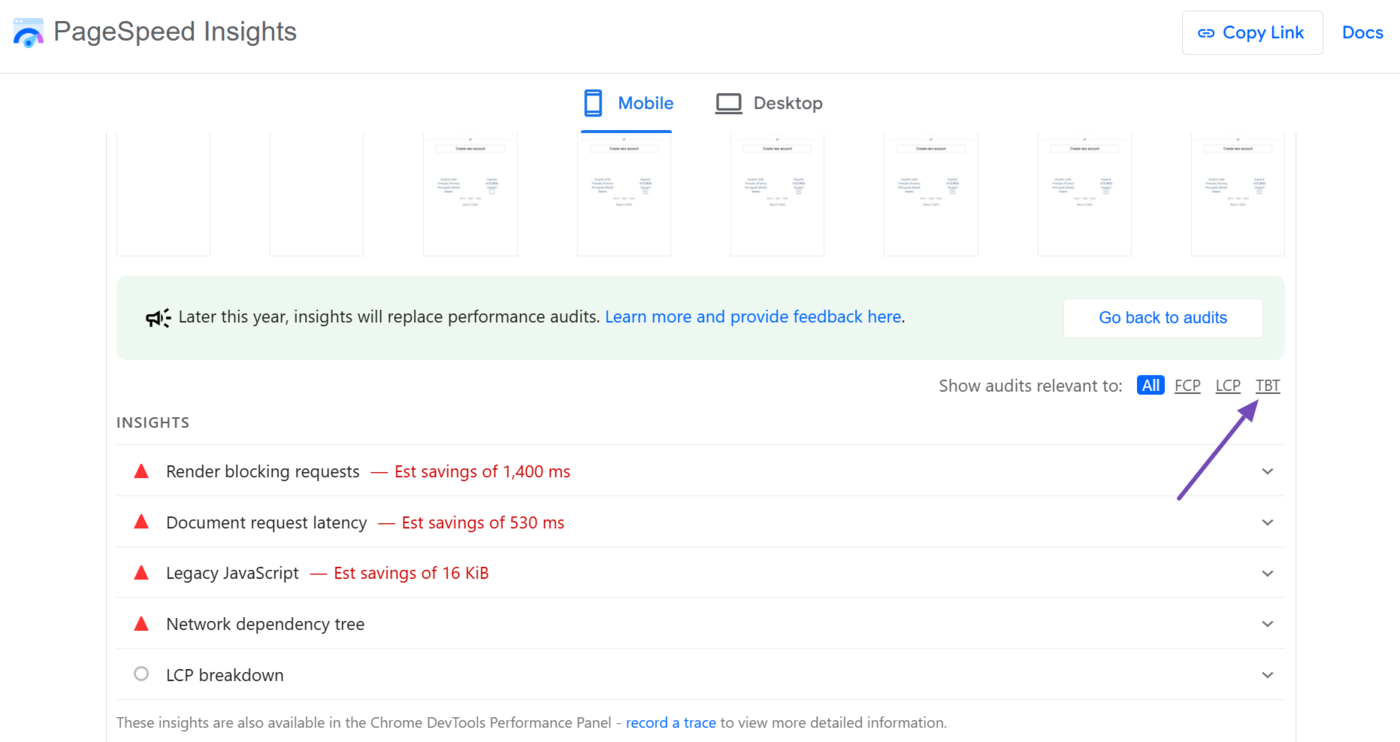
It will return insights and diagnostics related to the total blocking time. You can then proceed to fix these issues. However, note the ones below, as they have a greater impact on your total blocking time.
- Reduce JavaScript execution time
- Minimize main-thread work
- Avoid long main-thread tasks
- Reduce the impact of third-party code
- Keep request counts low and transfer sizes small
All of the above issues indicate the need to optimize your JavaScript code. So, remove unnecessary JavaScript code and break the important ones into smaller, more manageable chunks that run for less than 50 milliseconds.
You should only load the necessary JavaScript (both your own and third-party code) at the beginning of the page load process and defer loading others until later. You should also consider minifying your JavaScript files to reduce their size and improve your page load speed.