If you want to understand how visitors use your website, Google Analytics is one of the best tools you can set up.
It helps you see where your visitors are coming from, what pages they spend the most time on, and where they leave your site.
Setting it up may seem a bit technical at first, but the process is simple once you know the steps.
In this post, you’ll learn how to easily set up Google Analytics, so you can start tracking your website’s performance and make informed decisions about your content.

Table Of Contents
1 What is Google Analytics?
Google Analytics is a free tool from Google that helps you understand how visitors use your website. When you set it up, you add a small tracking code to your site, and that code collects information about your visitors, like where they come from, which pages they visit, and how long they stay.
All of this data is then turned into easy-to-read reports and dashboards. You can see how visitors find your site, what they do once they’re there, and whether they take actions you care about, such as signing up for your newsletter or making a purchase.
With the insights from Google Analytics, you can make better decisions, improve your visitors’ experience, and focus your efforts on what truly helps you reach your goals.
2 How to Set Up Google Analytics
It’s important to set up Google Analytics correctly from the start to get the most out of it.
This involves creating an account, setting up properties, installing the tracking code on your website, verifying the installation, and configuring data streams.
2.1 Create a Google Analytics Account
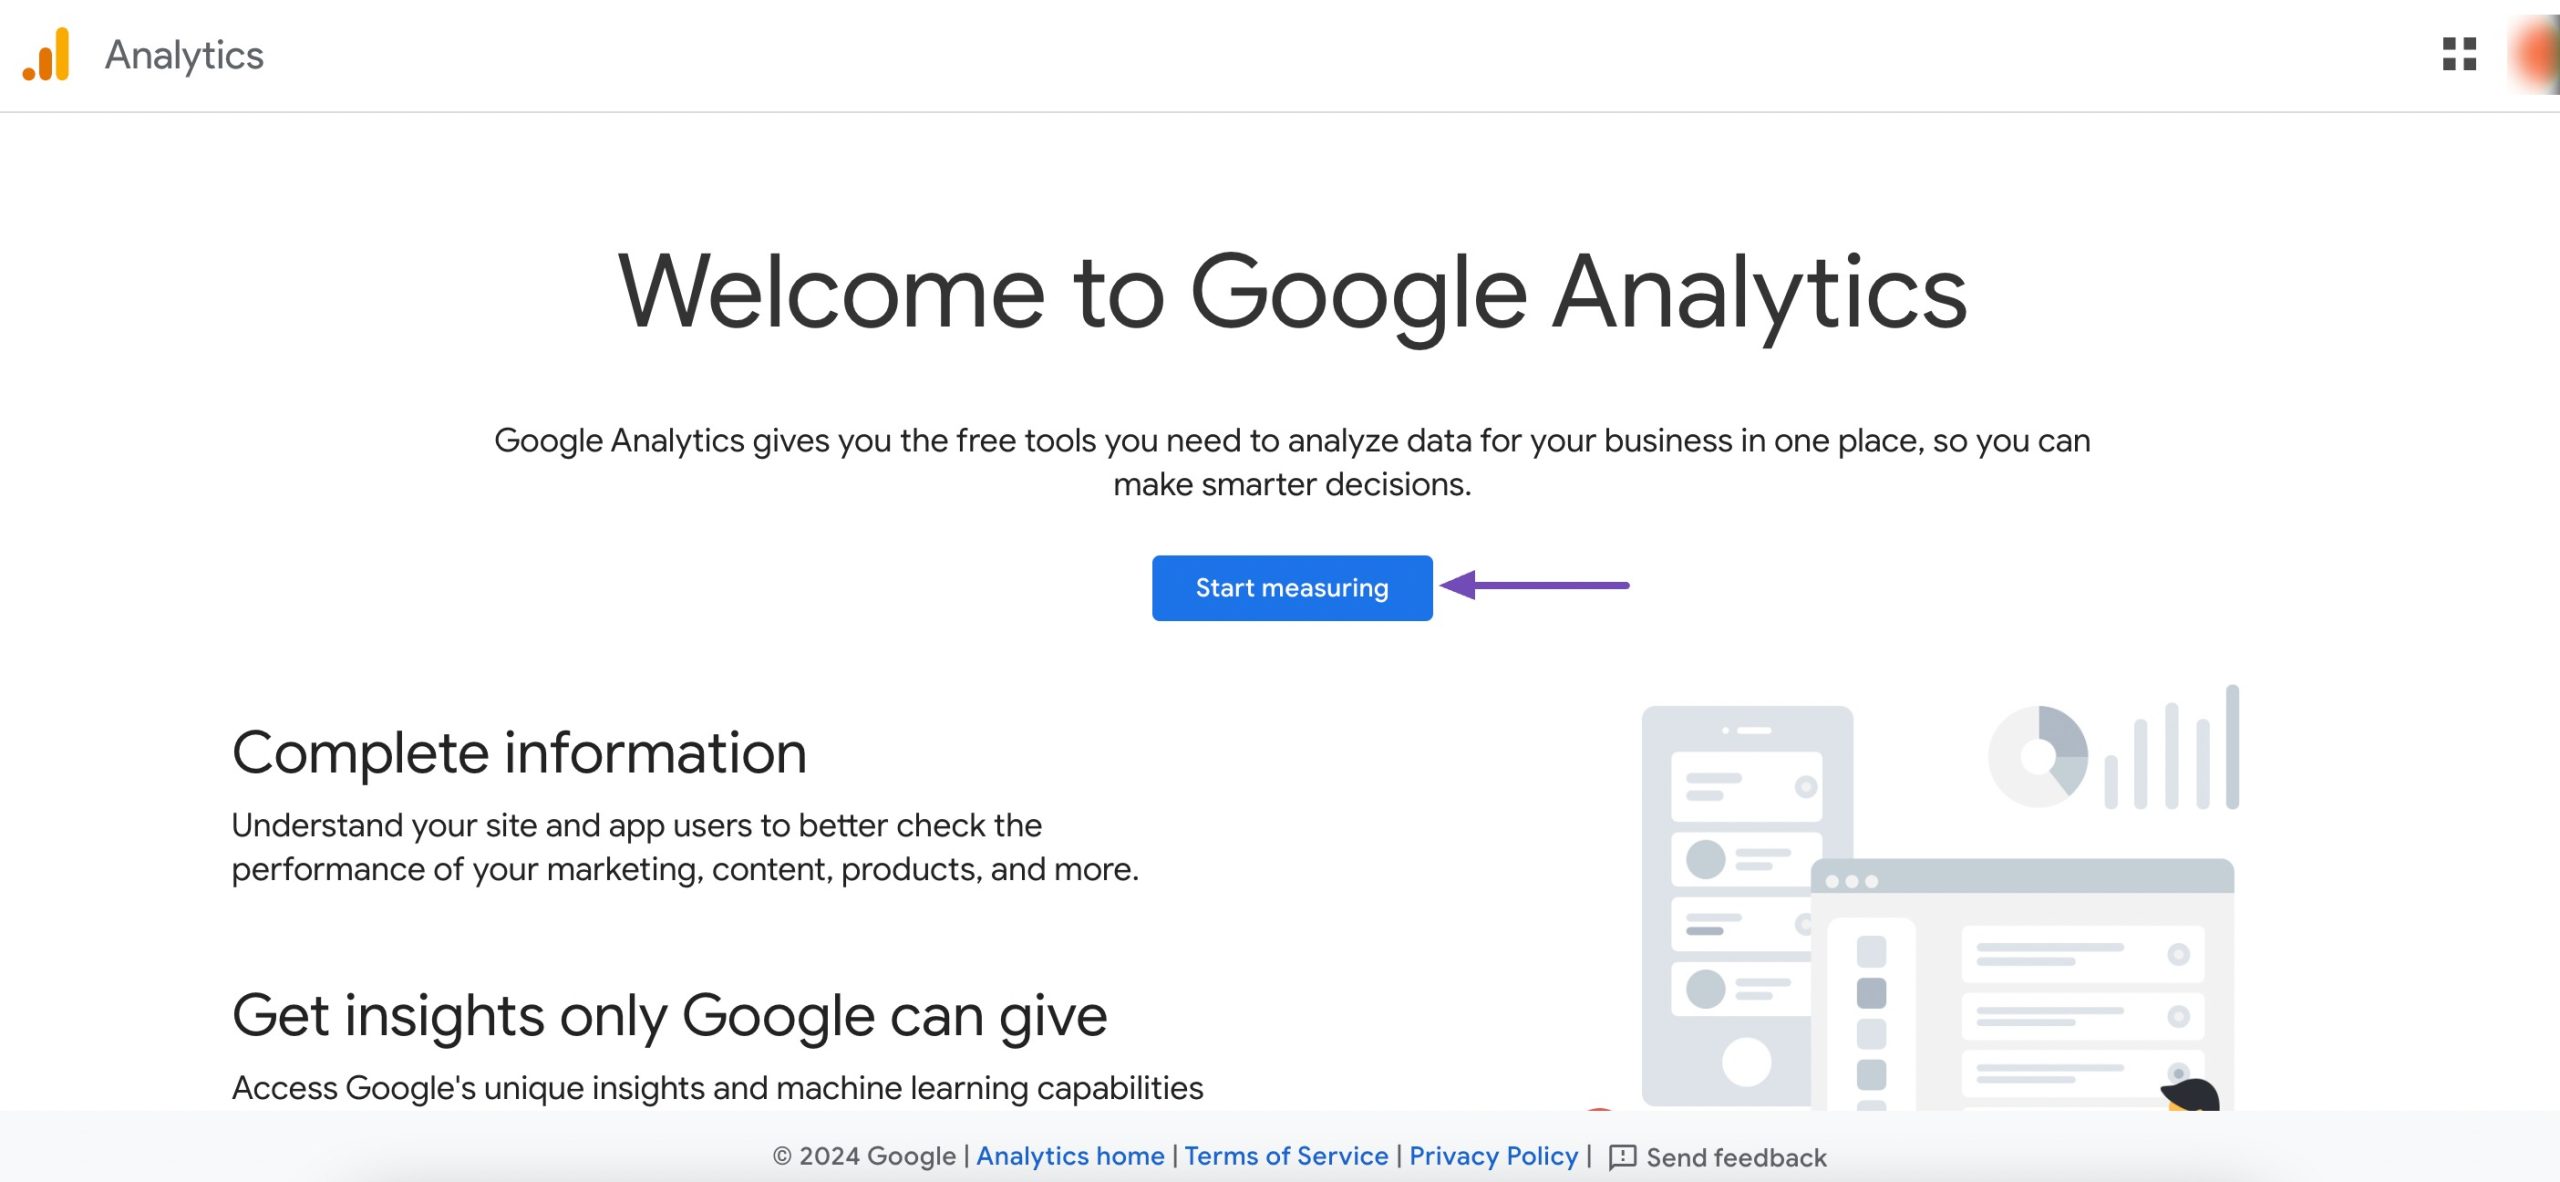
The first step in using Google Analytics is to create an account.
Start by navigating to the Google Analytics website and clicking on the Start measuring button.
You’ll need to log in with your Google account. If you don’t have a Google account, you will need to create one.
Once logged in, enter an account name, which can be your business name or any other identifier that suits your needs.
Google Analytics allows you to track multiple websites within a single account. This means if you manage multiple businesses, each with its own website, you can group these websites together under one account and assign a group name for easier reference and management.
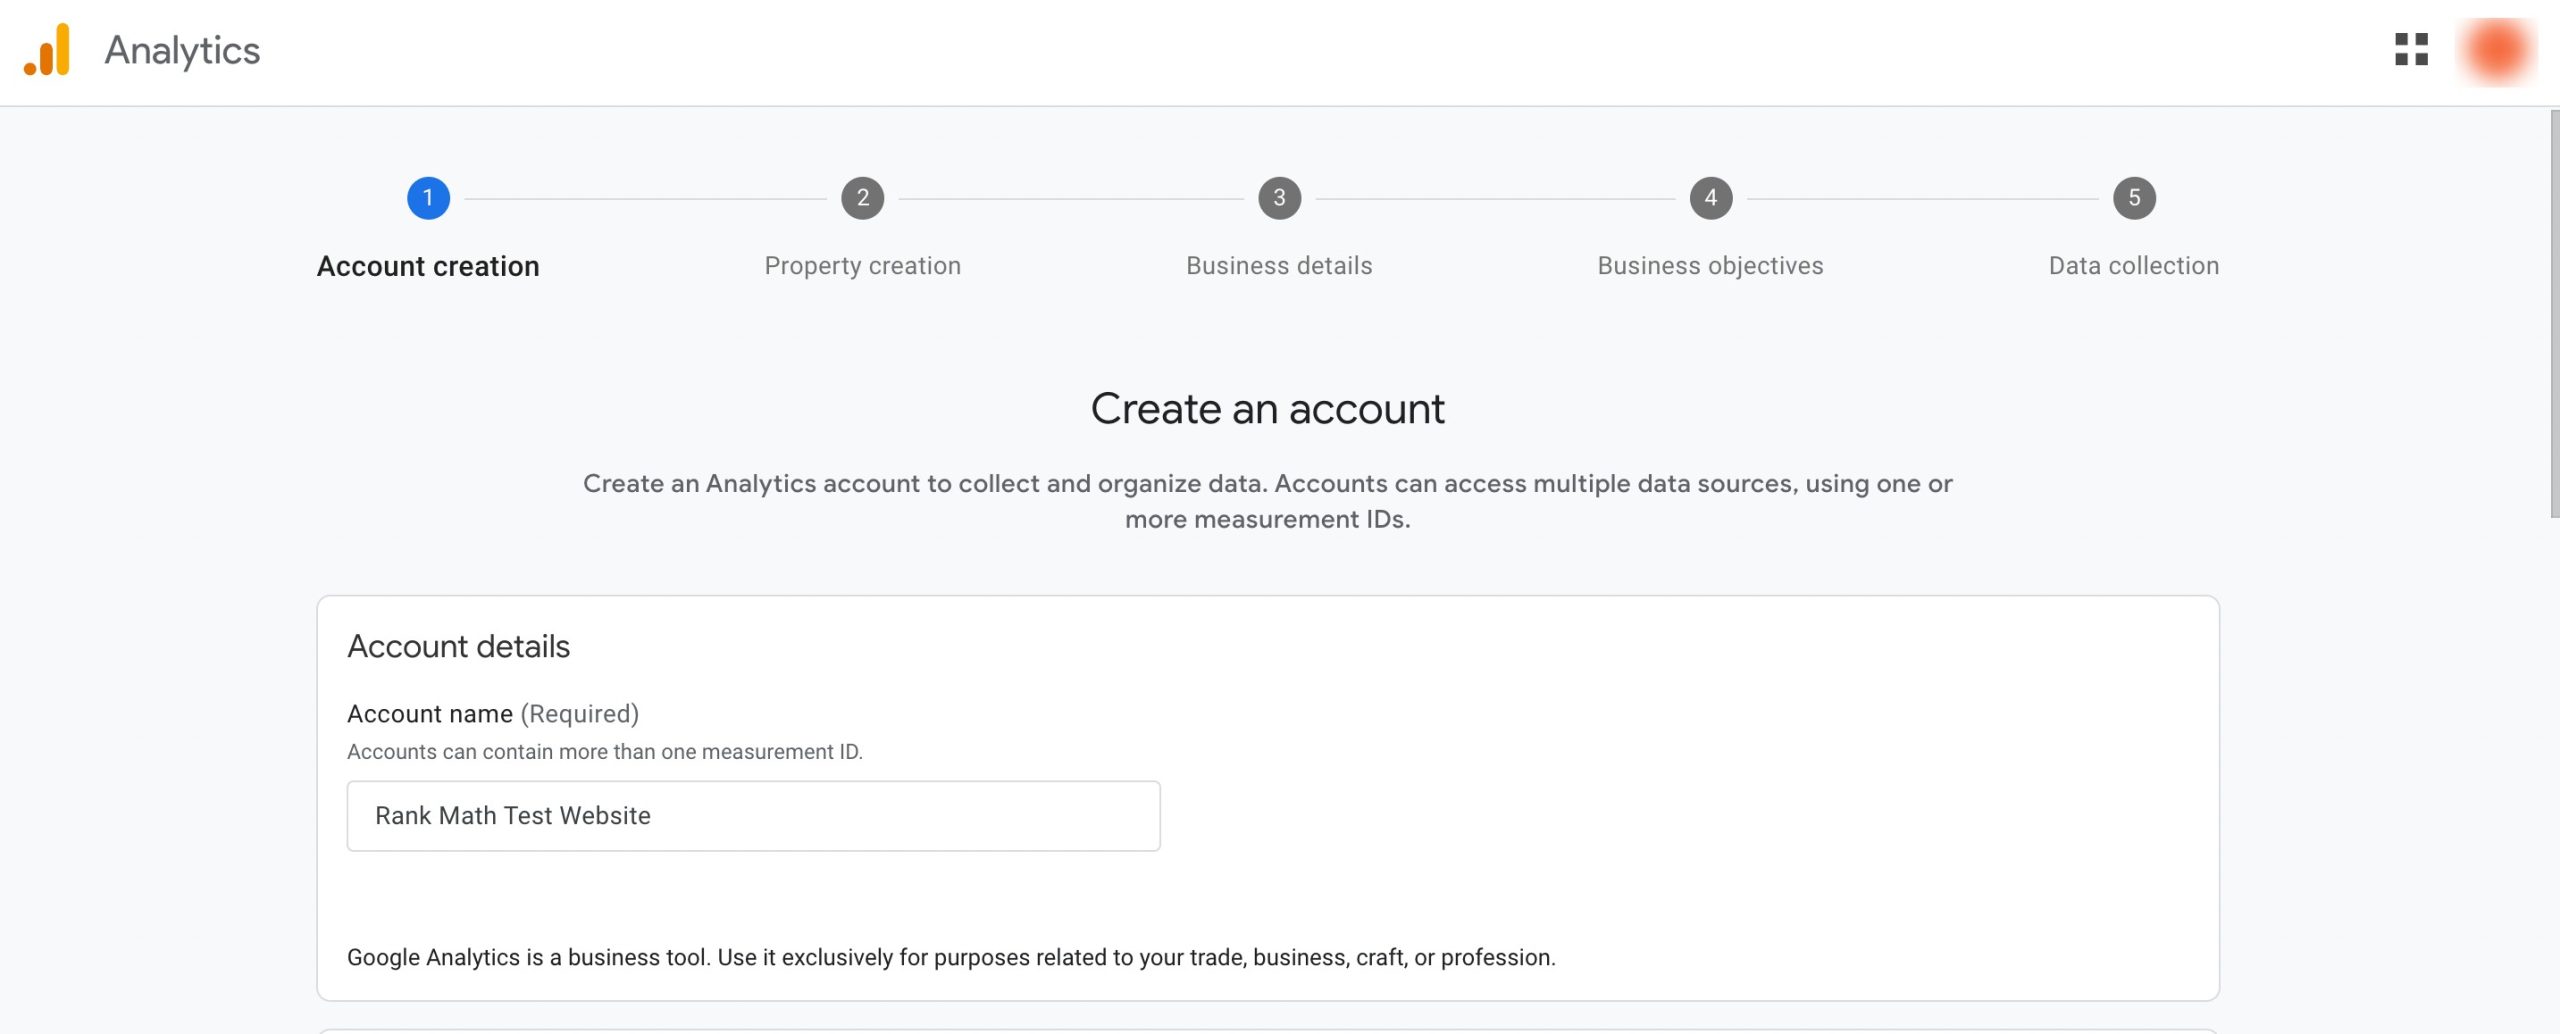
Additionally, configure the data-sharing settings according to your preferences, considering factors like whether you want to share your data with Google’s technical support or with Google products and services.
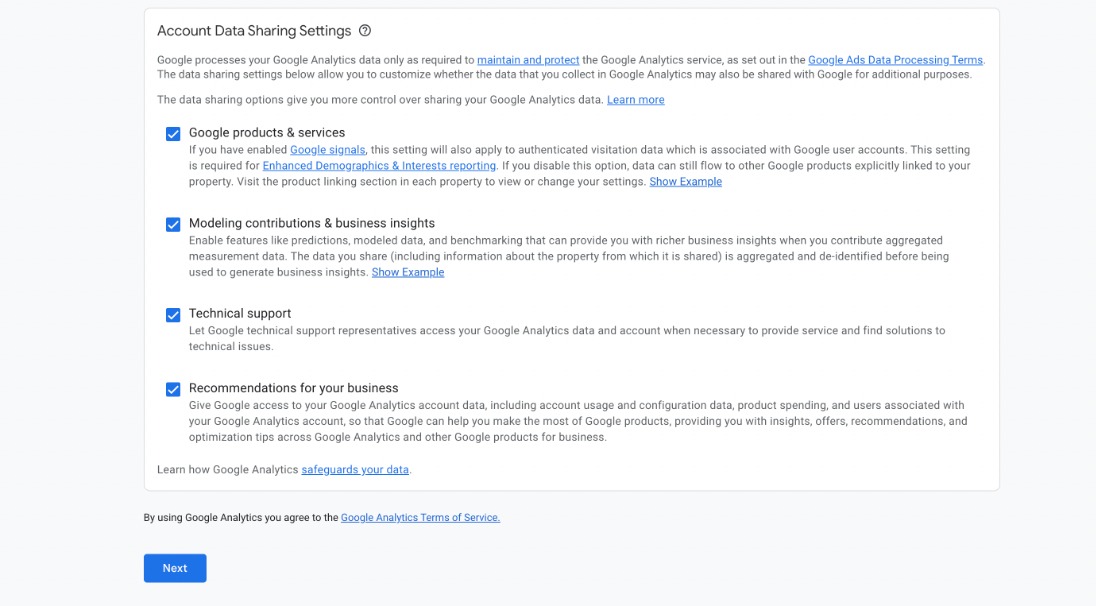
Once done, click on the Next button to proceed further.
2.2 Setting Up a Property in Your Account
After creating your account, the next step is to set up a property within that account. Properties in Google Analytics are the entities (websites, mobile apps, etc.) for which you want to collect data.
In the Create a property section, enter a property name, which can be the name of your website or app.
You’ll also need to select the reporting time zone and the currency you want to use for reporting purposes.
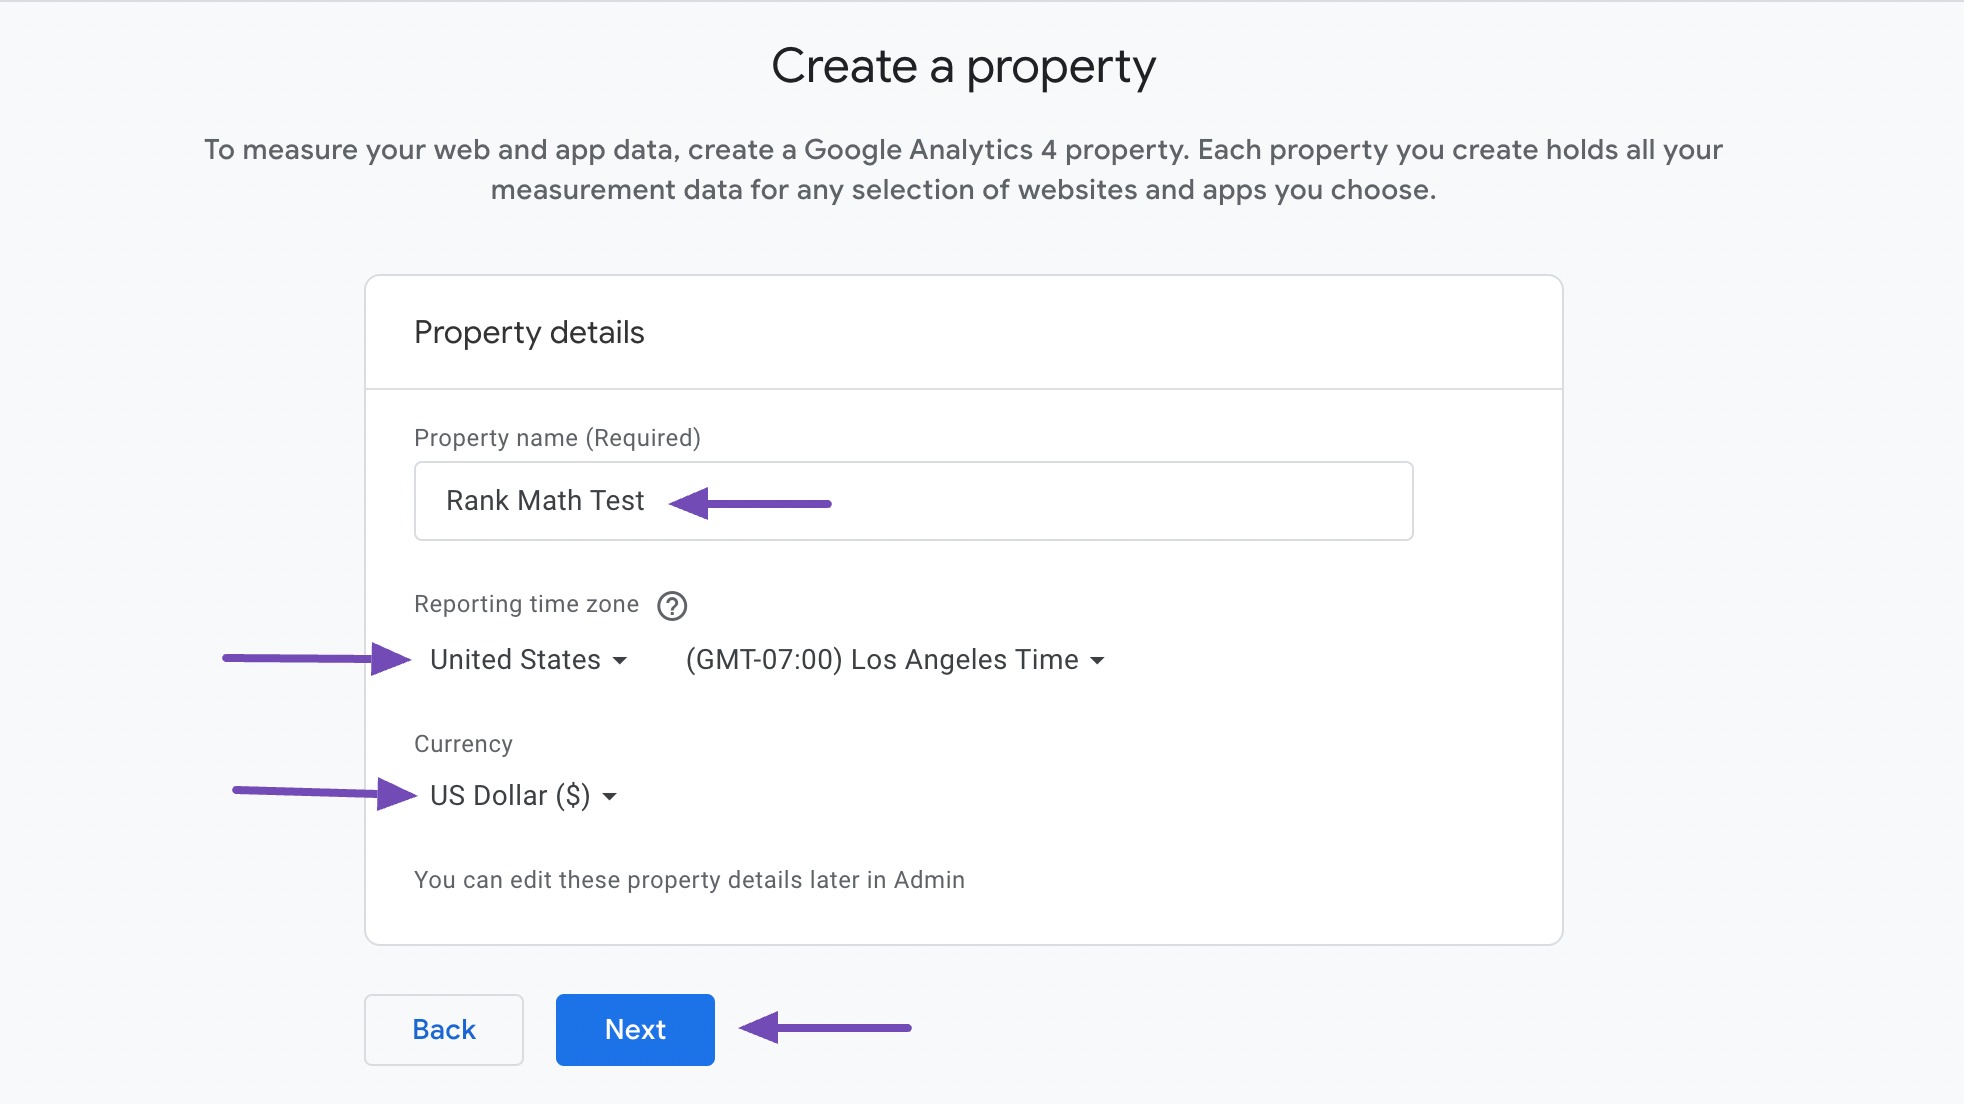
After filling in these details, click Next to proceed.
Google aims to understand your business or website better. Start by selecting the industry that best describes your business. If you don’t find a suitable match, choose the Other Business Activity option.
Then, mention the size of your business. For instance, if you operate the website by yourself, select the 1 to 10 employees option.
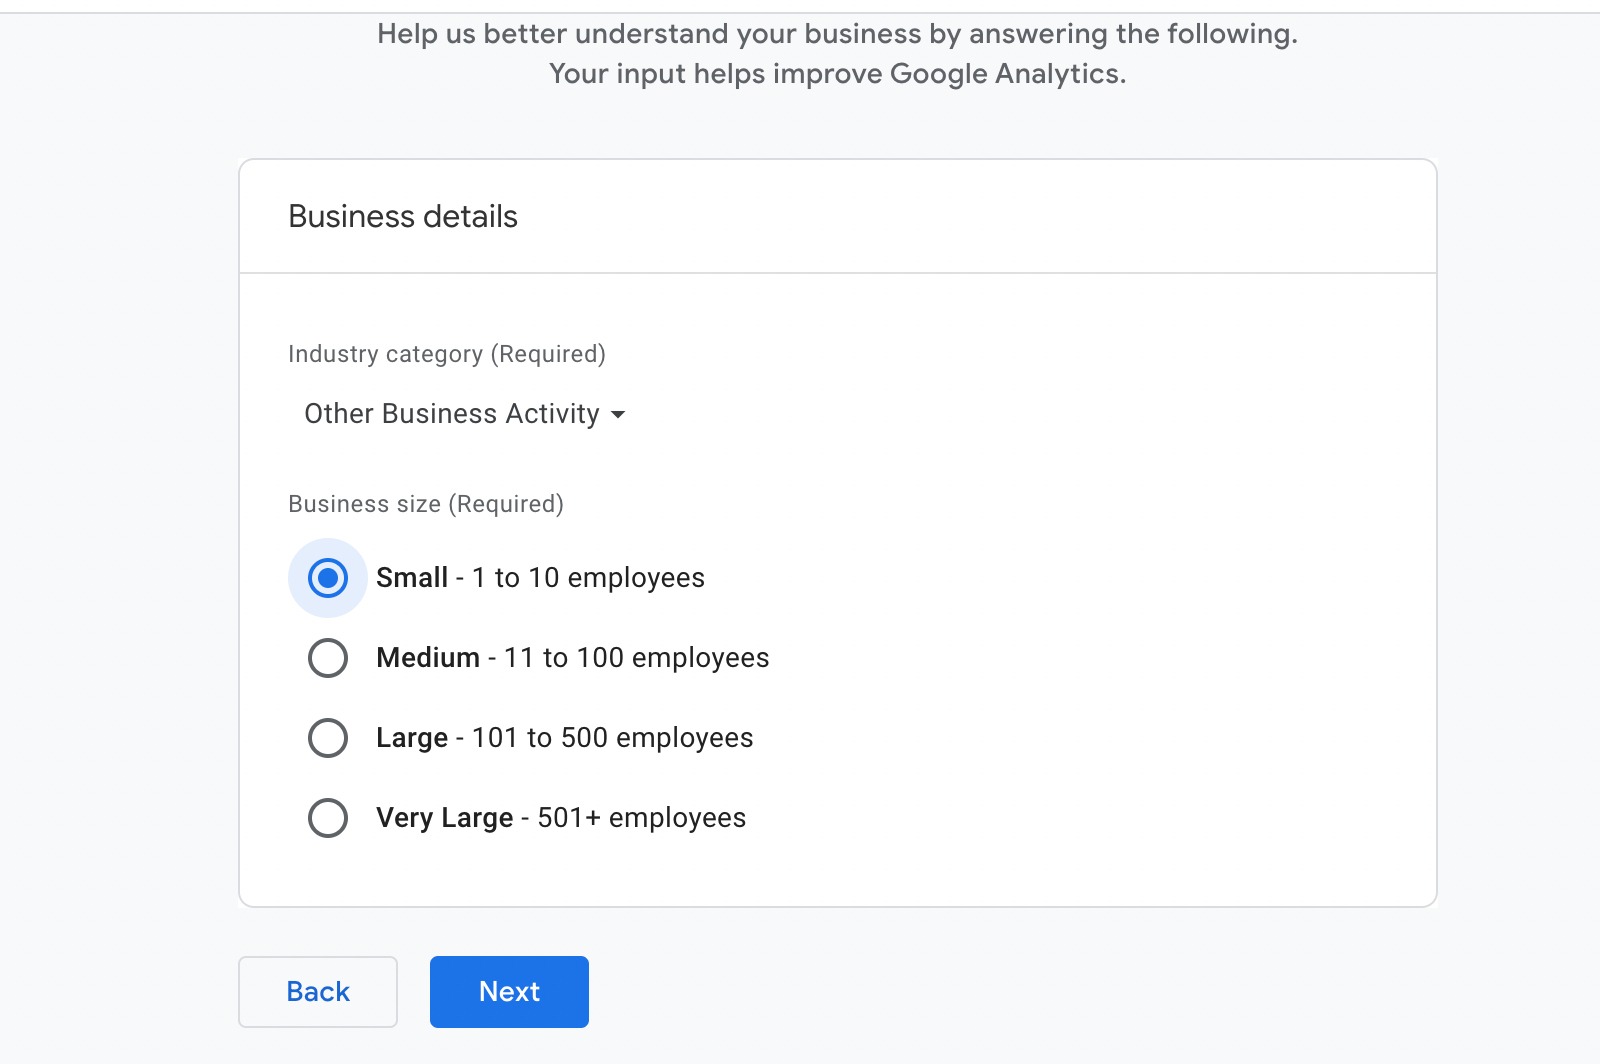
Once done, click on the Next button.
Choosing your business objectives is an important step that helps the platform to meet your specific needs.
Google Analytics provides several predefined business objectives to choose from, which align the tracking and reporting features with your goals.
These objectives might include increasing sales, generating leads, driving website traffic, understanding user behaviour, enhancing user engagement, or improving app downloads.
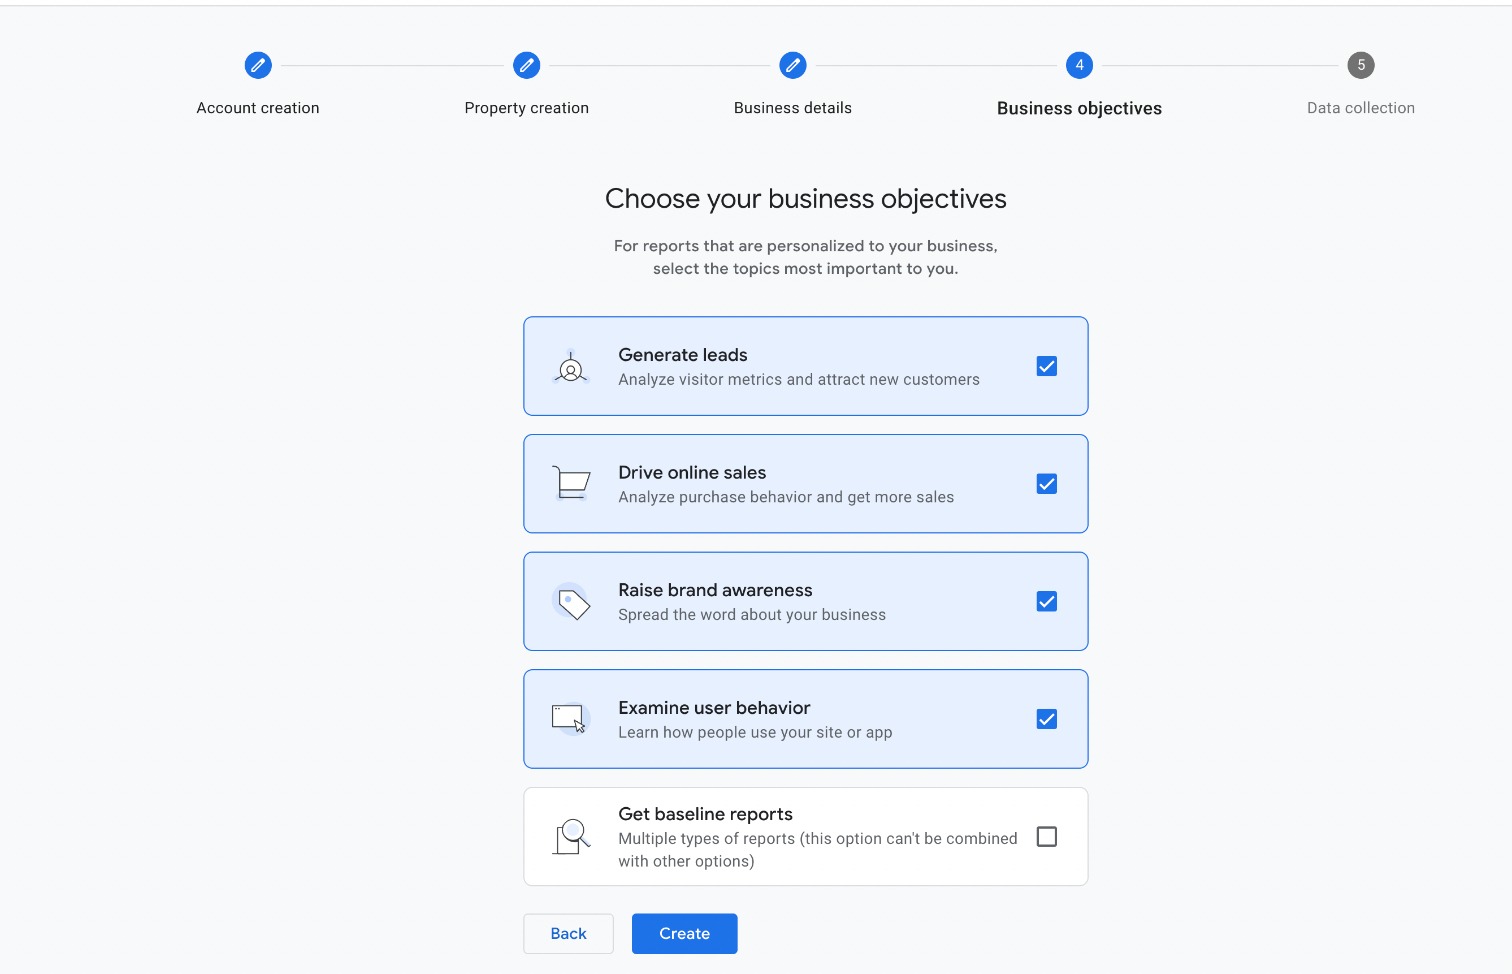
Here are some common business objectives:
- Generate Leads: If your goal is to generate leads, such as through contact forms, newsletter sign-ups, or demo requests, this objective will highlight metrics related to lead generation activities. You can track form submissions, sign-up rates, and the effectiveness of your call-to-action buttons.
- Drive online Sales: For e-commerce websites, this objective focuses on tracking online sales performance. Google Analytics will provide detailed reports on product performance, customer purchase behaviour, and sales trends.
- Raise brand awareness: If you want to understand how your brand is perceived online and how users discover your website, Google Analytics will prioritize reports on website traffic sources and user demographics. It helps you understand where your traffic is coming from (e.g., search engines, social media, referral sites) and how visitors navigate your site.
- Examine user behaviour: If your goal is to gain a deeper understanding of how users interact with your site or app, this objective will focus on behaviour flow, user paths, and interaction events.
- Get baseline reports: If you just need a basic set of reports on website traffic and user behaviour, you can select this option, but it cannot be combined with any other option.
By selecting relevant objectives, Google Analytics prioritizes the data and metrics that matter most to your business, providing insights that directly support your goals. Once selected, click on the Create button.
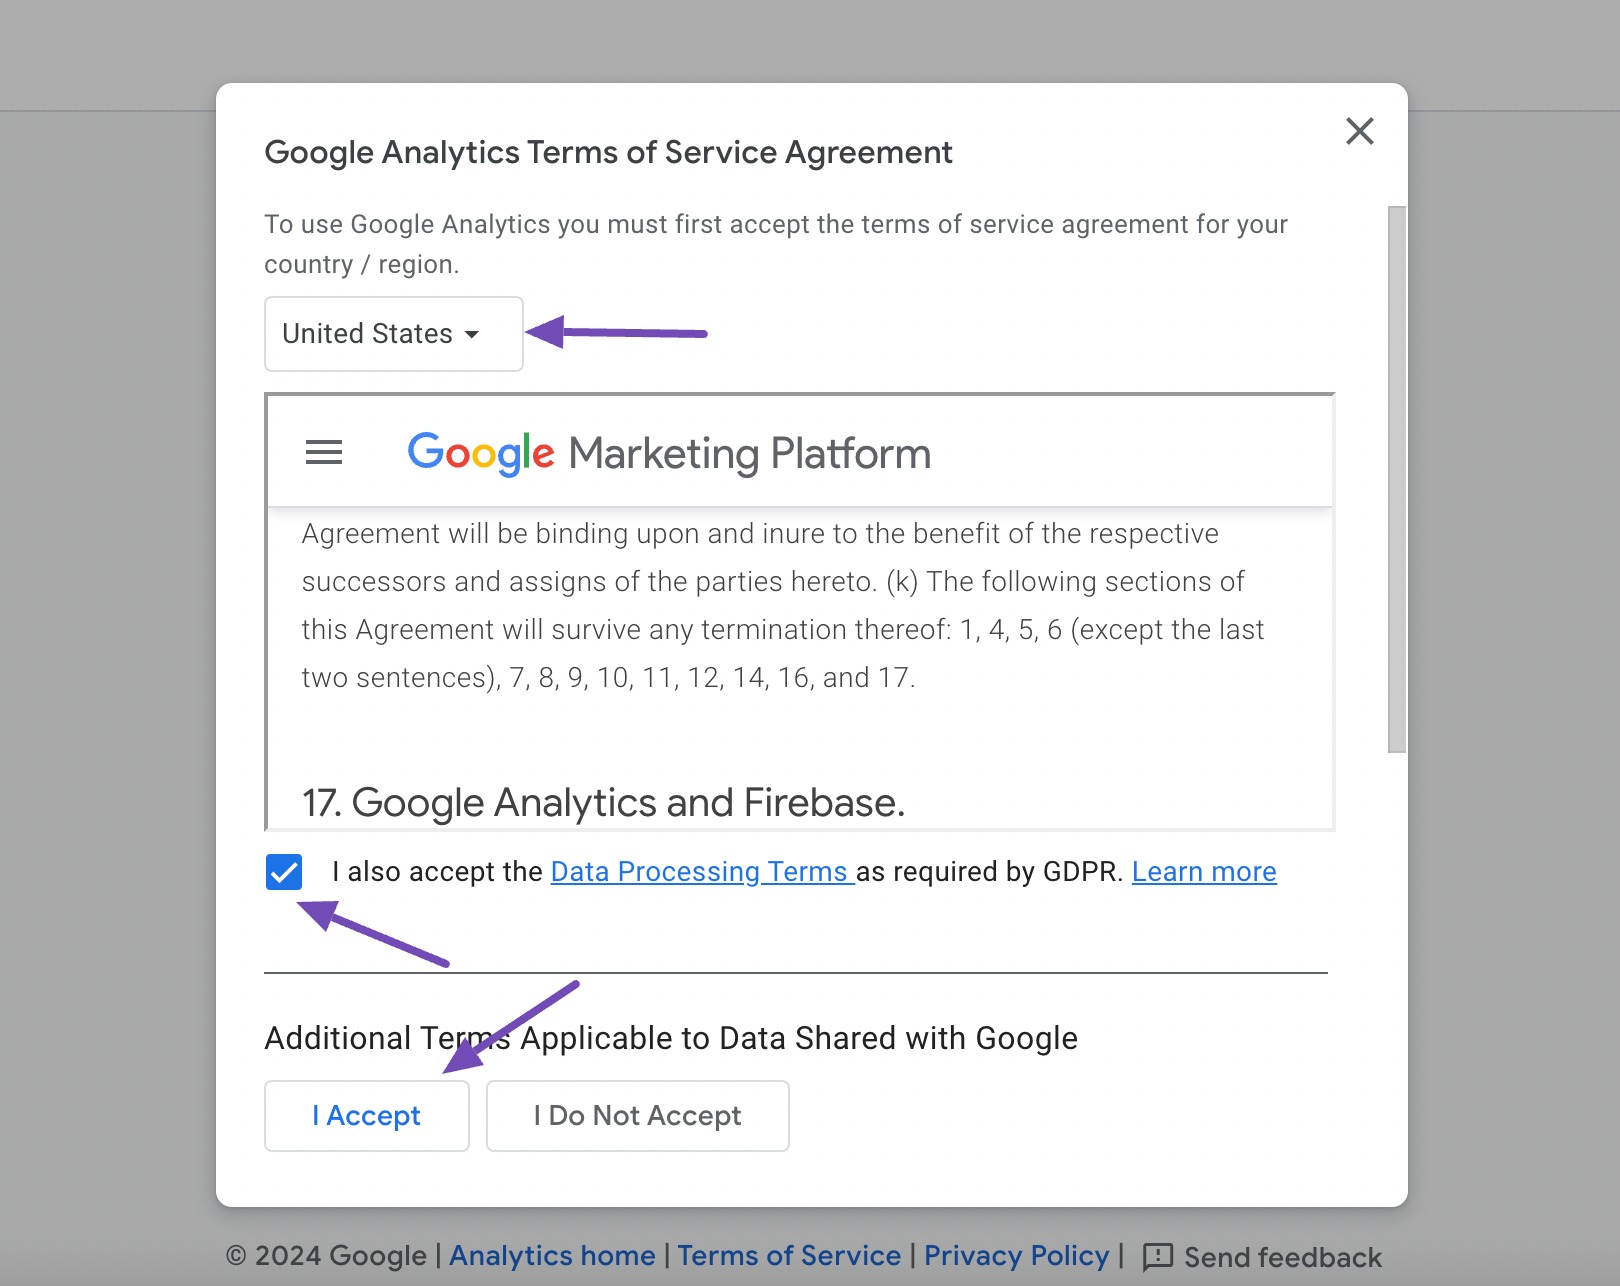
Before using Google Analytics, you must select the country where your business resides and accept its terms of service by checking the two boxes. Click the I Accept checkbox.
And now, the account and property are created.
2.3 Setting Up Data Streams
To ensure comprehensive data collection, you need to set up data streams for each platform you want to track.
You will then specify whether you are setting up Google Analytics for a website, a mobile app, or both.
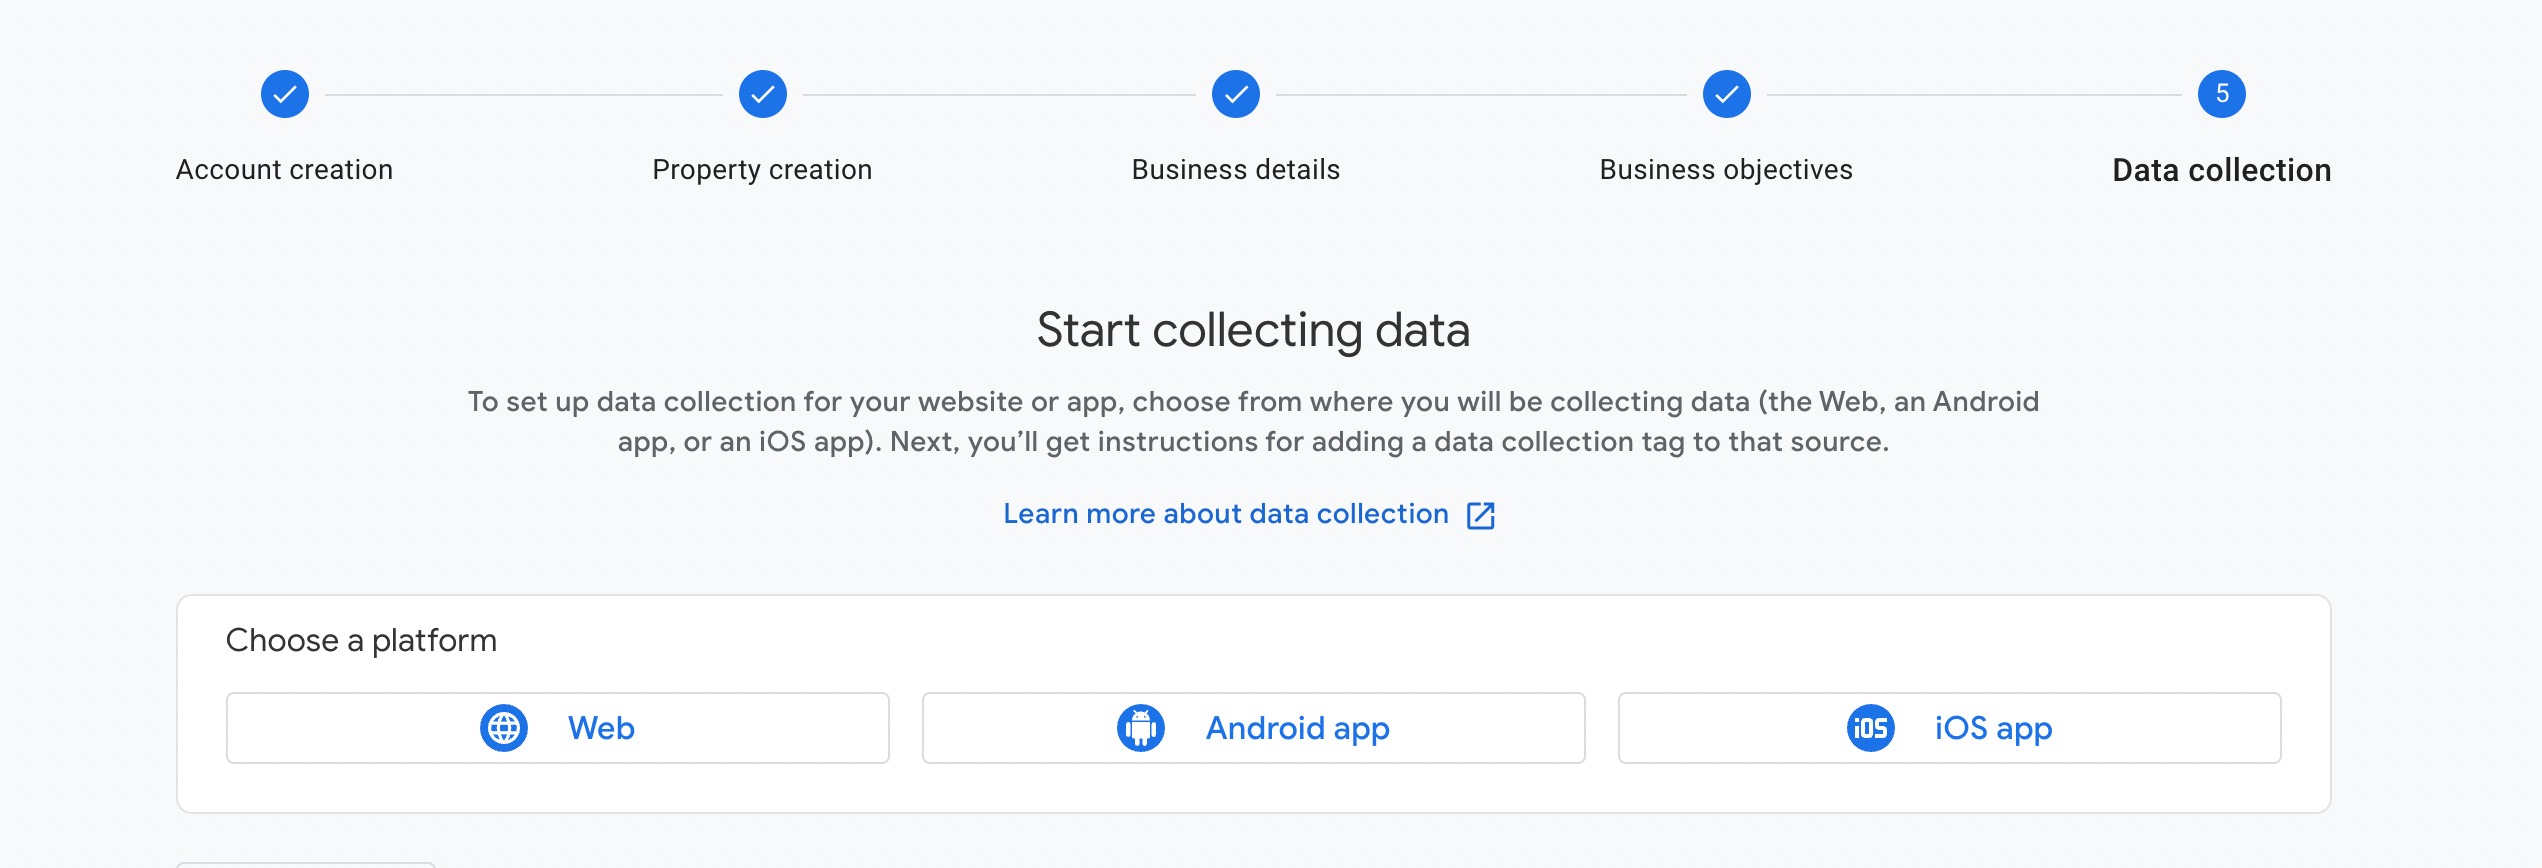
For a website, choose Web, and then enter your website’s URL. Follow the prompts to set up data streams for web, iOS, and Android as needed.
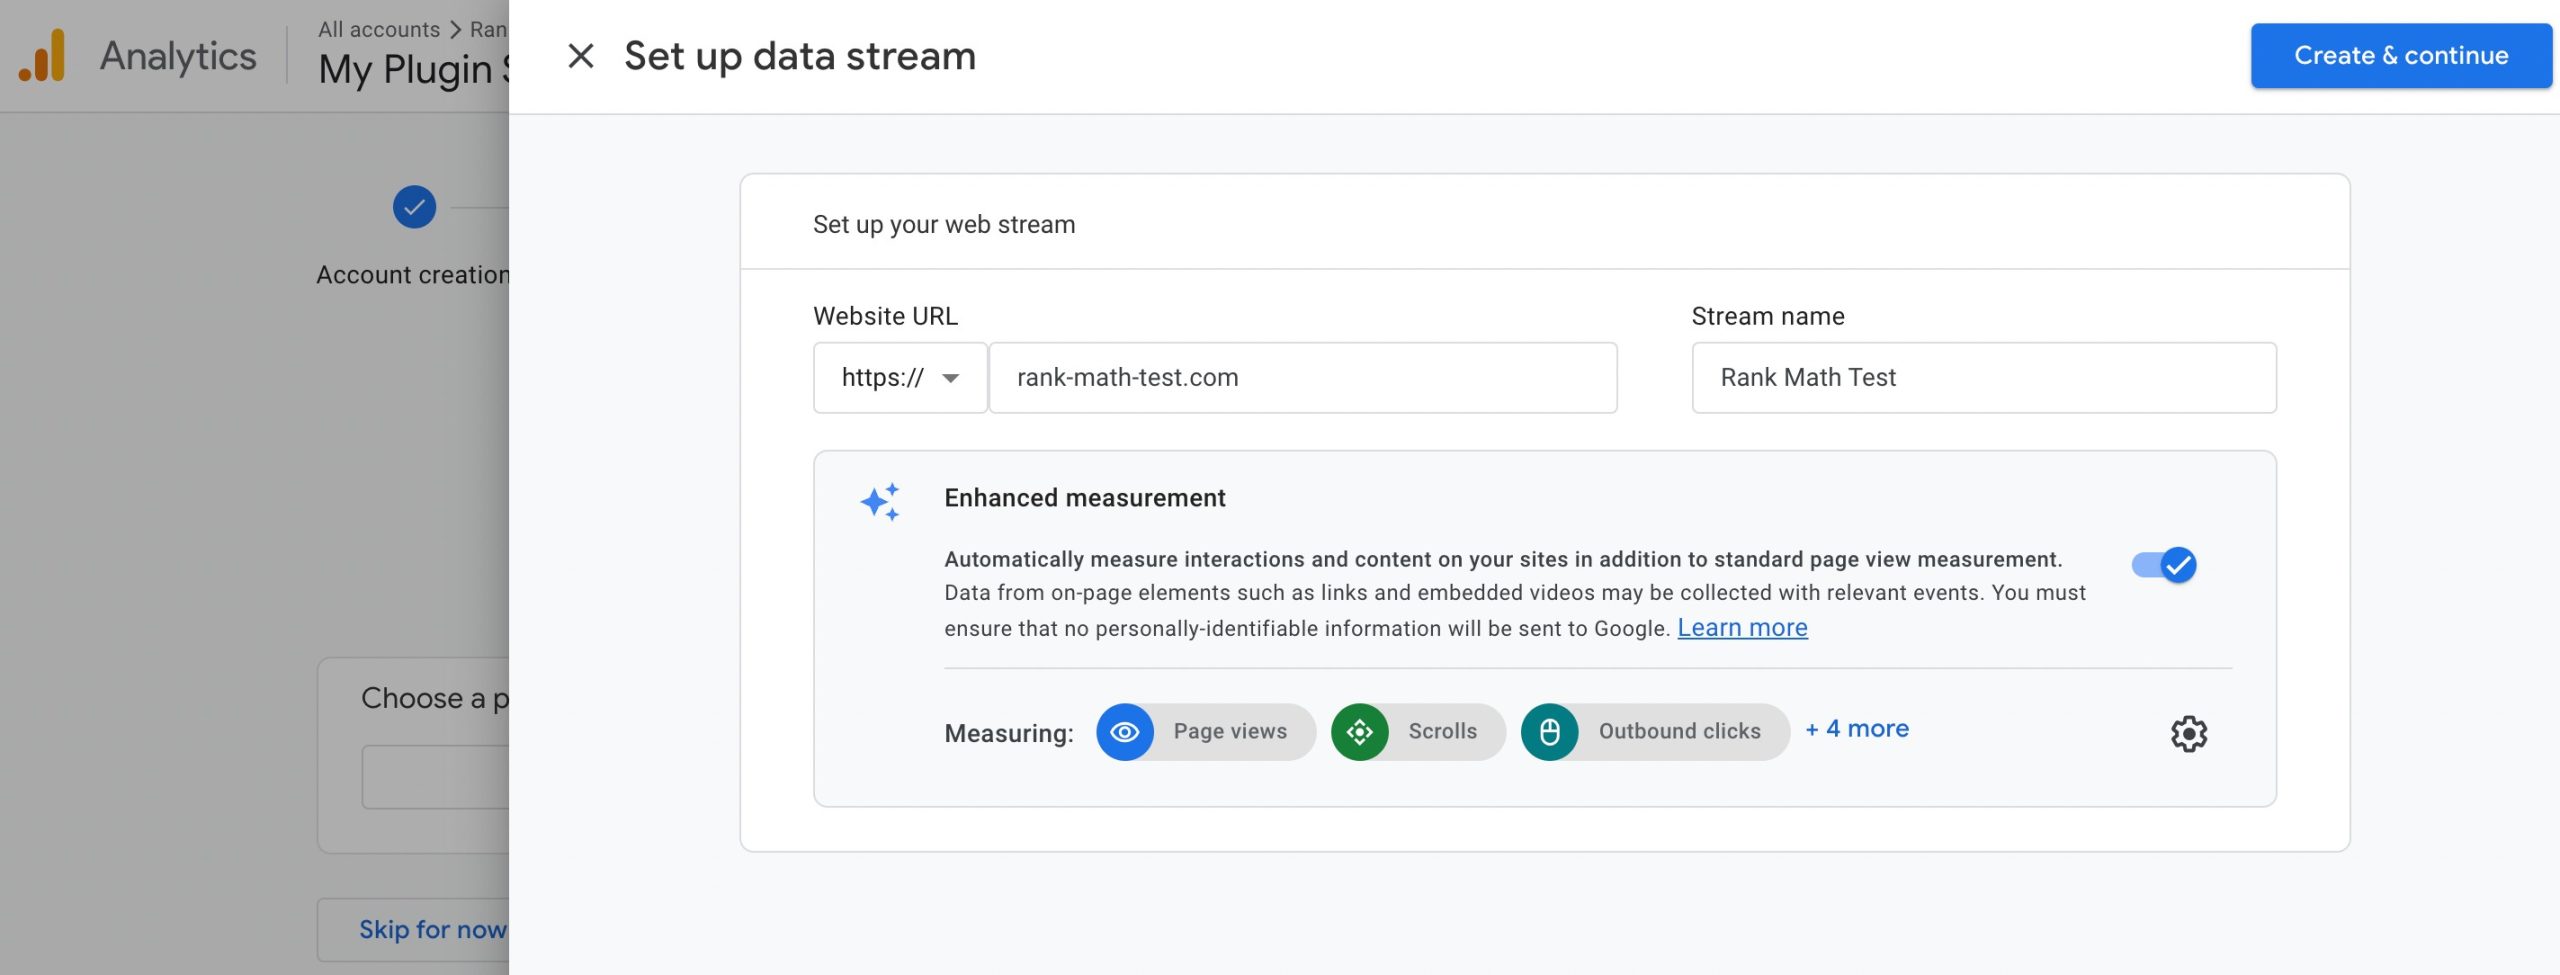
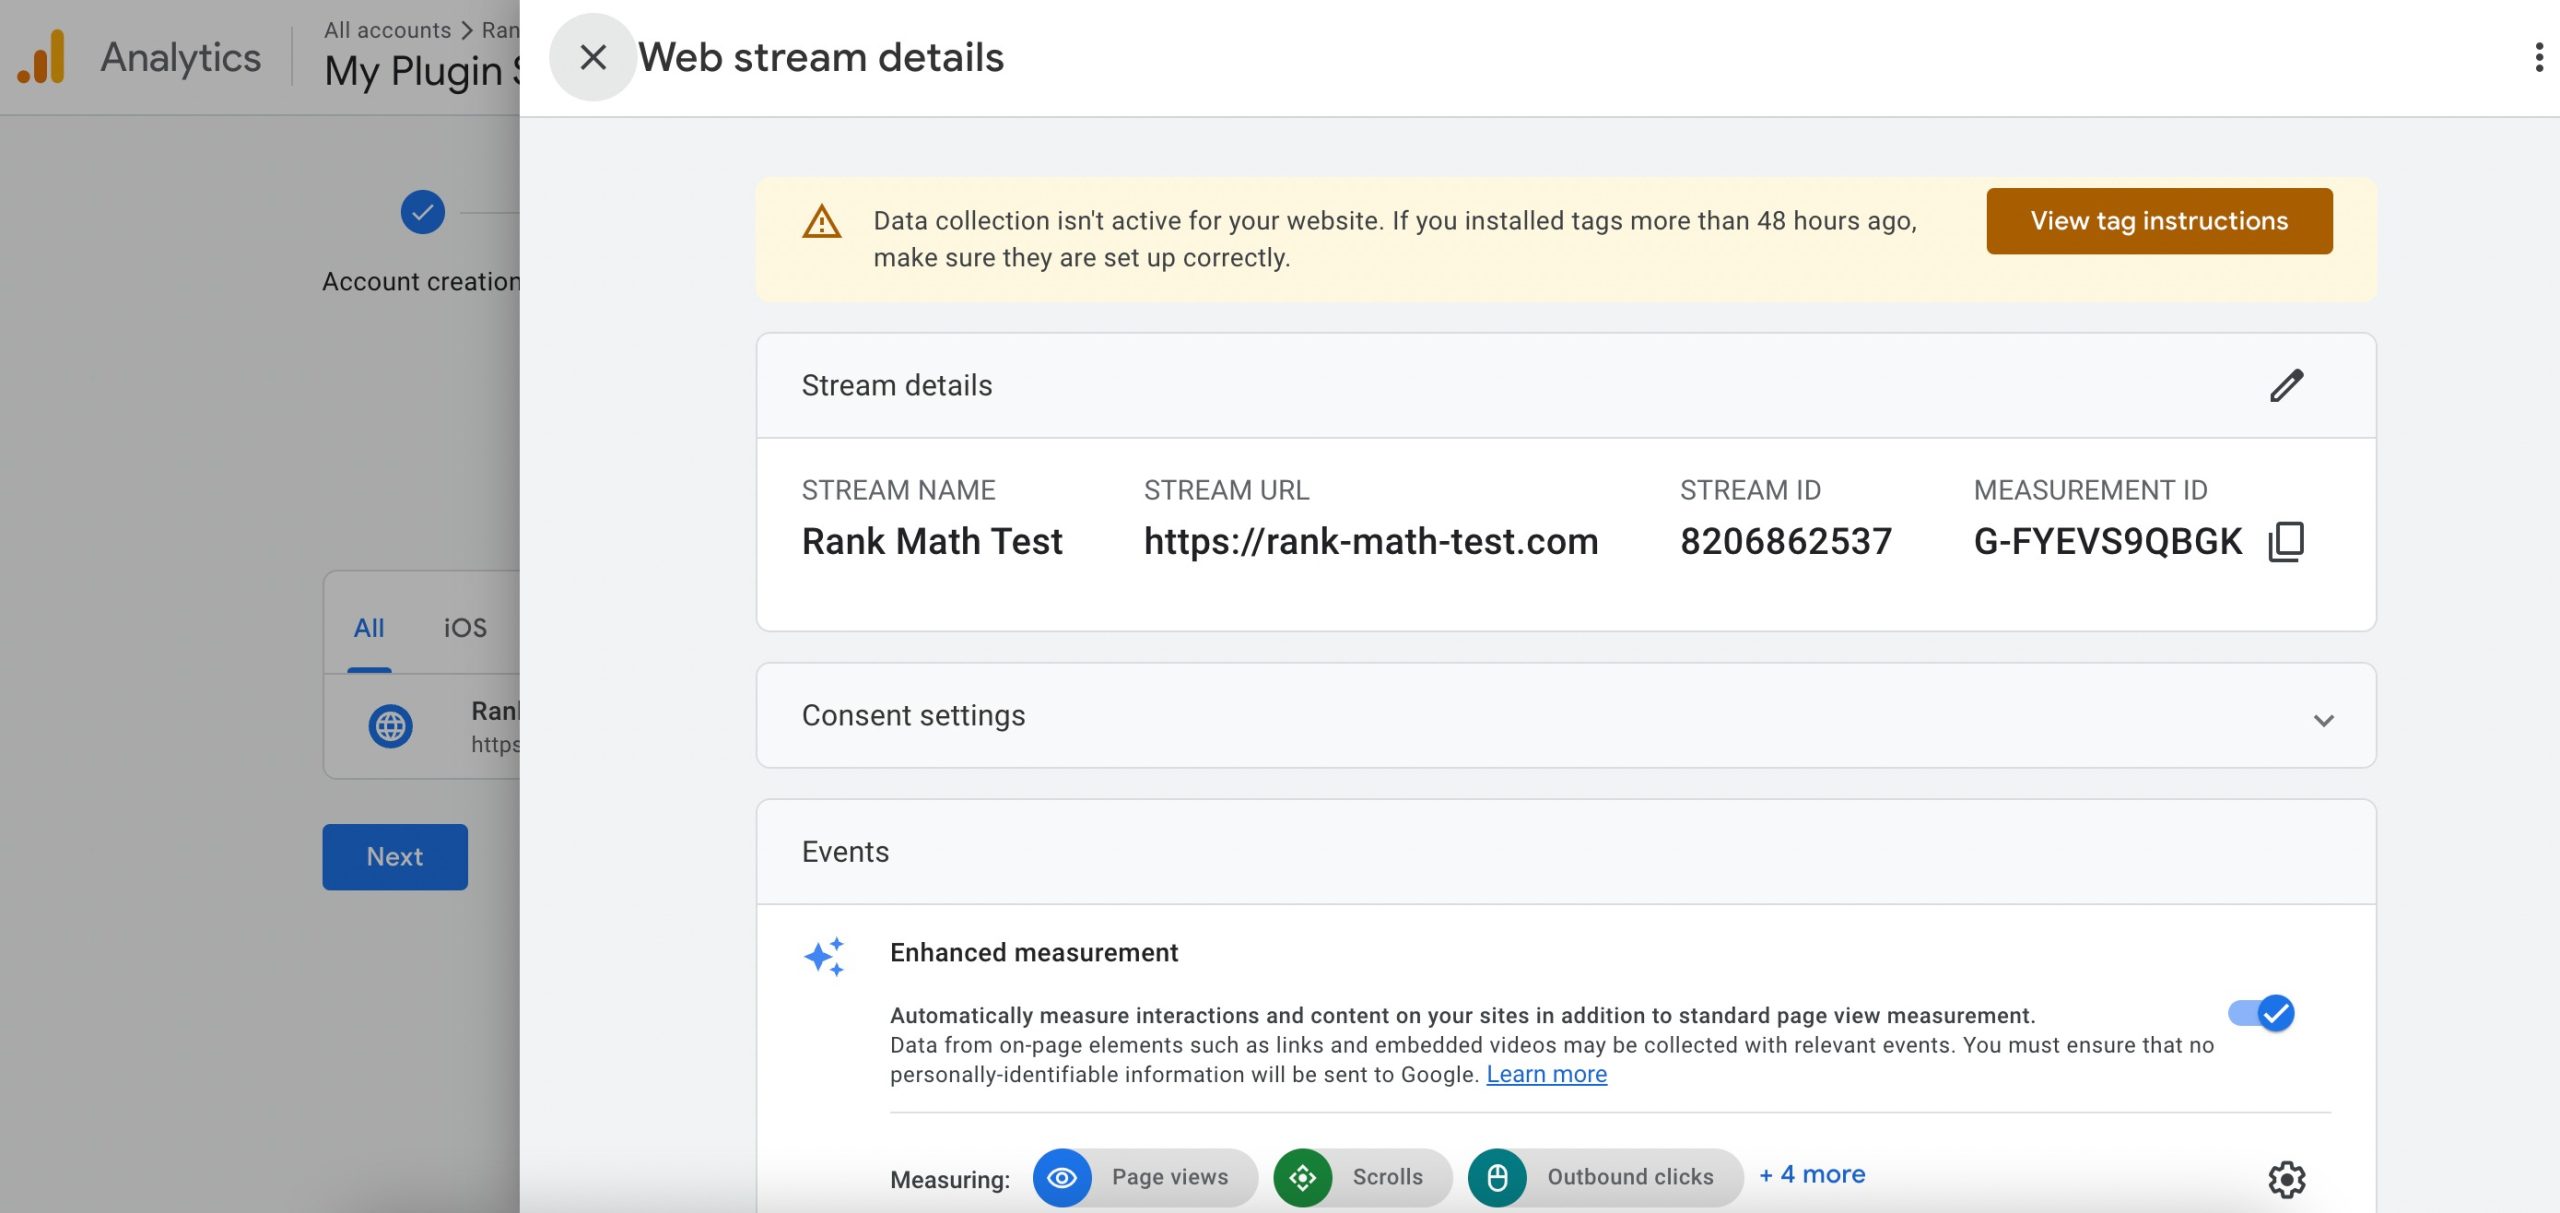
Once done, click on the Create & continue button. The stream will be created.
2.4 Install Google Analytics Code on Your Website
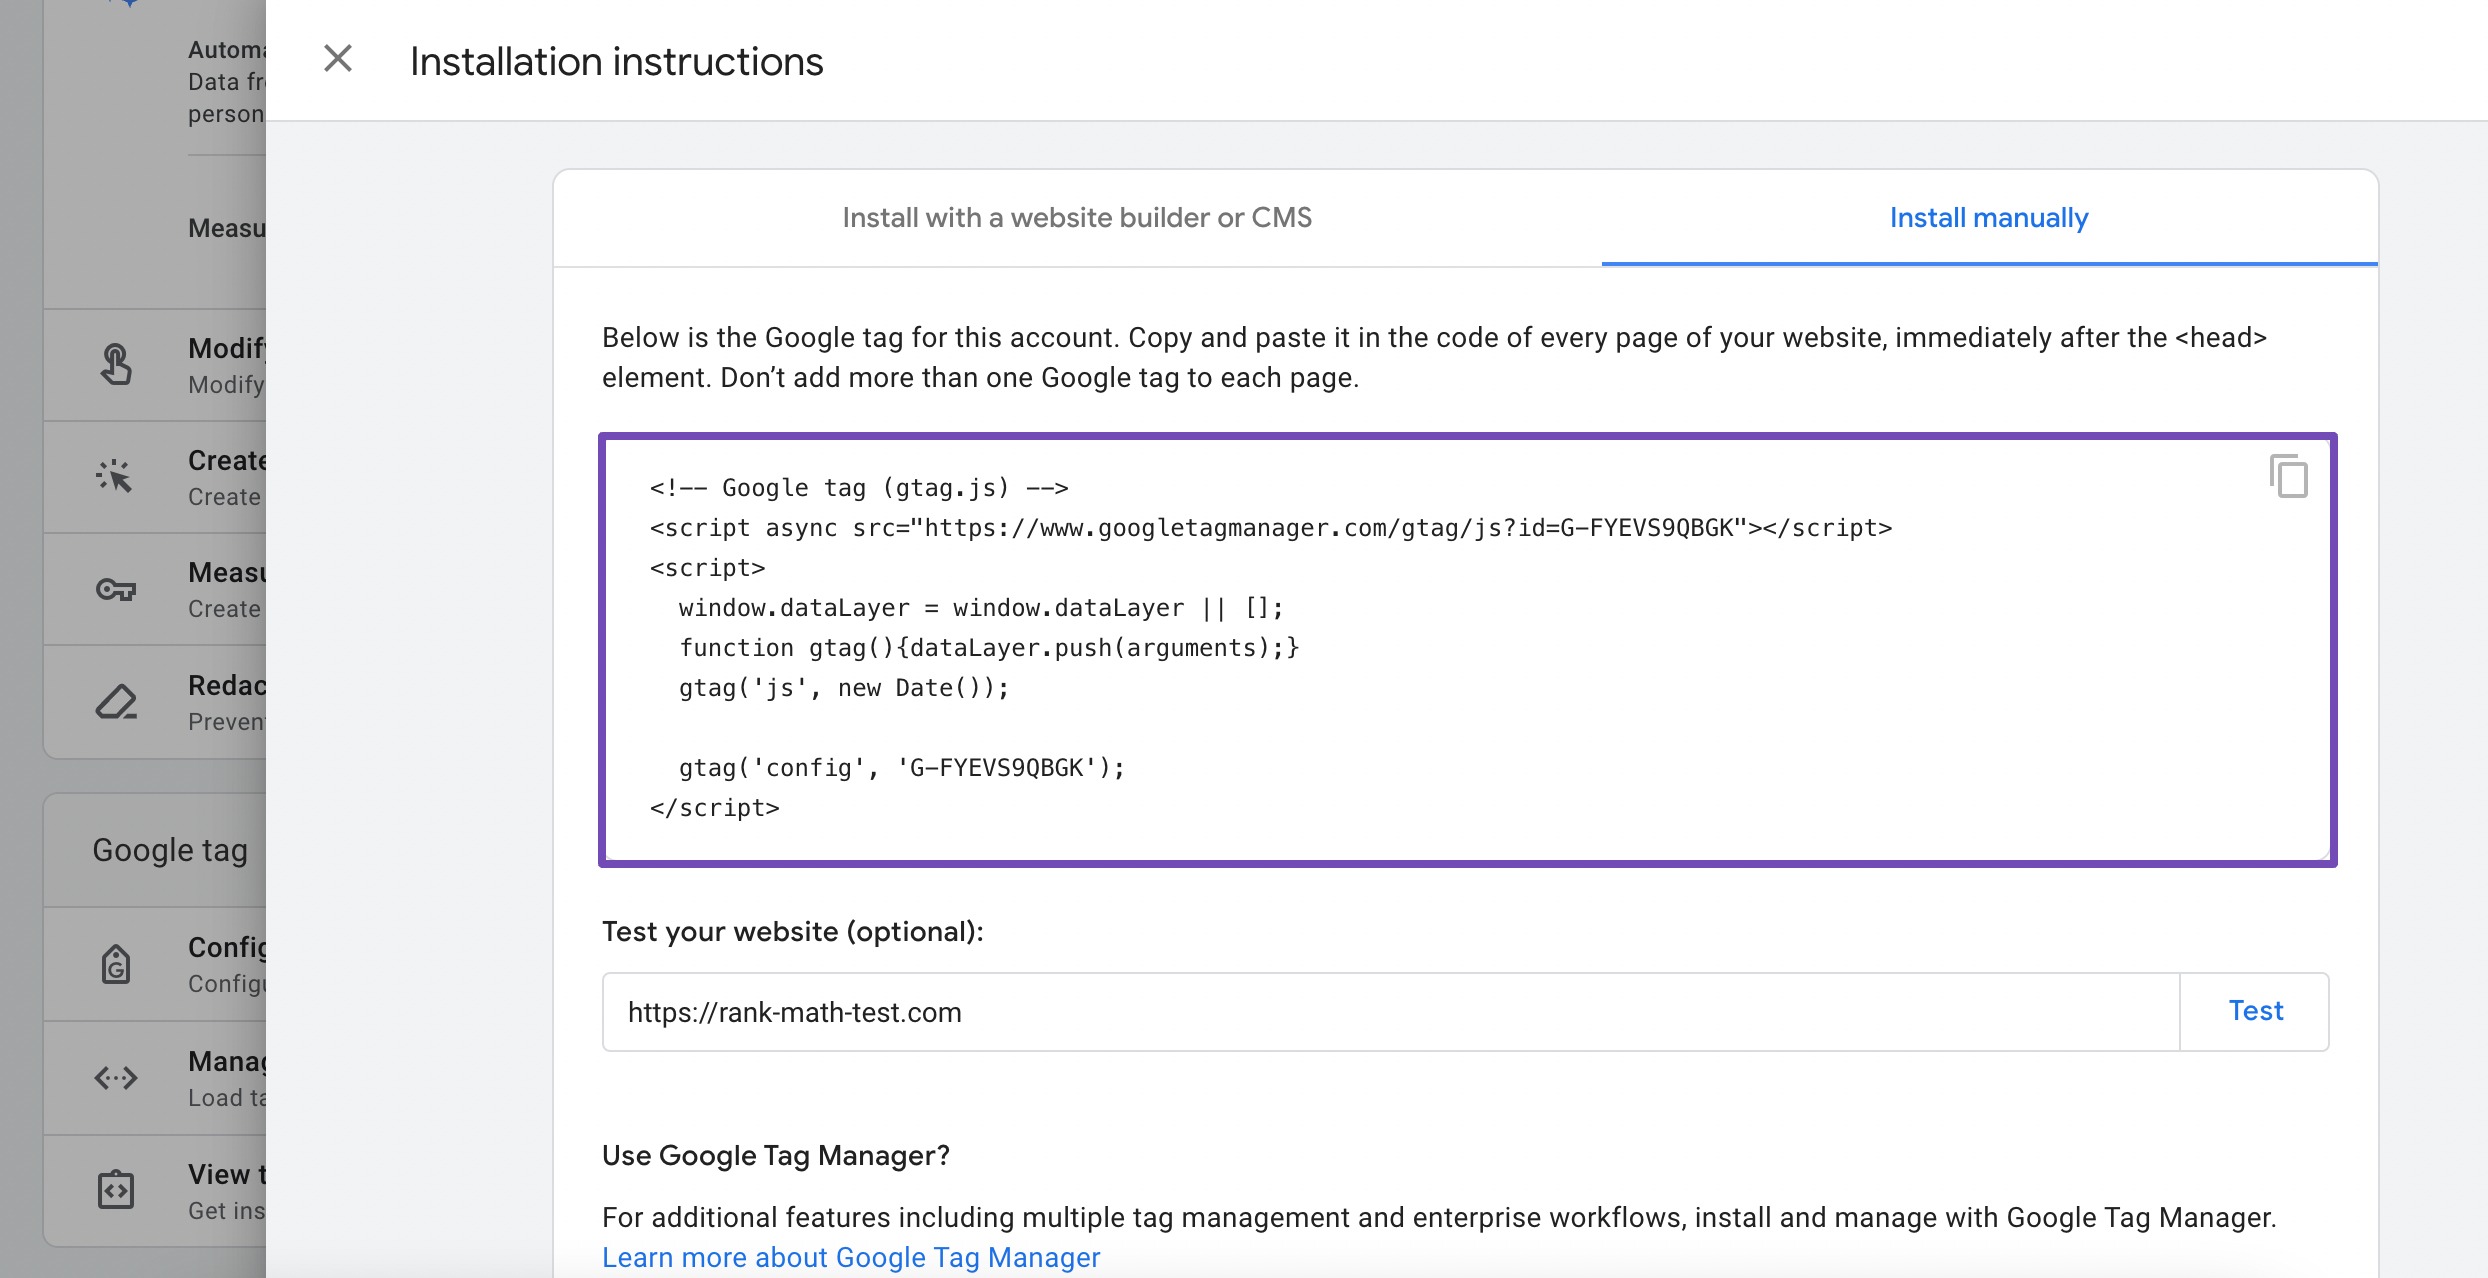
You will receive a tracking ID and a piece of JavaScript code known as the global site tag (gtag.js).
This code needs to be embedded into your website to start collecting data. Copy the global site tag code provided.
You need to paste this code into the HTML of your website, placing it just before the closing </head> tag.
There are two ways to install the Google Analytics code: using the supported platforms or manually.
If you use a content management system (CMS) like WordPress, plugins like Site Kit and WooCommerce simplify this process by allowing you to add the code without directly editing your website’s HTML. If you’re hosting your site on One.com, you can select that option as well.
You can also install Google Analytics using Google Tag Manager.
For other platforms, refer to their specific documentation on how to install the custom JavaScript.
Installing Google Analytics Using Rank Math
There’s a simpler way to install Google Analytics without tinkering with your site’s code or adding extra plugins, especially if you’re already using Rank Math on your site.
At first, navigate to Rank Math SEO → General Settings → Analytics from your WordPress dashboard.
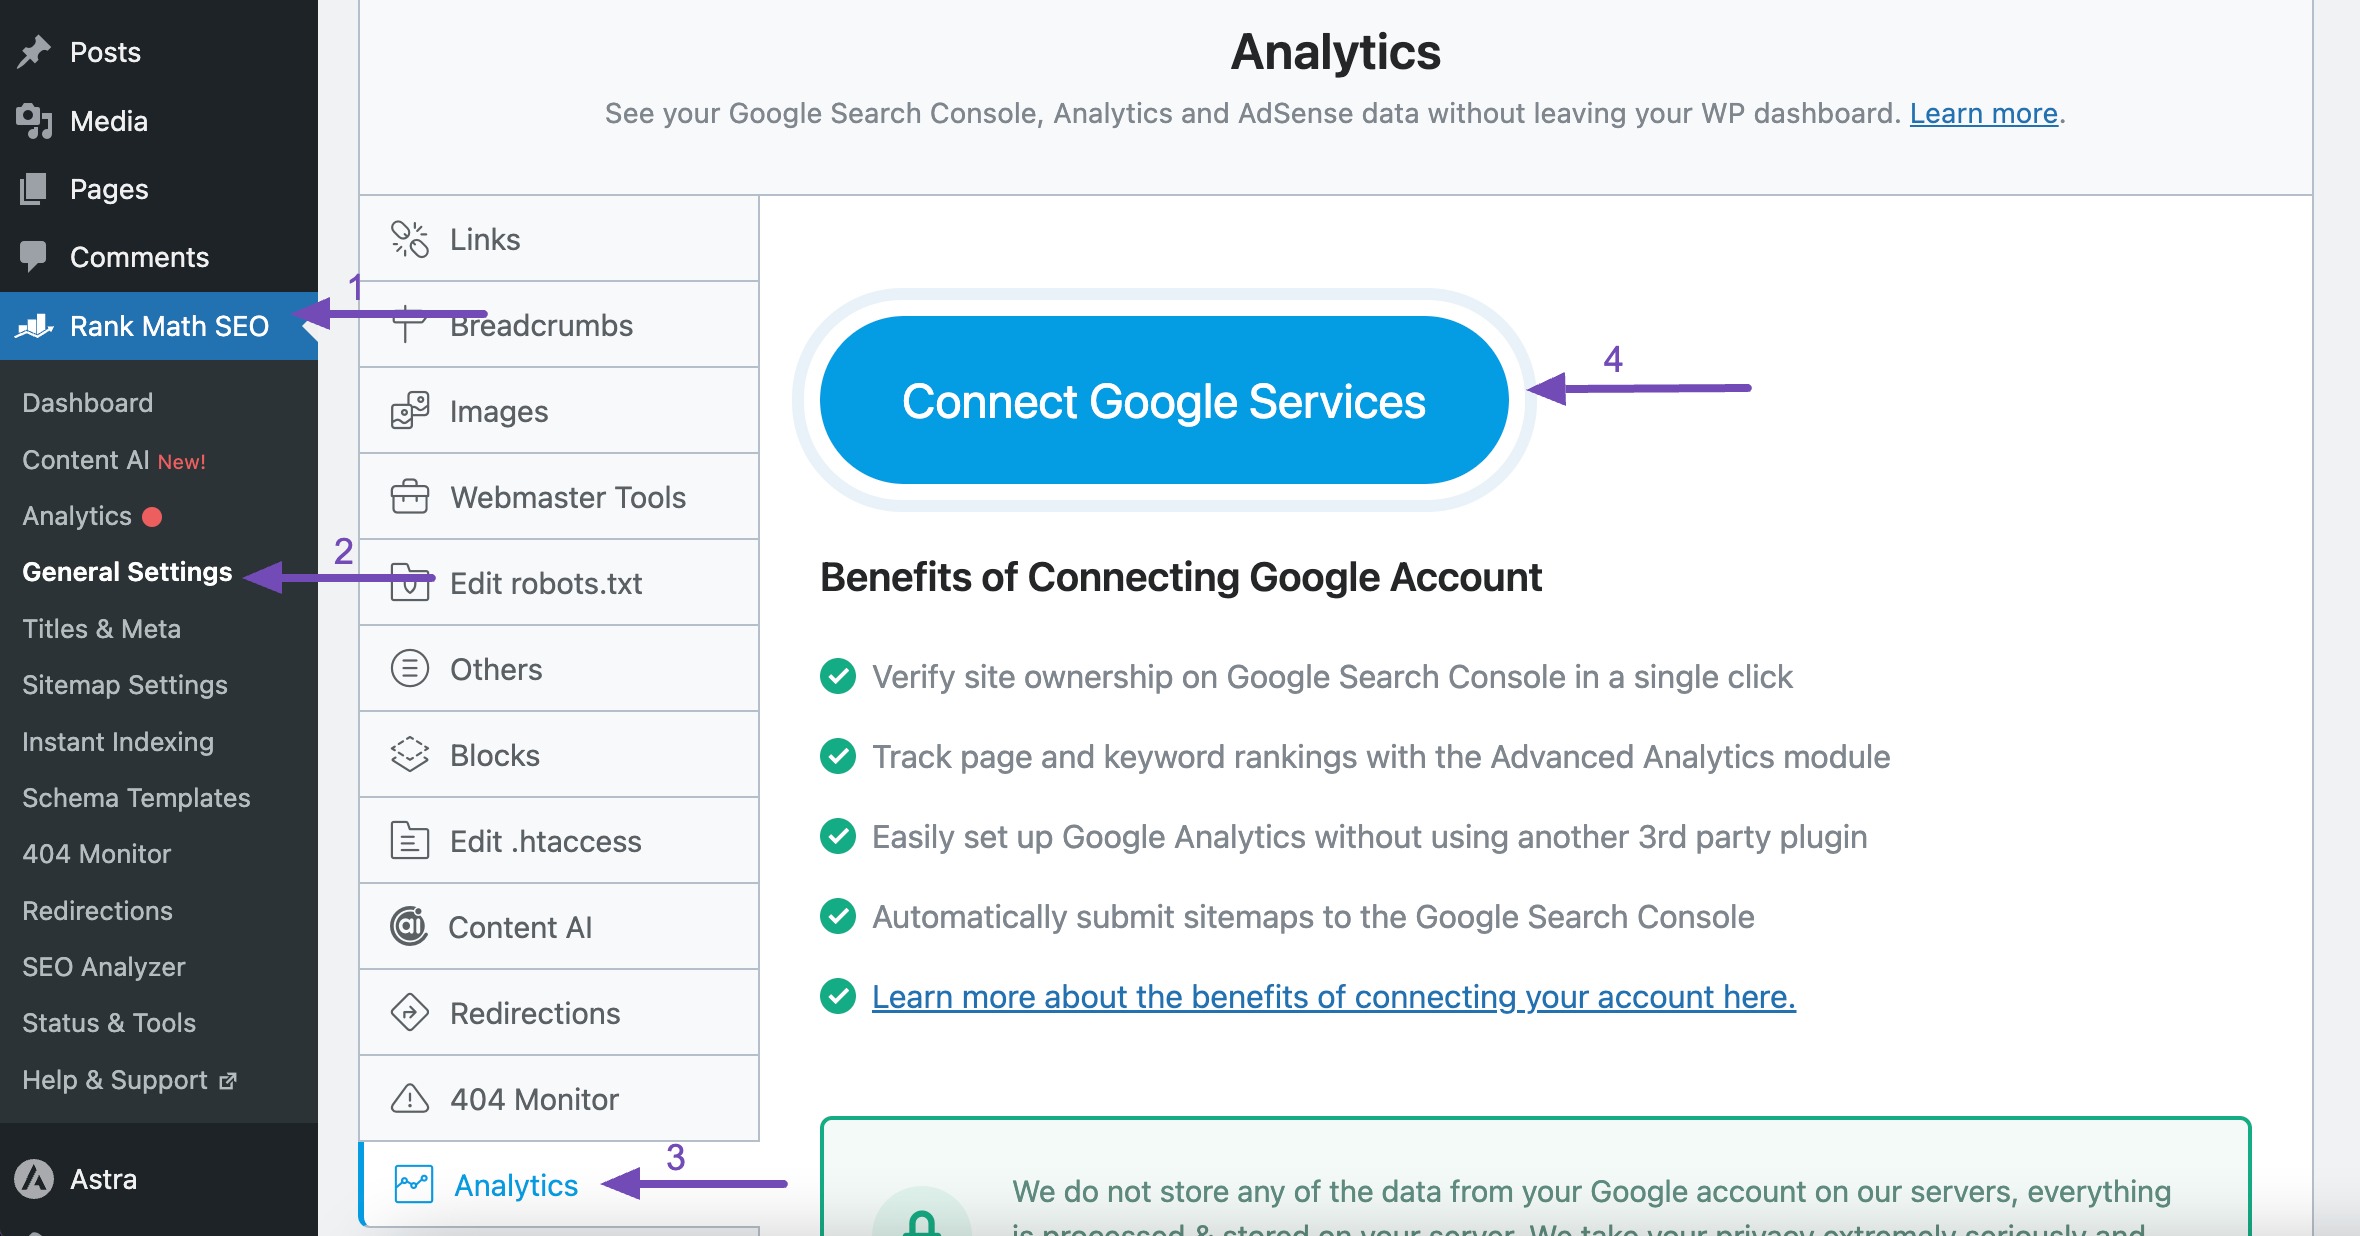
Here, you’ll need to connect your site with Google Analytics. Click on the Connect Google Services button provided and sign in with the Google account where you previously set up your Analytics account.
Review the permissions to ensure Rank Math can function properly.
It’s worth noting that Rank Math doesn’t store any data; it simply collects information from your Google account and stores it on your server to protect your privacy.

After granting permission, your Search Console will be connected to your site. This includes the account, property, and data stream you previously created. You can also create new properties if needed.
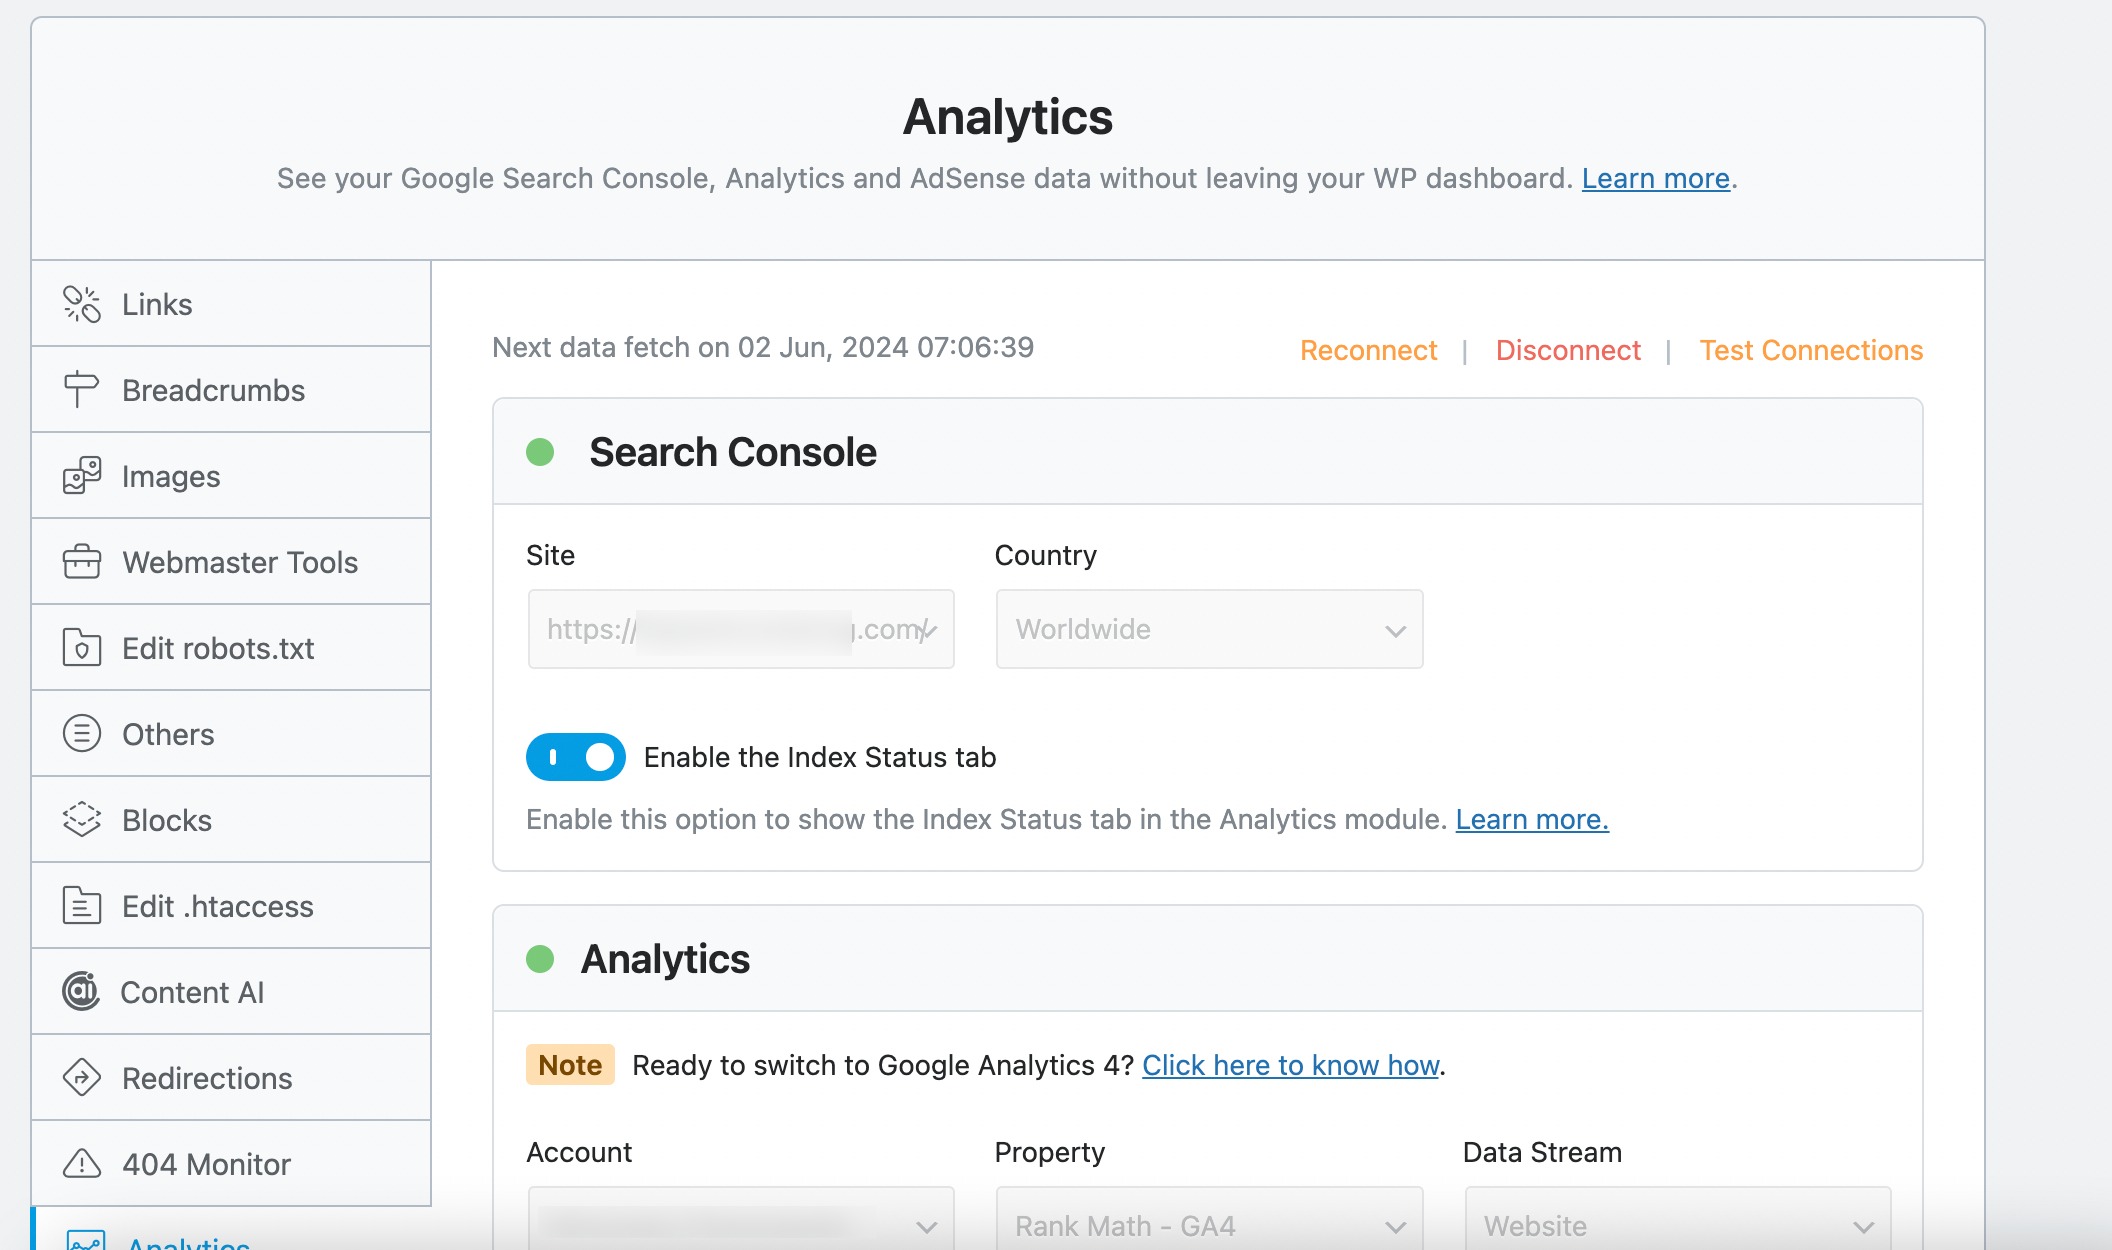
Rank Math can automatically add the Analytics code for you. Ensure you’ve enabled the Install Analytics Code option and save your changes, as shown below.
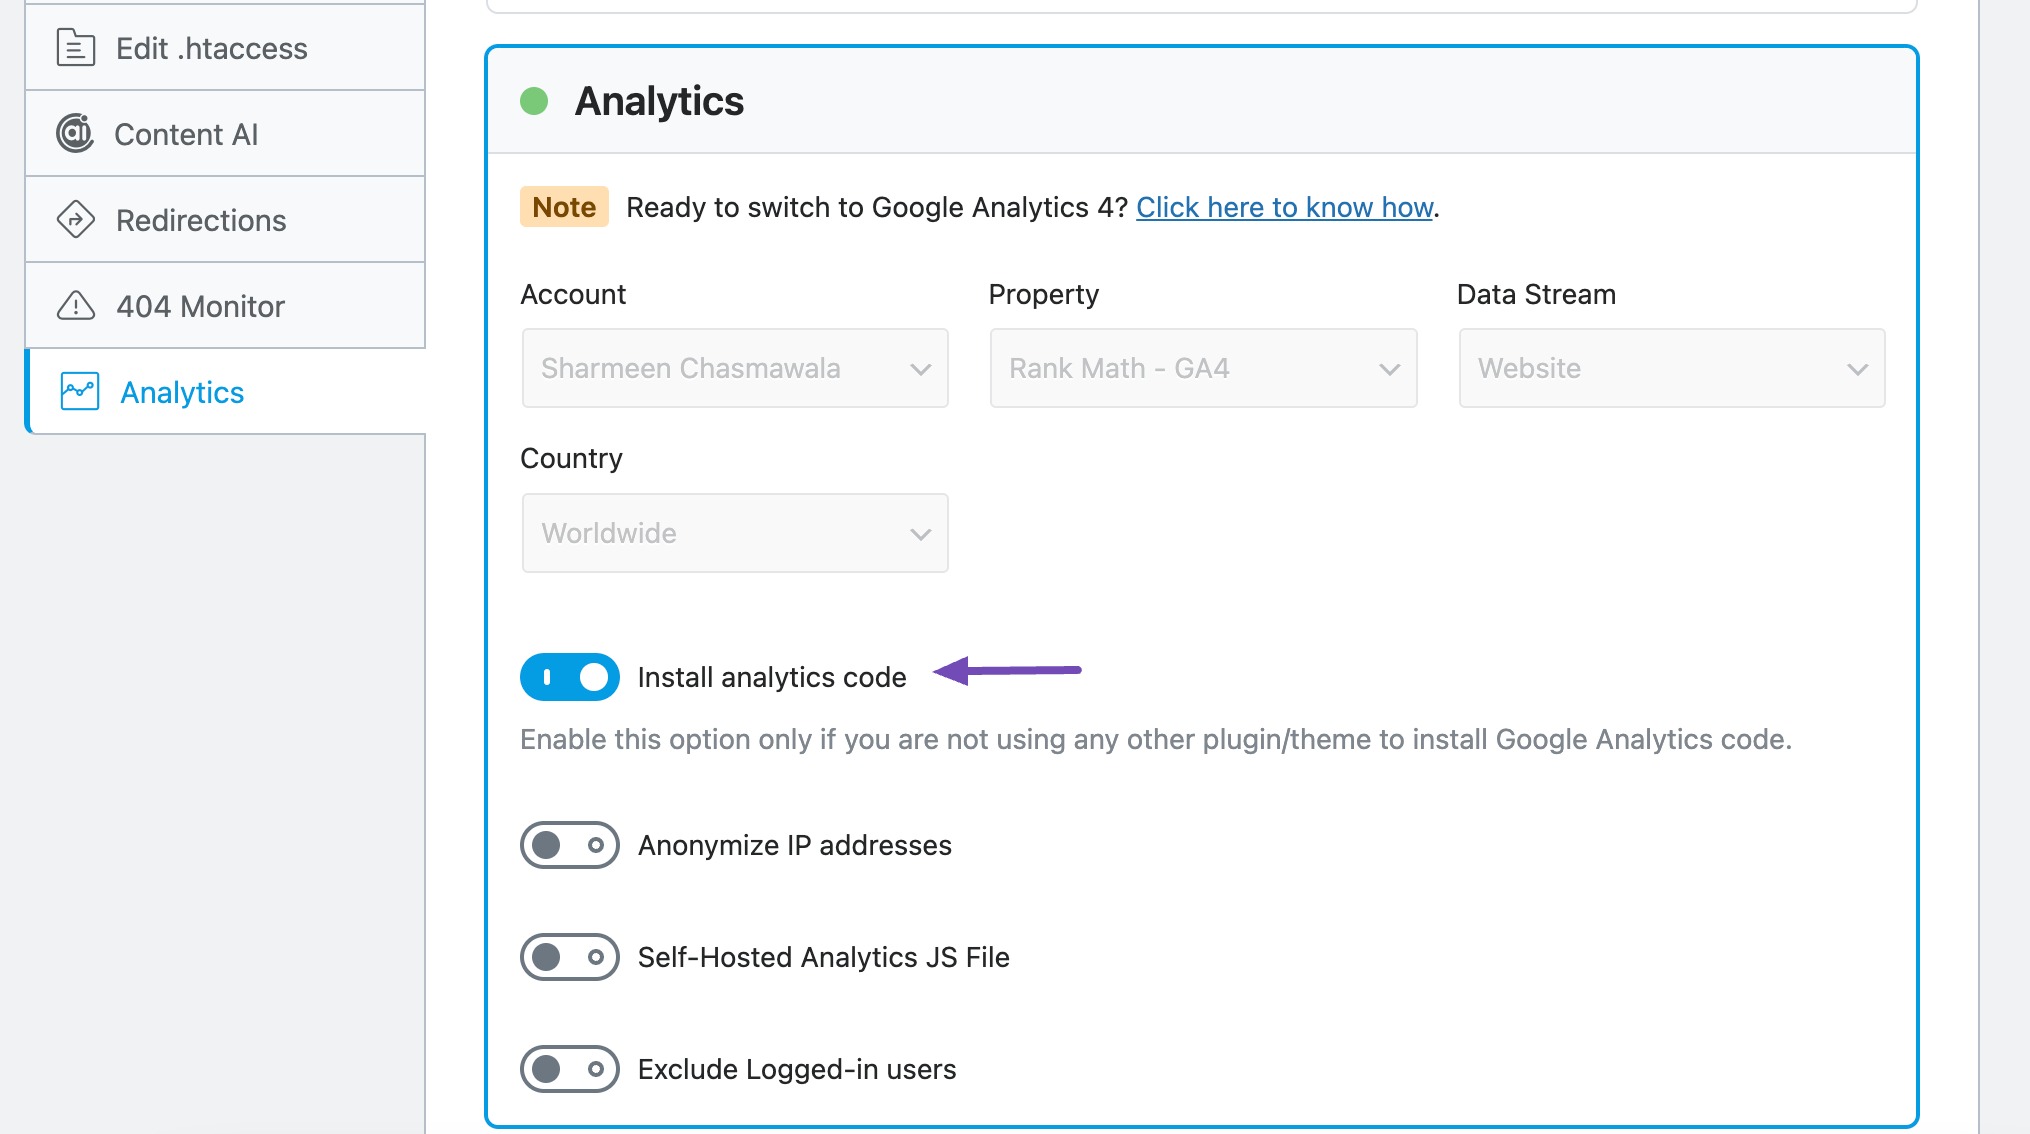
If you’re using Rank Math PRO, you gain additional features like anonymizing IP addresses, self-hosting Analytics JS files for faster website loading, and excluding logged-in users from Analytics data to ensure accuracy.
Refer to our dedicated tutorial on installing Google Analytics with Rank Math SEO for detailed instructions.
Manually Installing Google Analytics
Manually installing Google Analytics involves adding a tracking code to your website’s HTML.
The tracking code needs to be added to every website page where you want to track user activity. Ideally, it should be placed in the <head> section of your HTML.
Copy the tracking code available in the installation process.
If you are using WordPress, you can manually add the tracking code by editing your theme’s header.php file.
In your WordPress admin panel, navigate to Appearance → Theme File Editor → header.php file.
Locate the closing </head> tag and paste the tracking code just before it. You can also place the code just after the opening <head> tag, but not in between any code.
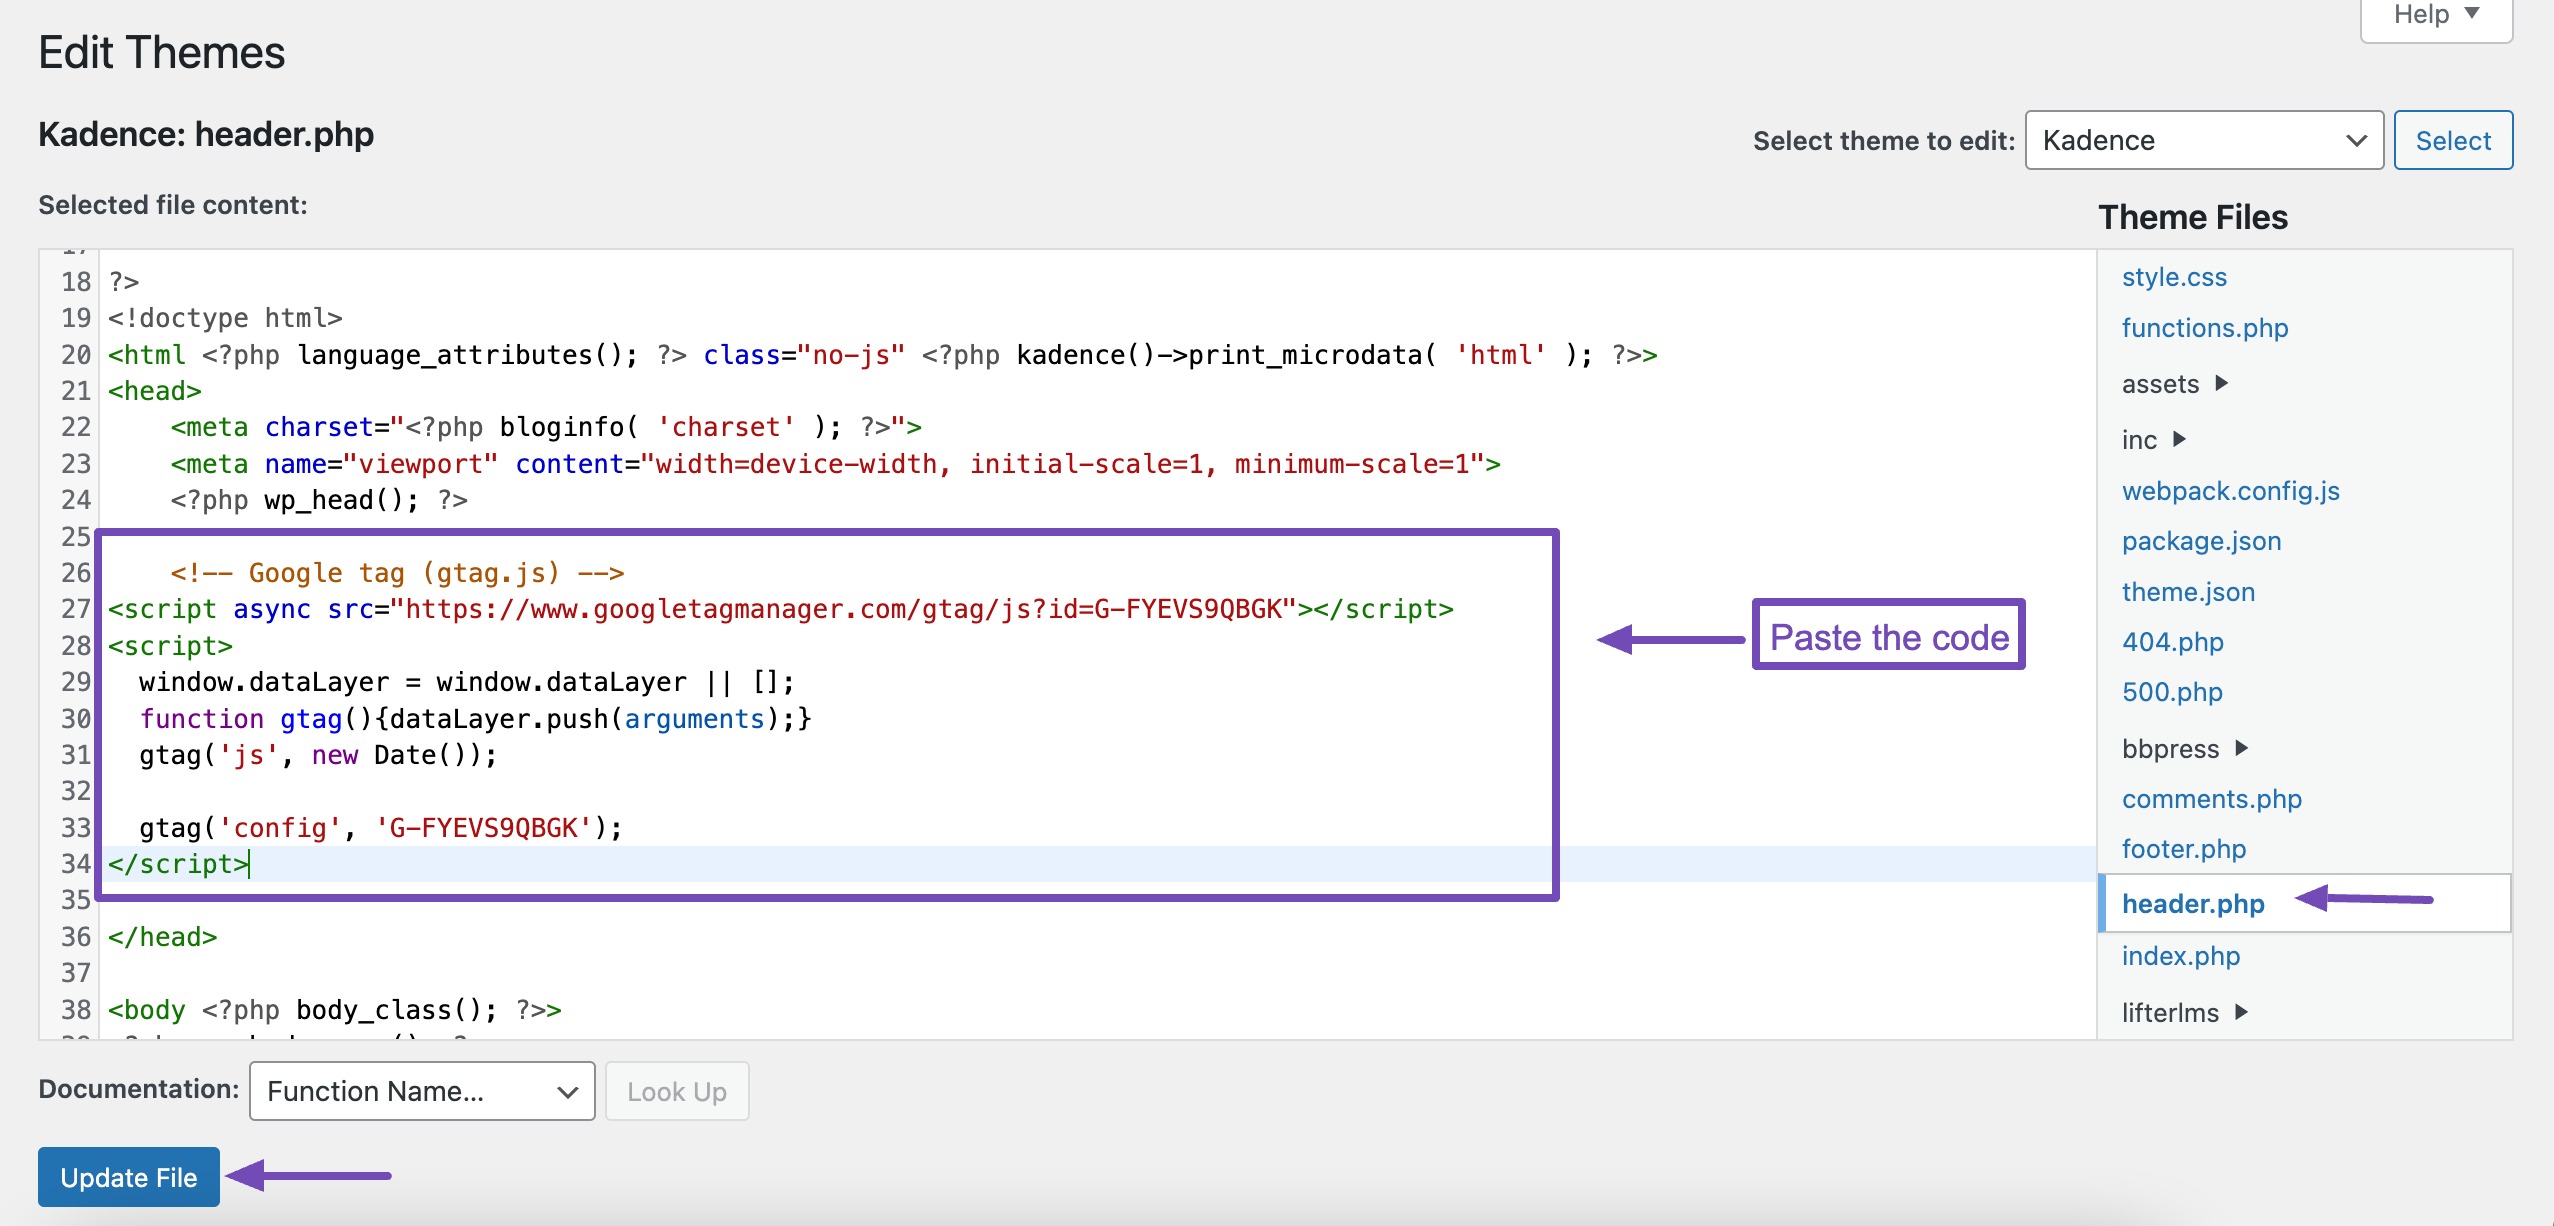
Click on the Update File button to save your changes.
Please ensure you add this using your child theme so that the next theme update won’t wipe it off, or use a code snippet plugin instead.
After adding the tracking code to your website, it’s important to verify that it’s working correctly.
3 Google Analytics User Interface
Let us now discuss the Google Analytics interface to make the most of its features.
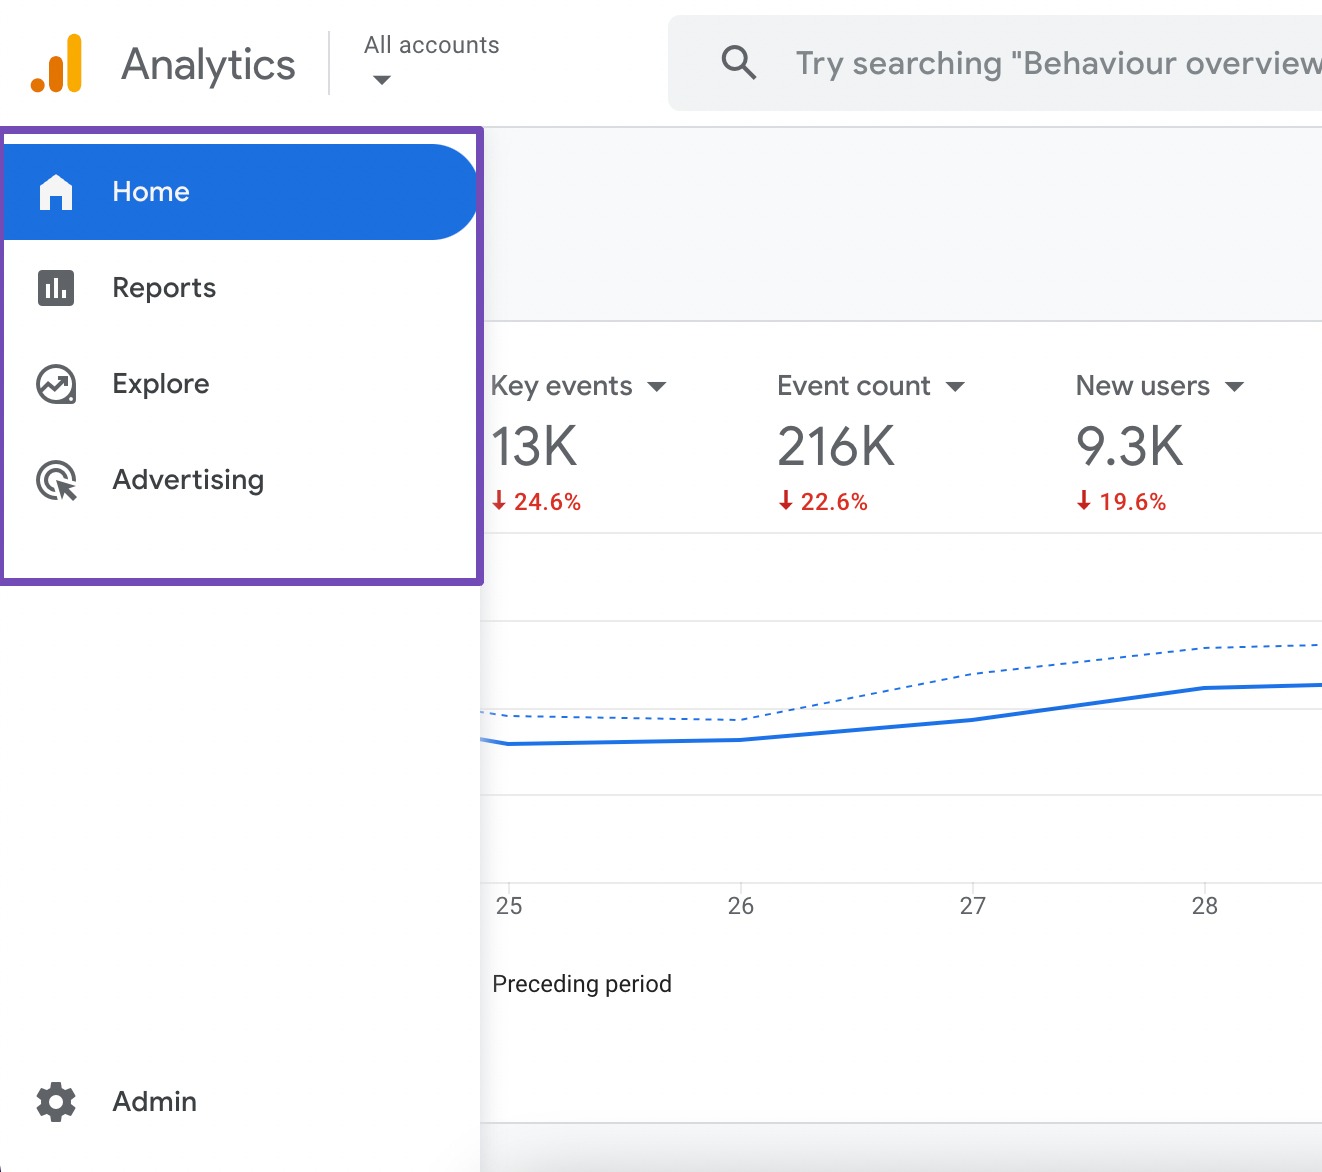
The interface consists of four options:
- Home Section: It provides an overview of everything happening on your site.
- Reports Section: This tab offers deeper insights into your site’s performance.
- Explore Section: Here, you can customize the data to your business needs.
- Advertising Section: If you run Google Ads, you can link them to Google Analytics to understand the effectiveness of your marketing efforts across various channels.
3.1 Home Section in Google Analytics
The Home dashboard in Google Analytics is your primary entry point for understanding how your website is performing.
It provides a snapshot of key metrics and user activity, offering a quick overview of your site’s health and performance.
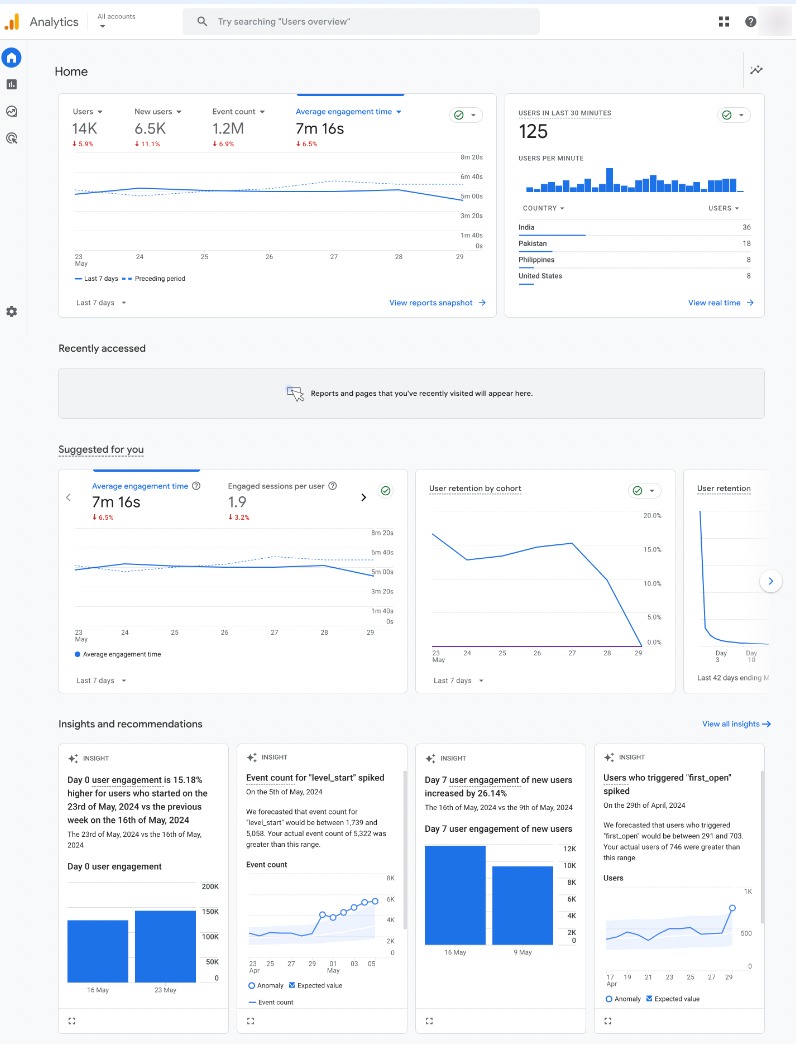
Overview Card
The overview card displays metrics relevant to you, each with a trendline. Google Analytics updates the metrics based on your behaviour within the platform.
For instance, if you frequently check the Total Revenue metric, Analytics will add a tab to the overview card showing how revenue has changed over the past 7 days.
By clicking this tab, you can view a trendline (solid line) with a data point for each day in the last 7 days, compared to data points from the previous 7 days (dashed line).
By default, Google Analytics shows data for the past 7 days, but you can adjust this to suit your needs.
Users
It also displays the number of users, which refers to the total number of unique individuals who interacted with your website or app within the selected time frame.
For instance, if a user visits your website every day for the past seven days, they will be counted as one user, as the system tracks unique individuals.
Key Events
Key events are important actions on your site that you want to track, and you need to define them. To set up key events, navigate to the Admin → Data display → Events, as shown below.
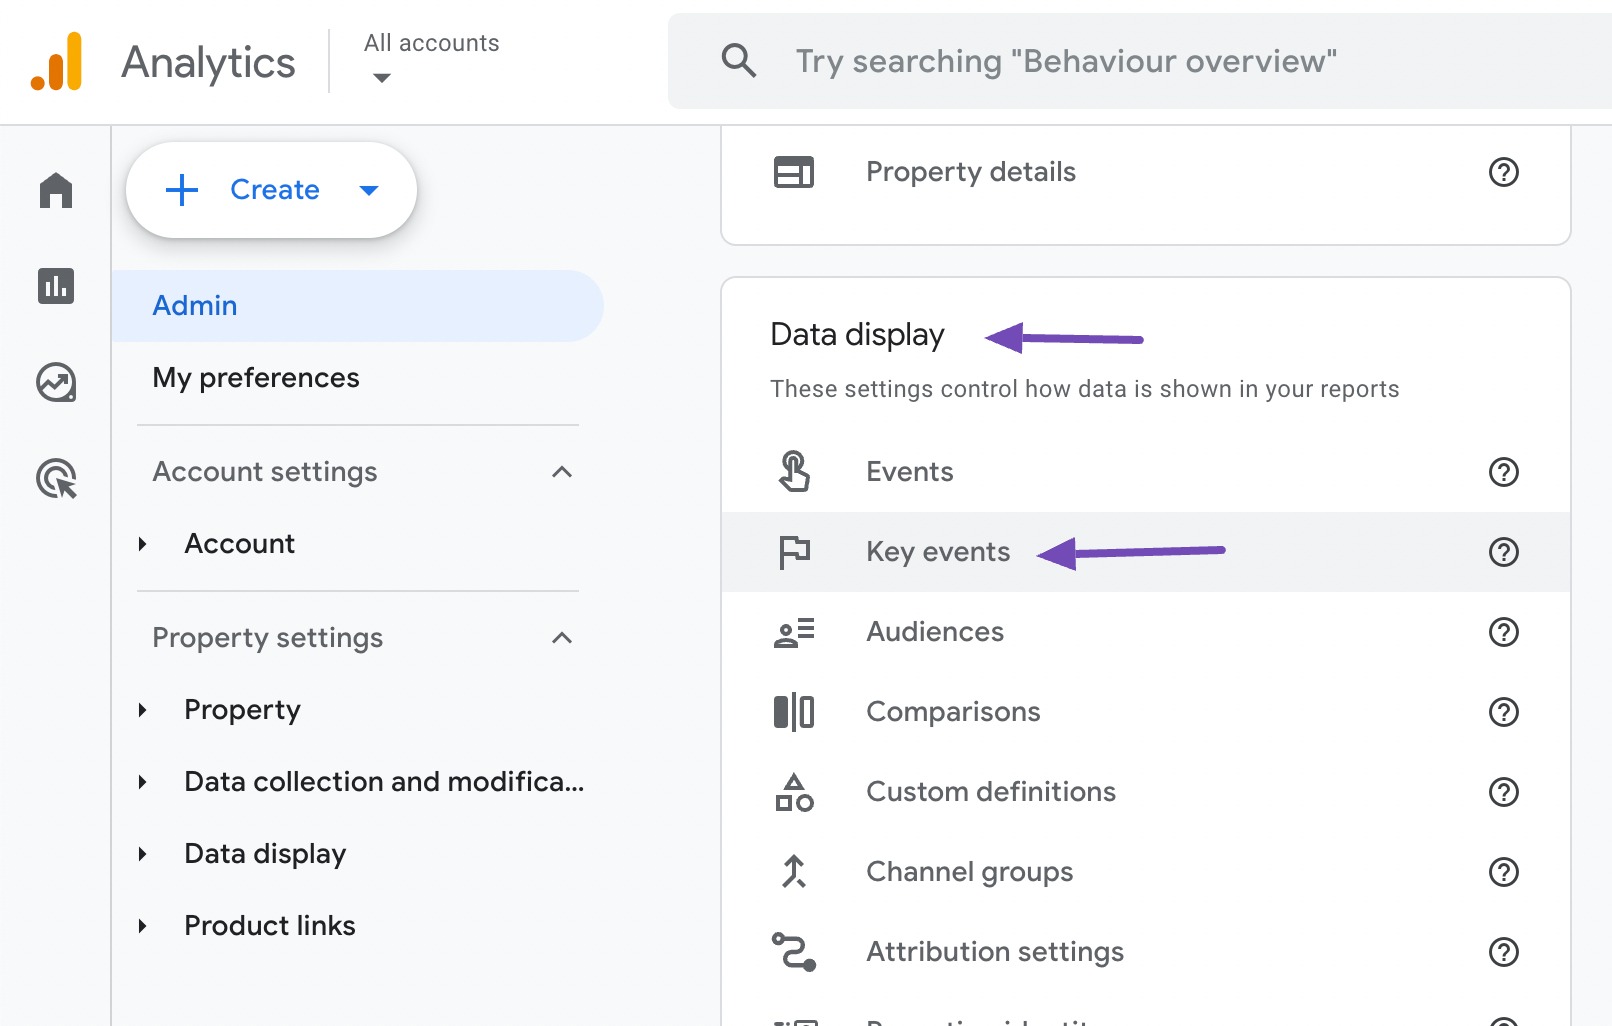
In the Events section, you will see a list of the events you track. To mark an event as a key event, there is a toggle switch.
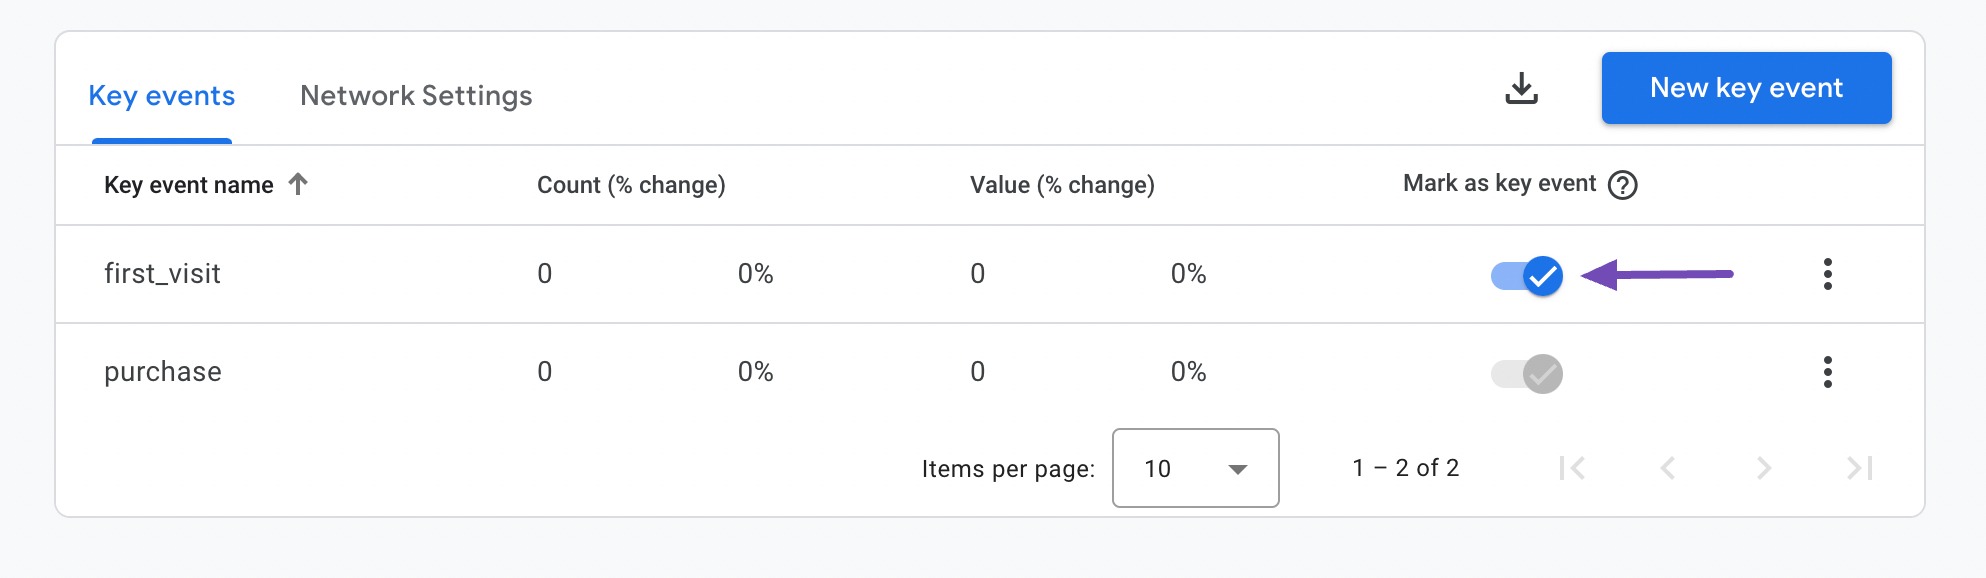
Once marked as a key event, the data for this event will be captured and displayed on your Home tab. For instance, if you set first_visit as a key event, you will see at a glance how many users visited your site for the first time over the past 7 days.
Additional Metrics
- New Users: By default, Google Analytics shows the number of new users, which refers to the unique individuals who visited your website or app for the first time within the selected date range.
- Event Count: This metric indicates the number of times events were triggered on your site within the selected date range.
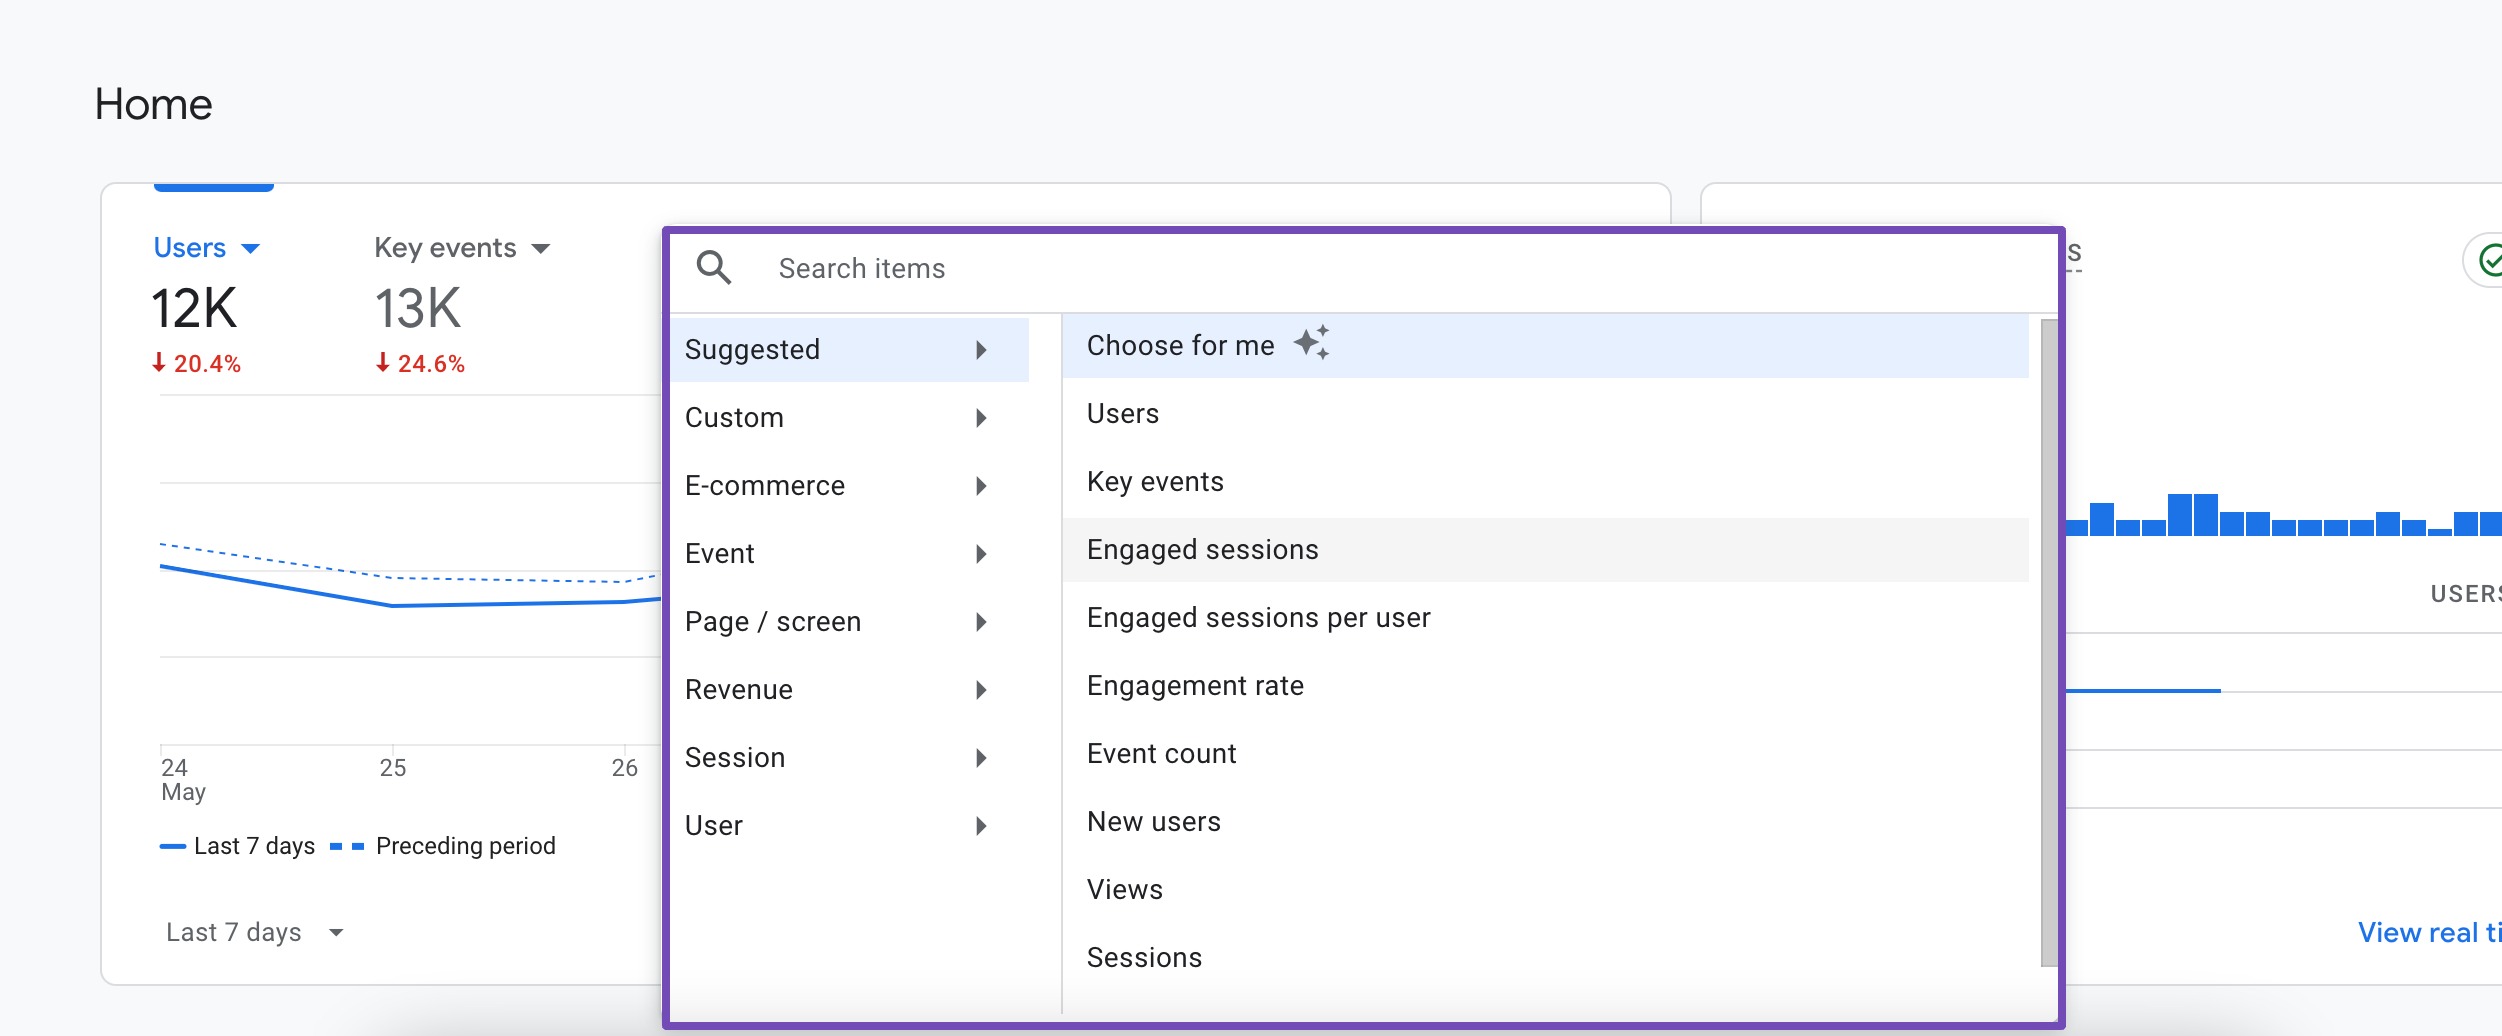
The Home dashboard can be customized to display the data that matters most.
For instance, you can change the event count by hovering over it. A drop-down arrow will appear, and there will be the suggested data to view at a glance, and you can choose an item as per your preference.
Real-time Card
The Real-Time card in Google Analytics provides live data about your website’s current activity. It lets you see what is happening on your site anytime, providing instant insights into user behaviour, traffic sources, and interactions.
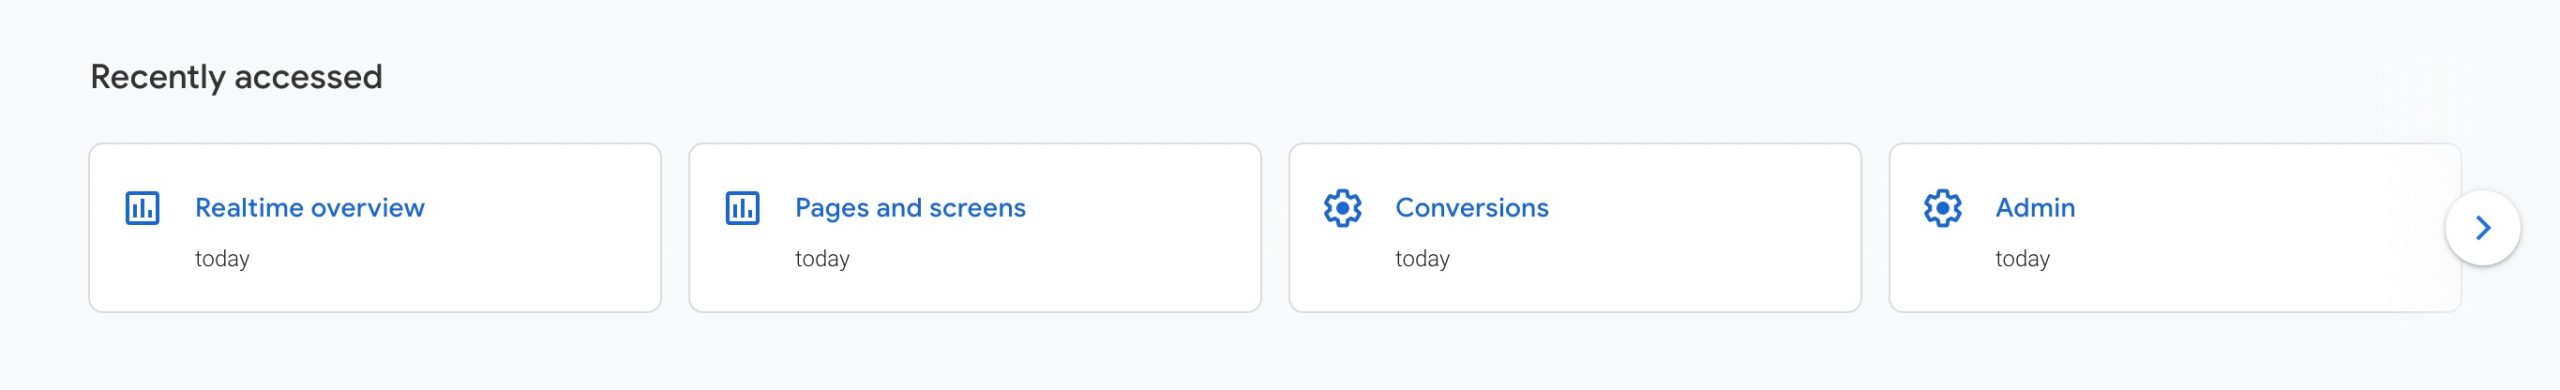
Recently accessed Card
The Recently accessed card in Google Analytics provides quick access to the reports, dashboards, and data that you have recently viewed.
This card is designed to improve your workflow by making it easier to revisit and continue working on recent analyses without navigating through the entire Analytics interface again.
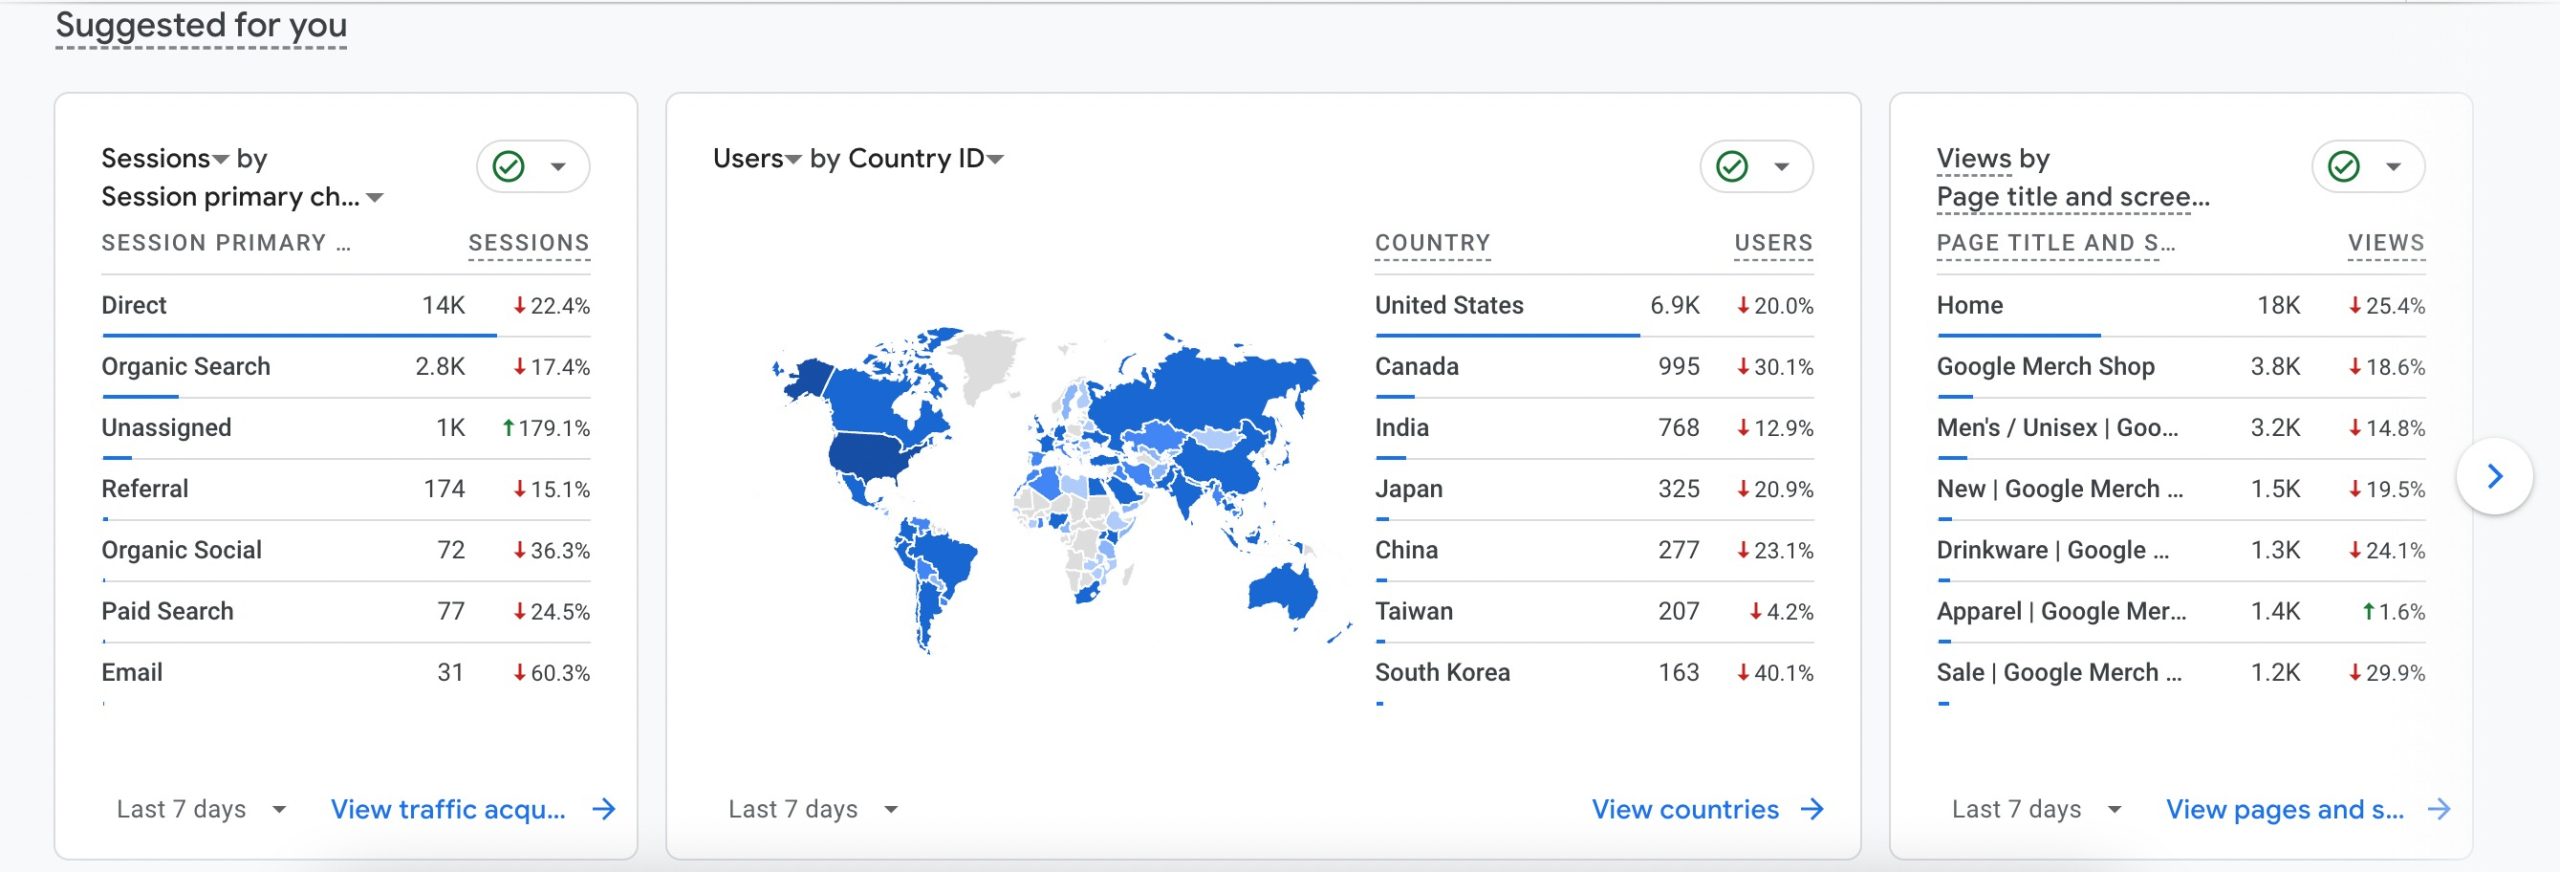
Suggested for you
The Suggested for you card in Google Analytics is a personalized feature that offers recommendations based on your usage patterns and behaviour within the platform.
This card aims to help you discover valuable insights and reports you might not have considered, enhancing your overall experience and effectiveness in using Google Analytics.
Insights and recommendations Card
Insights highlight unusual changes, emerging trends, and other significant information about your site or app.
Recommendations offer suggestions to help you obtain the most useful and accurate data while leveraging new, relevant features as they become available.

Google generates these recommendations by analyzing your property’s history, settings, and overall trends in Google Analytics.
If your property is new, you might not see any recommendations initially. However, be sure to check back regularly as Google Analytics continuously discovers and updates recommendations for you.
3.2 Reports Section in Google Analytics
The Reports section in Google Analytics is important for understanding various aspects of your website’s performance. It is divided into several categories, each providing specific insights into different dimensions of user activity and site performance.
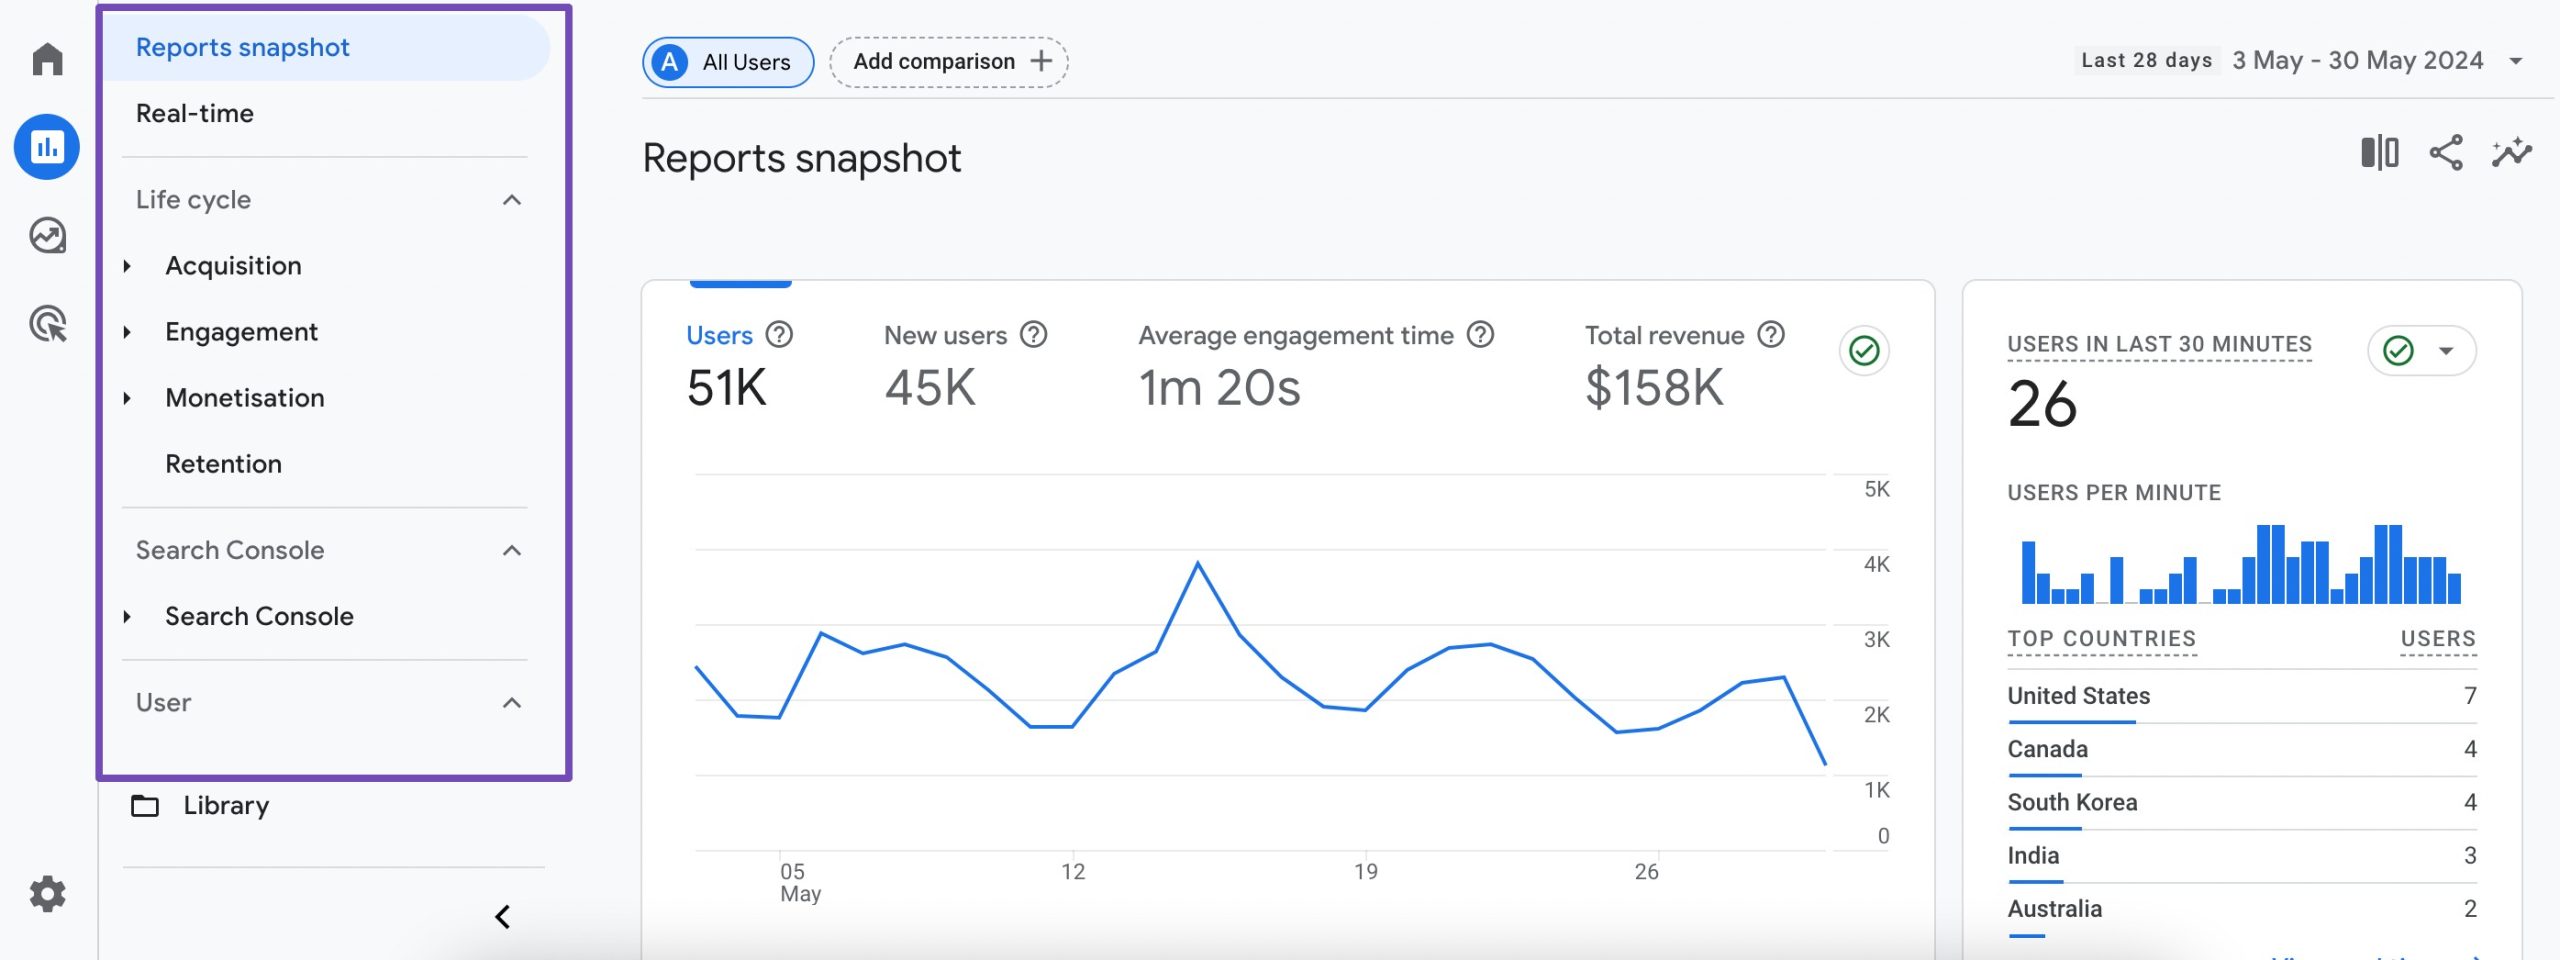
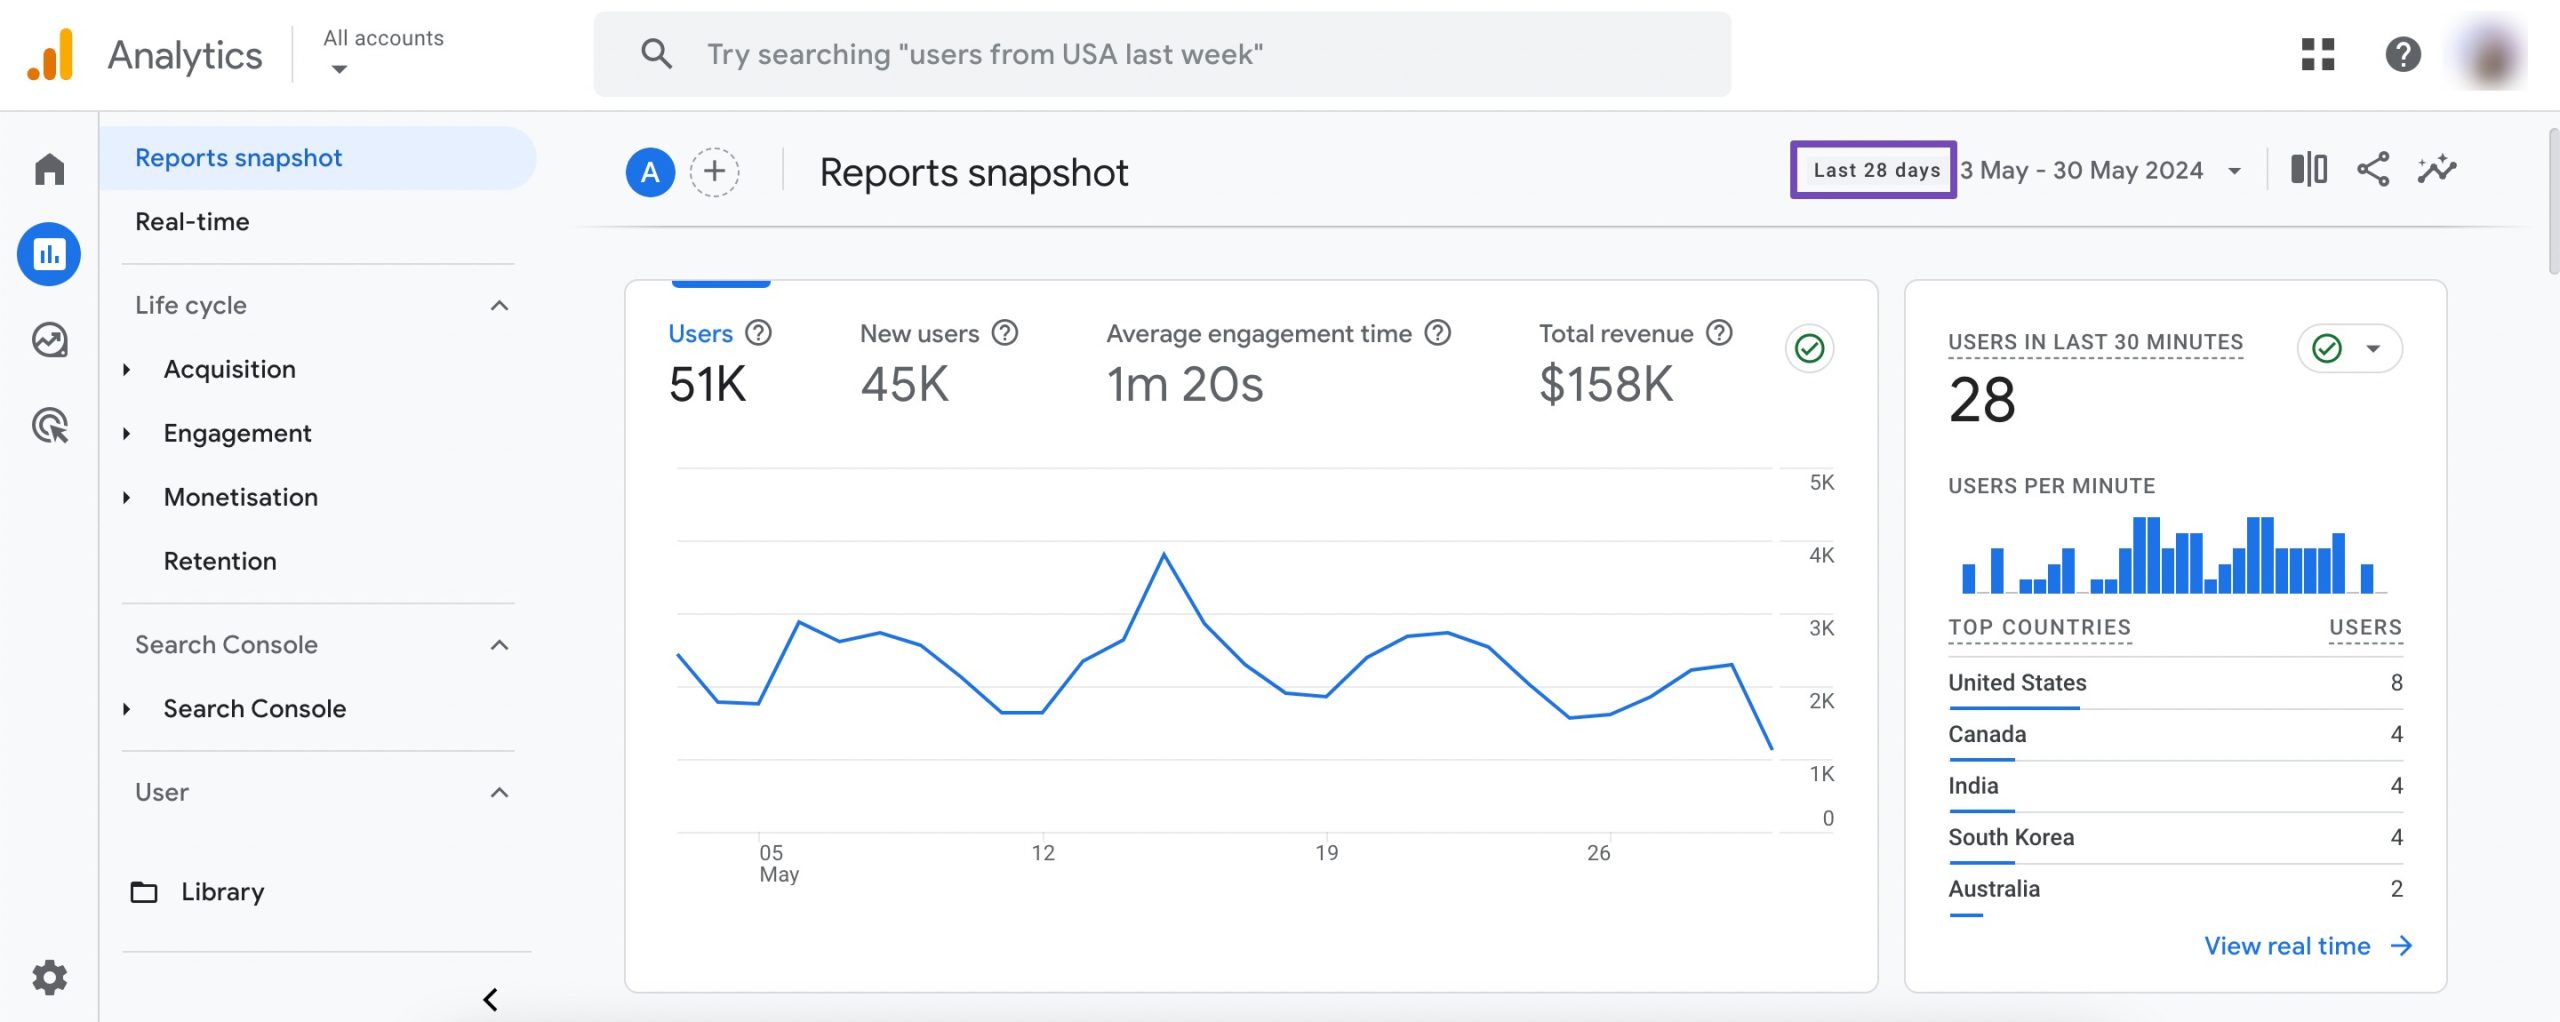
Reports snapshot
The first section of the Reports snapshot presents the user activity report, offering key metrics such as the total number of active users, new users, average engagement time, and total revenue.
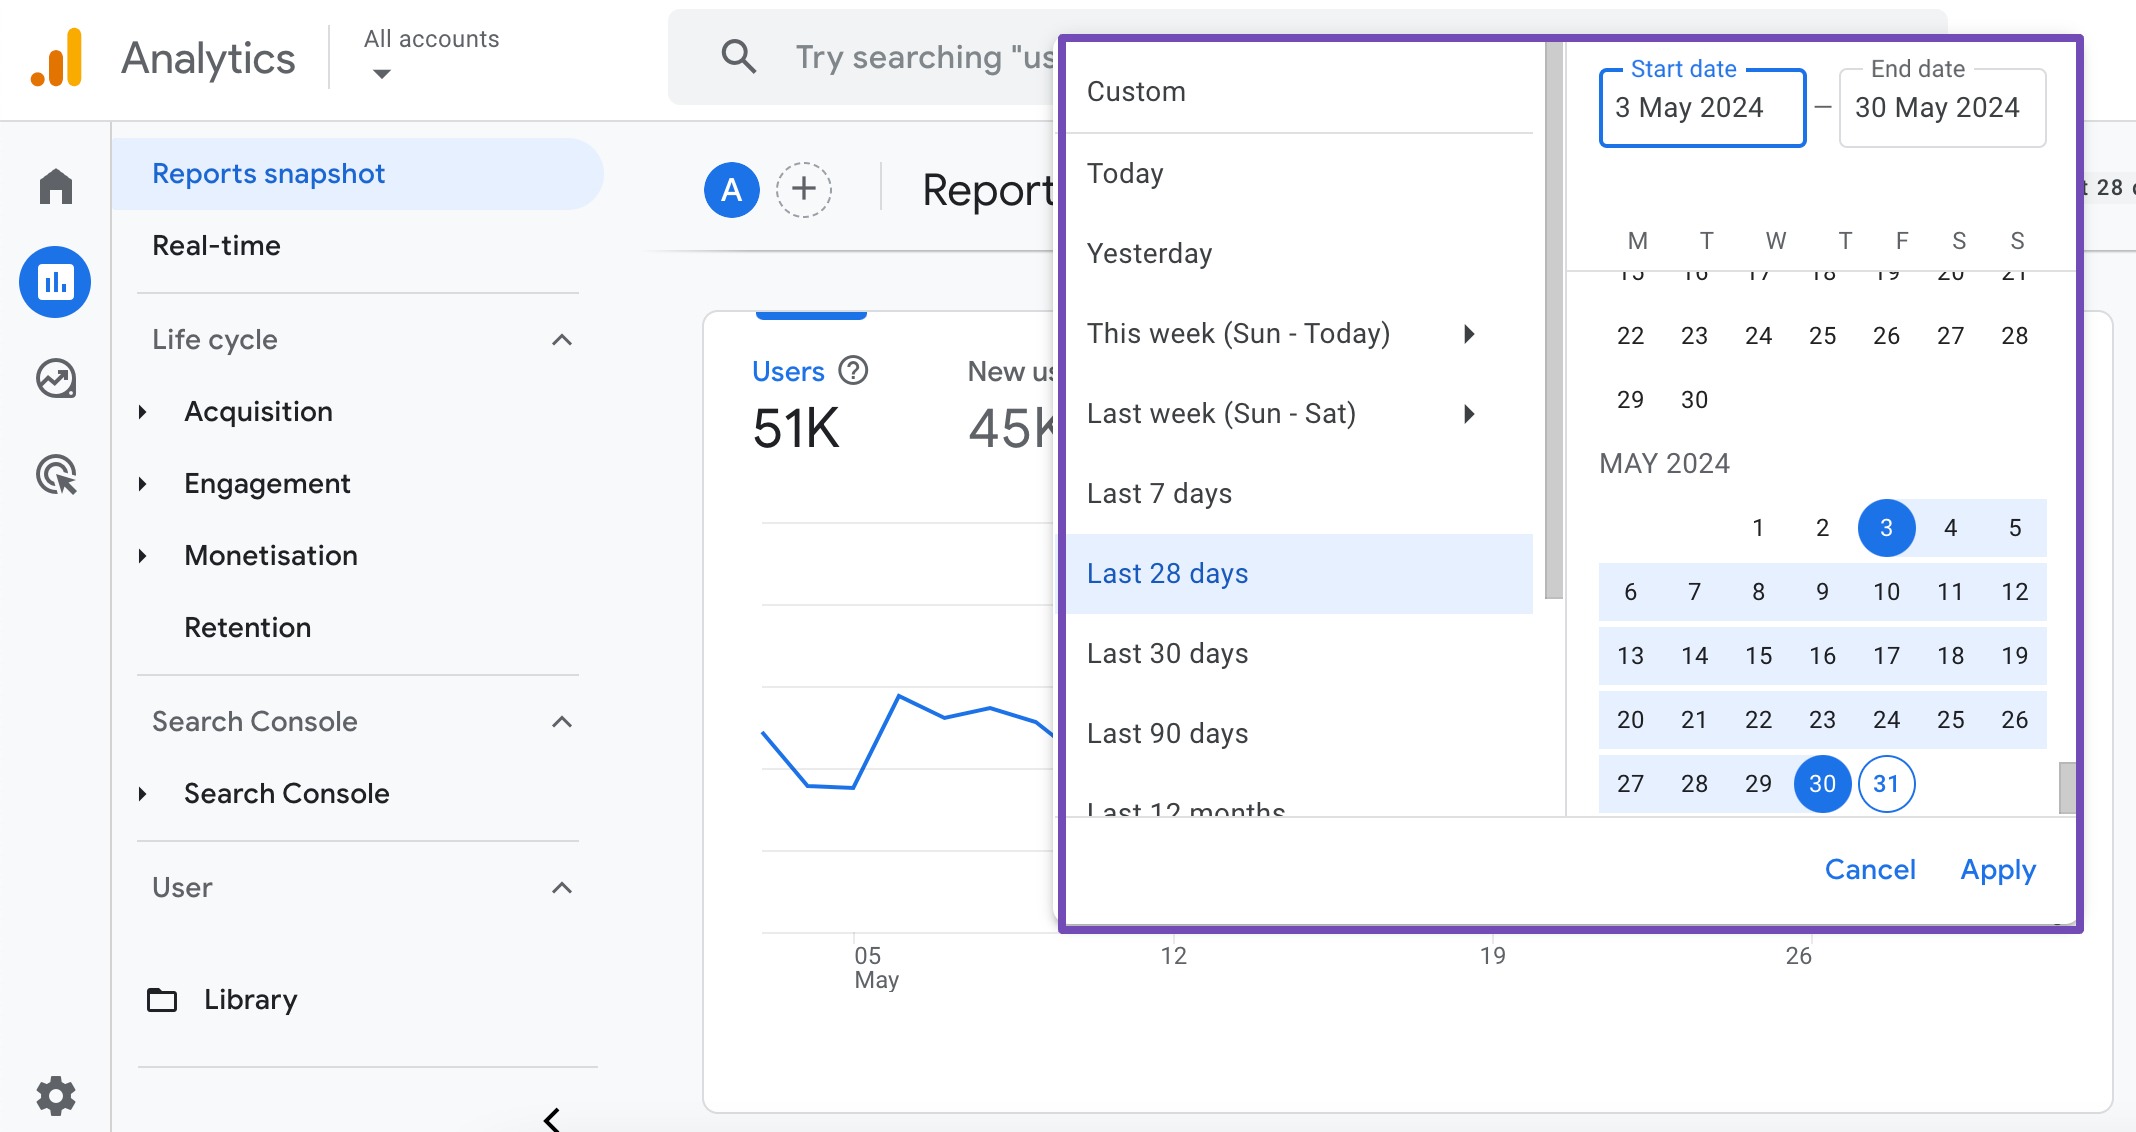
It’s worth noting that the default date range for this data is 28 days, unlike the 7-day range displayed on the home tab.
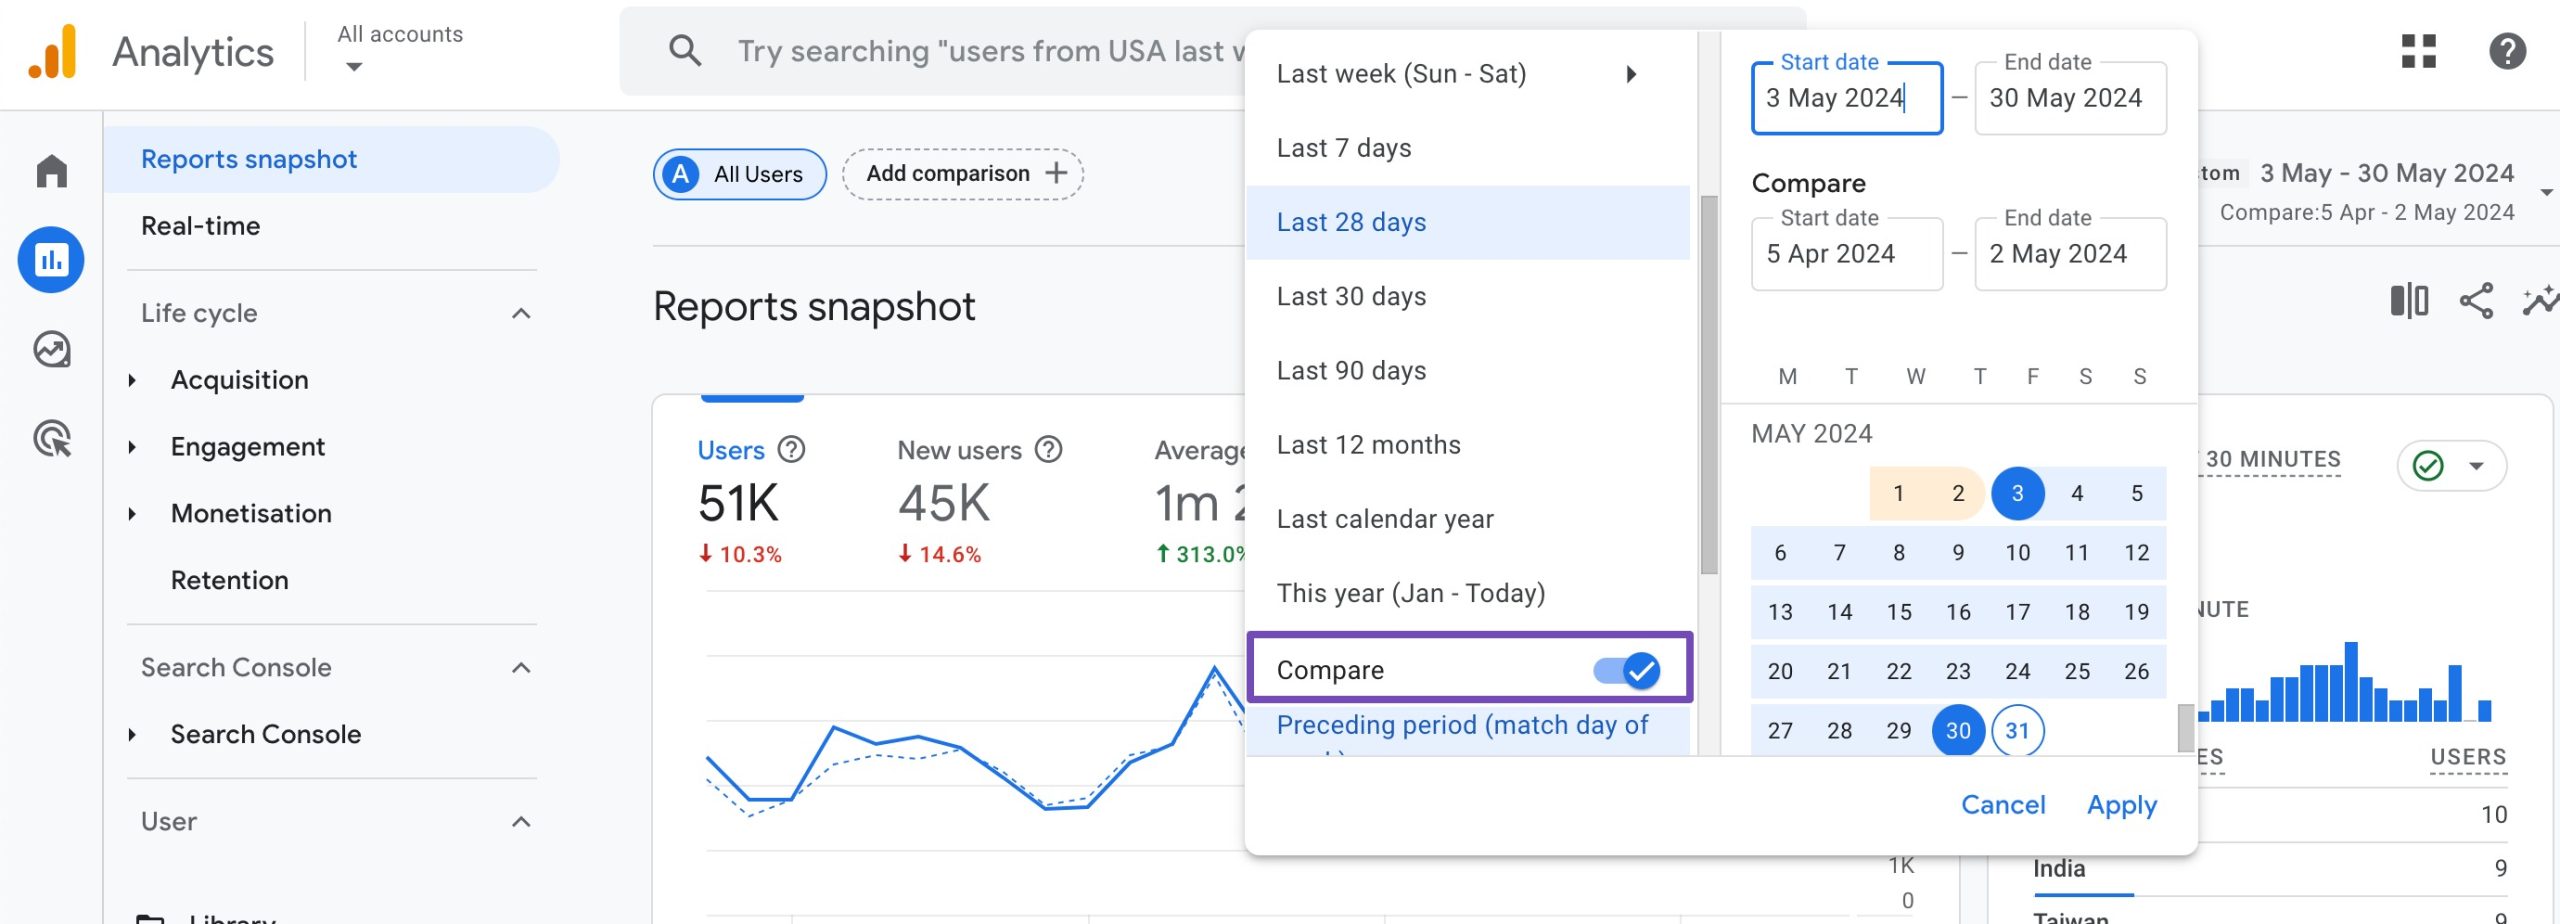
To customize the date range, simply click on it. You’ll find preset date ranges to choose from, or you can set a custom range by clicking on the dates. The first click sets the start date, the second sets the end date, and then click Apply to update the data accordingly.
Additionally, you can compare two sets of data to analyze the site’s performance over different periods. Once set, the graph will display the main data as a solid line and the comparison data as a dotted line.
Key Metrics
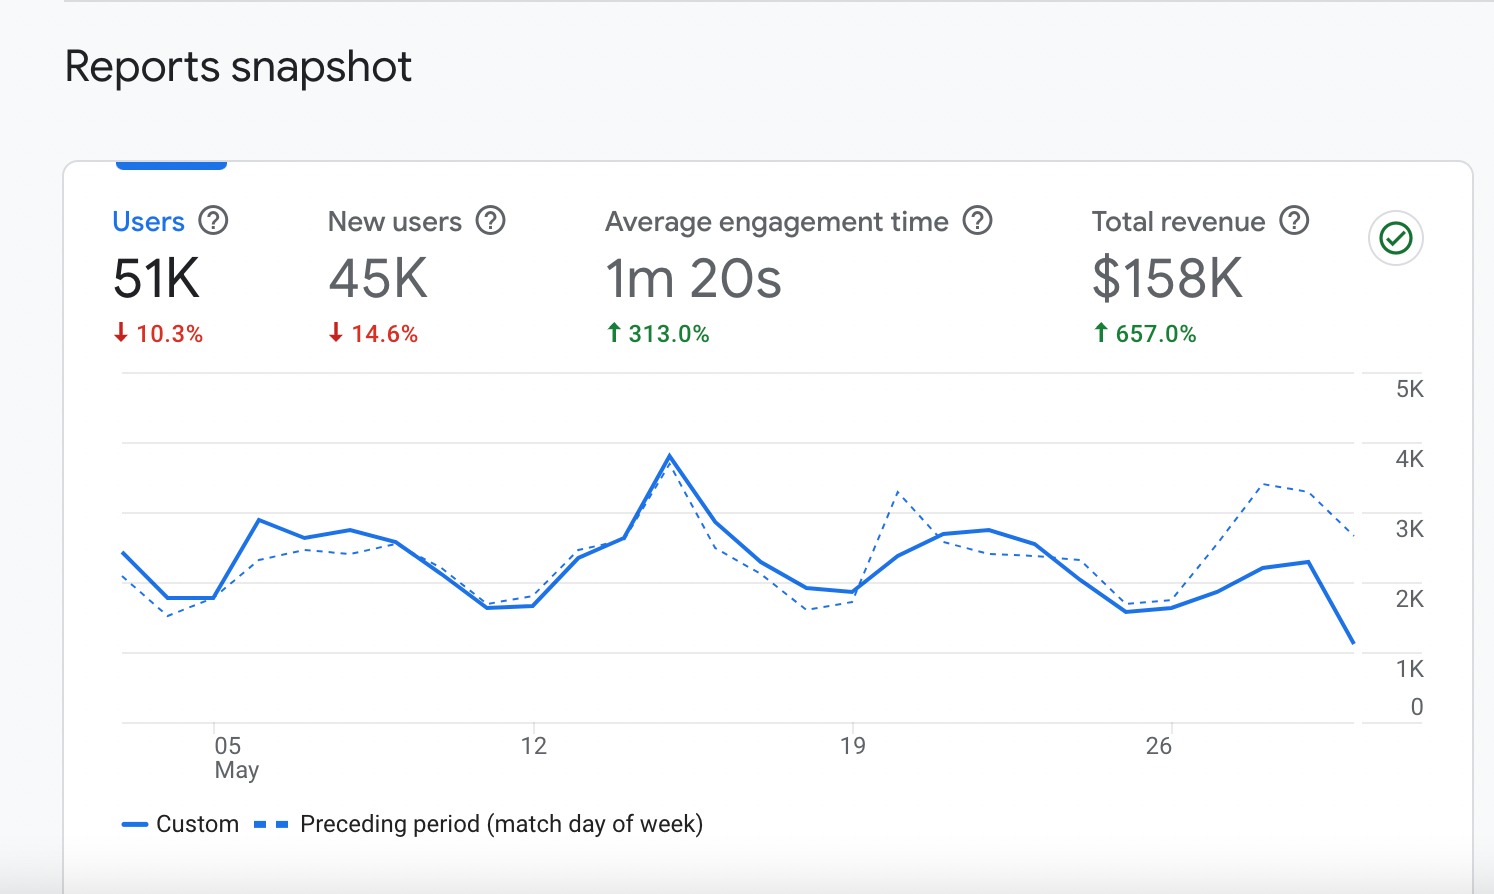
- Users: This metric represents the total number of unique users who have visited your website or app within the selected time frame. It includes both new and returning users.
- New Users: New Users refer to the number of unique individuals who have visited your site or app for the first time within the selected date range.
- Avg Engagement Time: Average Engagement Time measures the average time users spend on your website or app during their sessions.
- Total Revenue: Total Revenue is the cumulative sum of all revenue generated from transactions on your website or app. It includes revenue from e-commerce sales, subscriptions, donations, or any other monetization channels. This metric is particularly relevant for businesses that sell products or services online.
Real-time Card
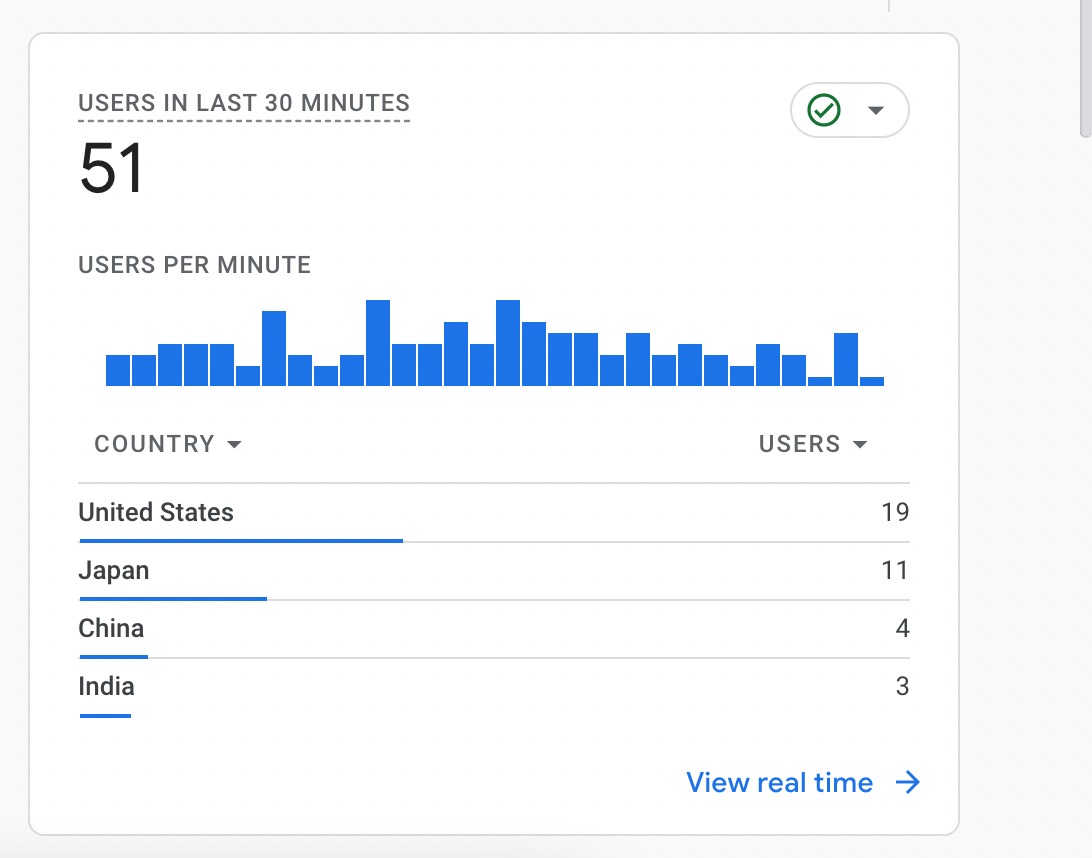
Similar to the home tab, you will have real-time data showing you the number of users in the last 30 minutes and which country the users come from.
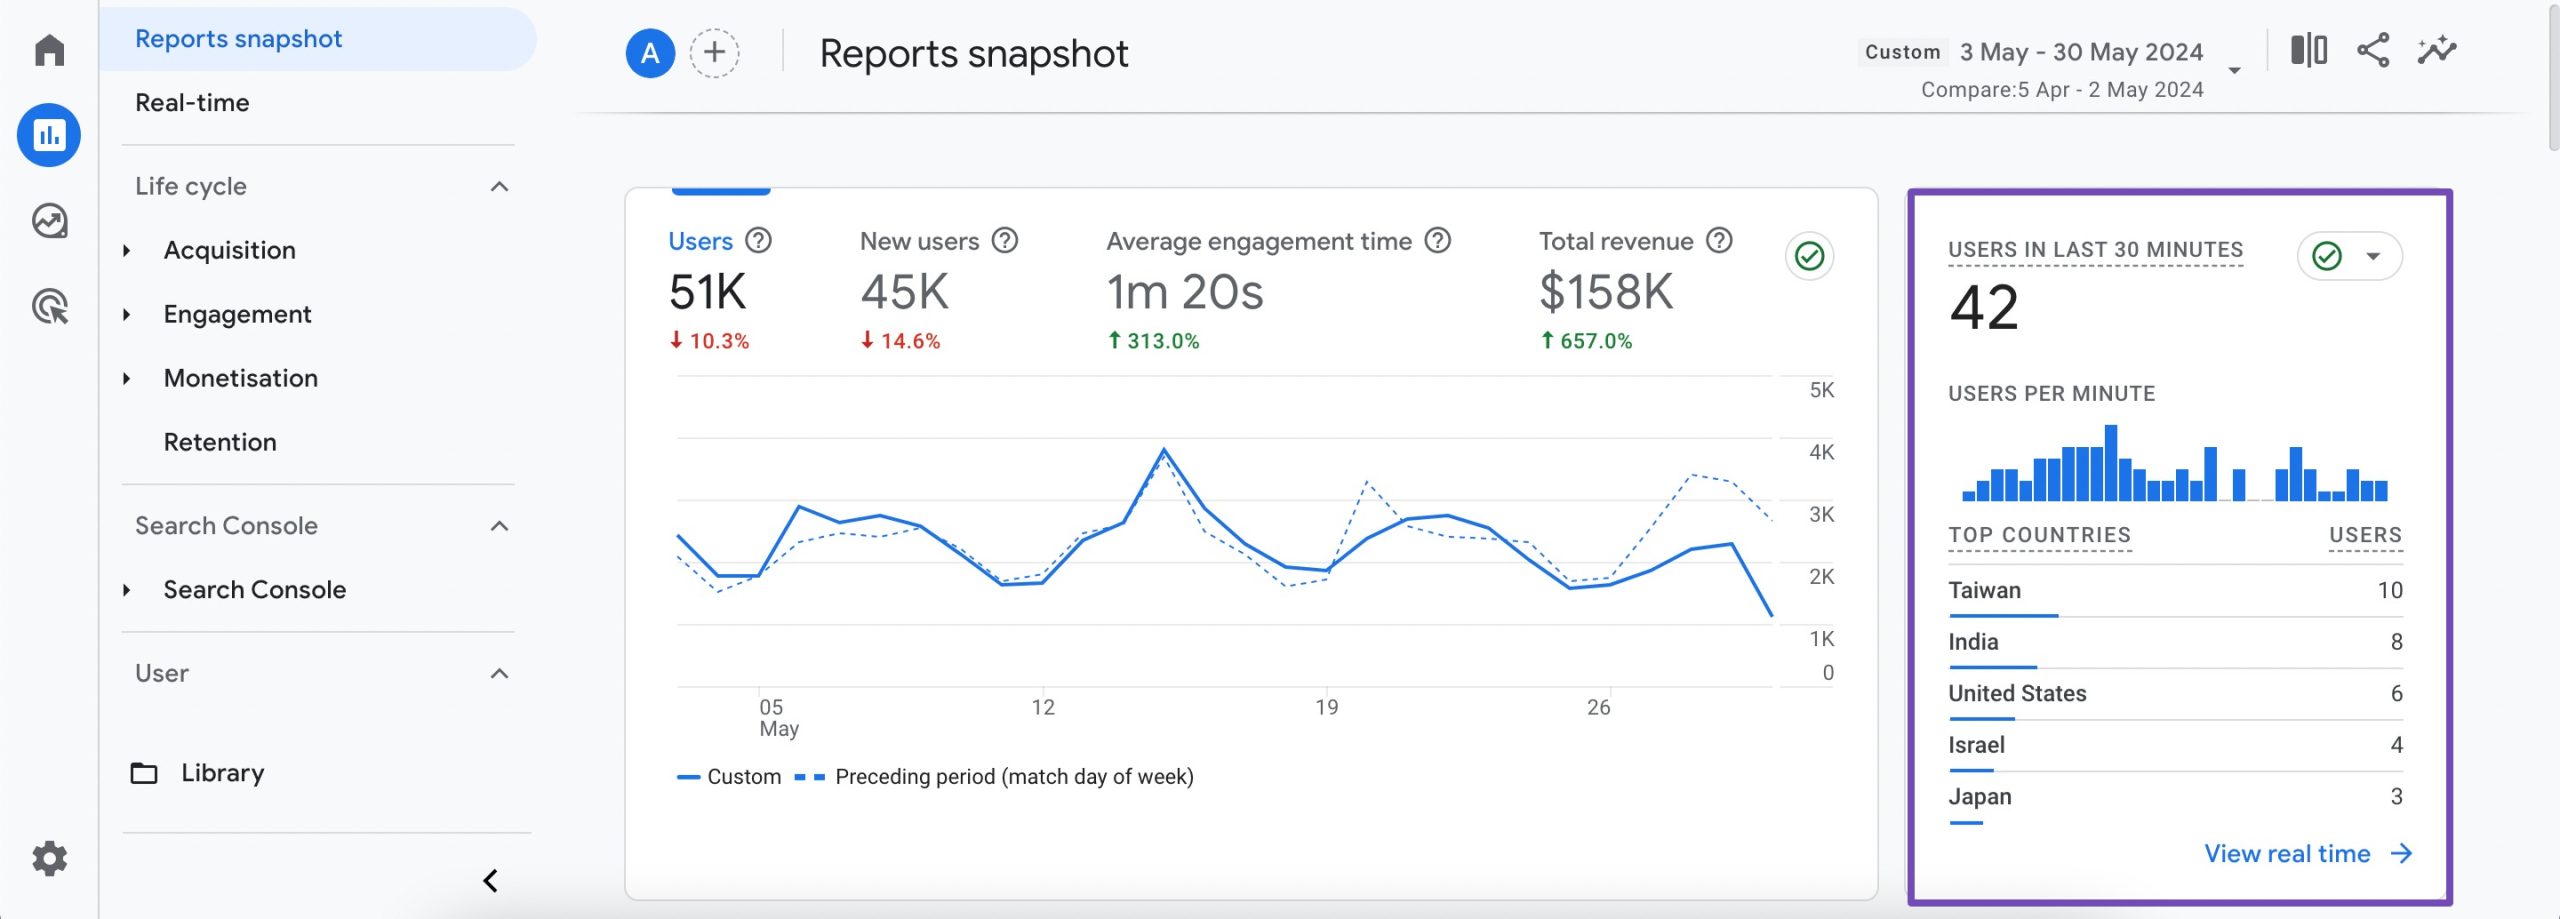
If you click on the View real time, it will lead you to the data in the real time tab, which we’ve discussed below.
Insights Card
The insights card is similar to the one in the Home tab.
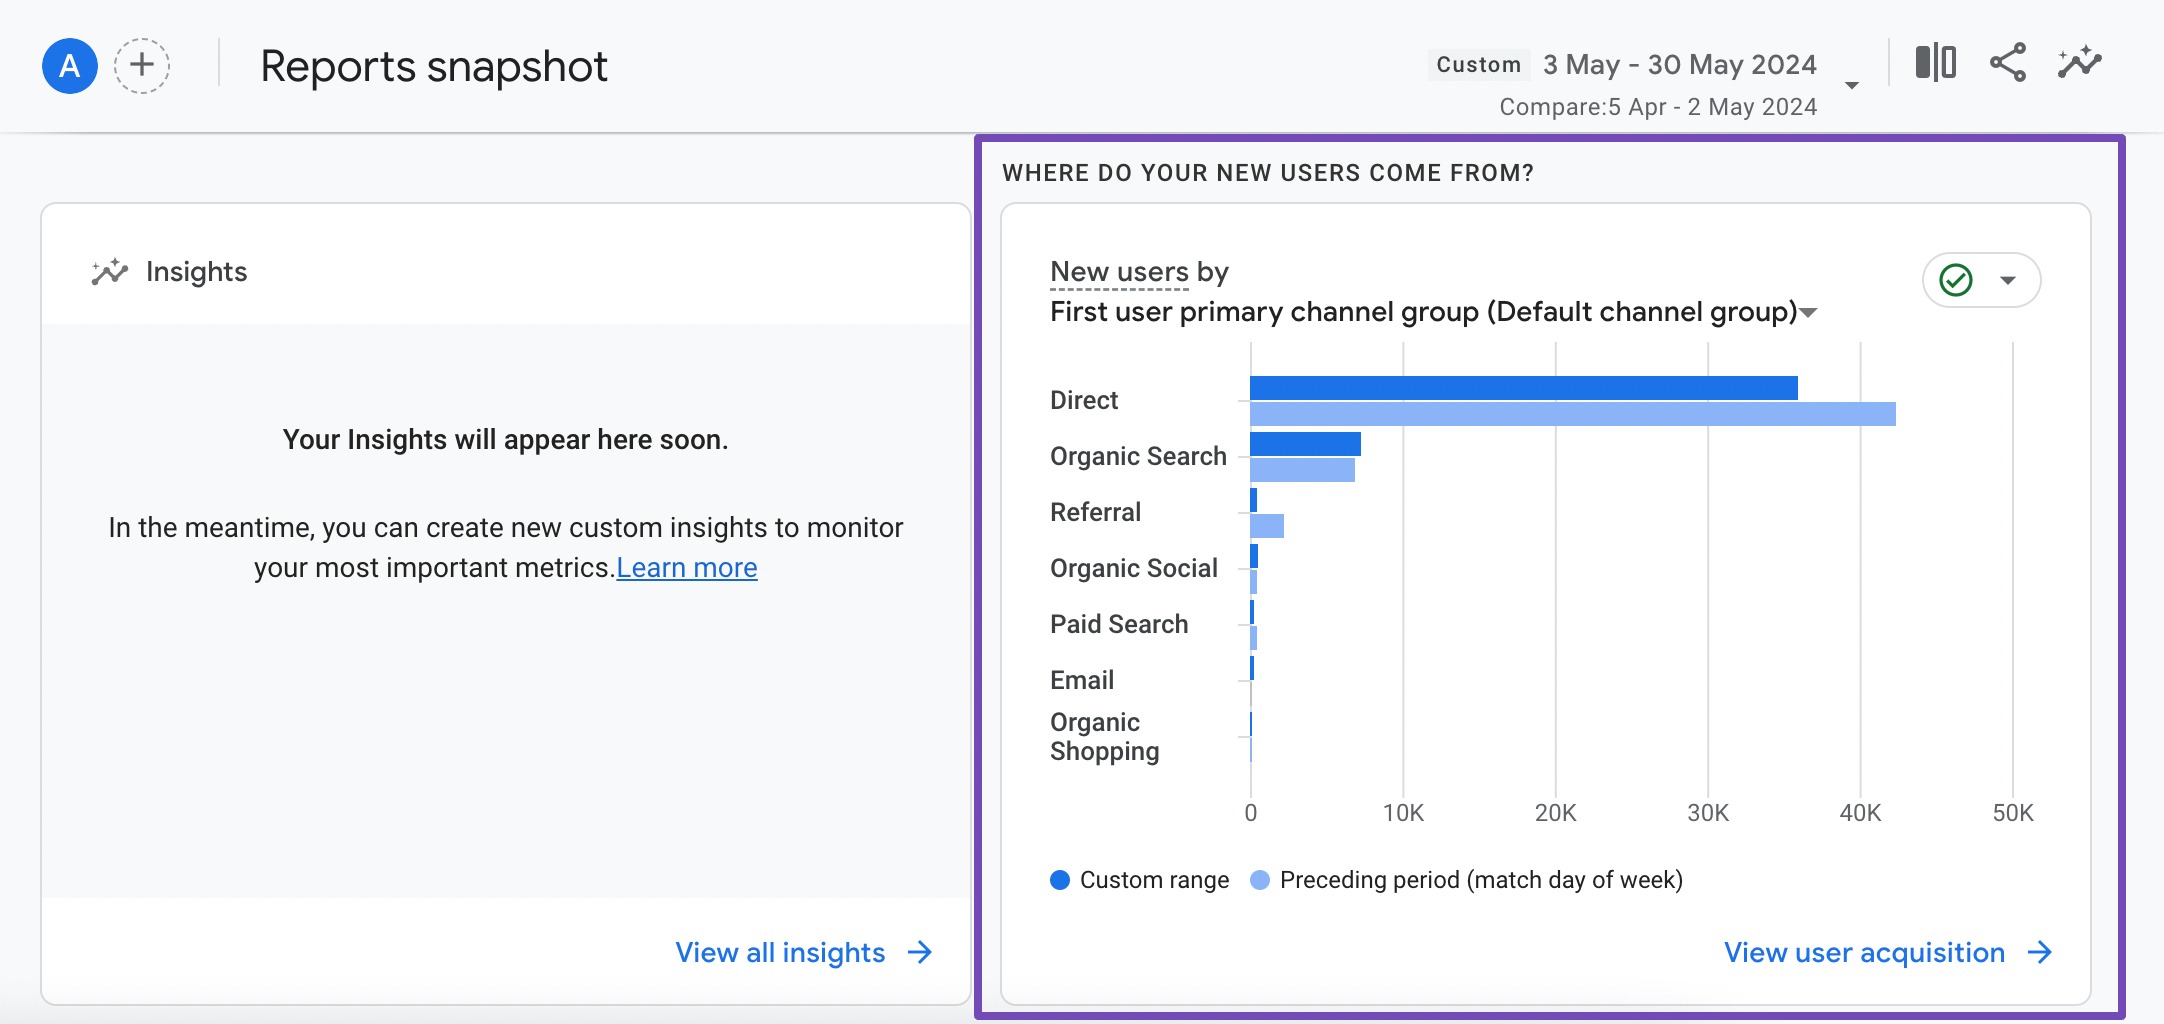
Where Do Your New Users Come From? Card
Subsequently, the next data card indicates the origin of your new users based on their traffic sources. This group of users may have found your site directly, perhaps by typing your domain name directly into their browser.
What Are Your Top Campaigns? Card
The WHAT ARE YOUR TOP CAMPAIGNS? card in Google Analytics provides insights into the performance of your marketing campaigns. It highlights the campaigns that are driving the most traffic and conversions to your website or app.
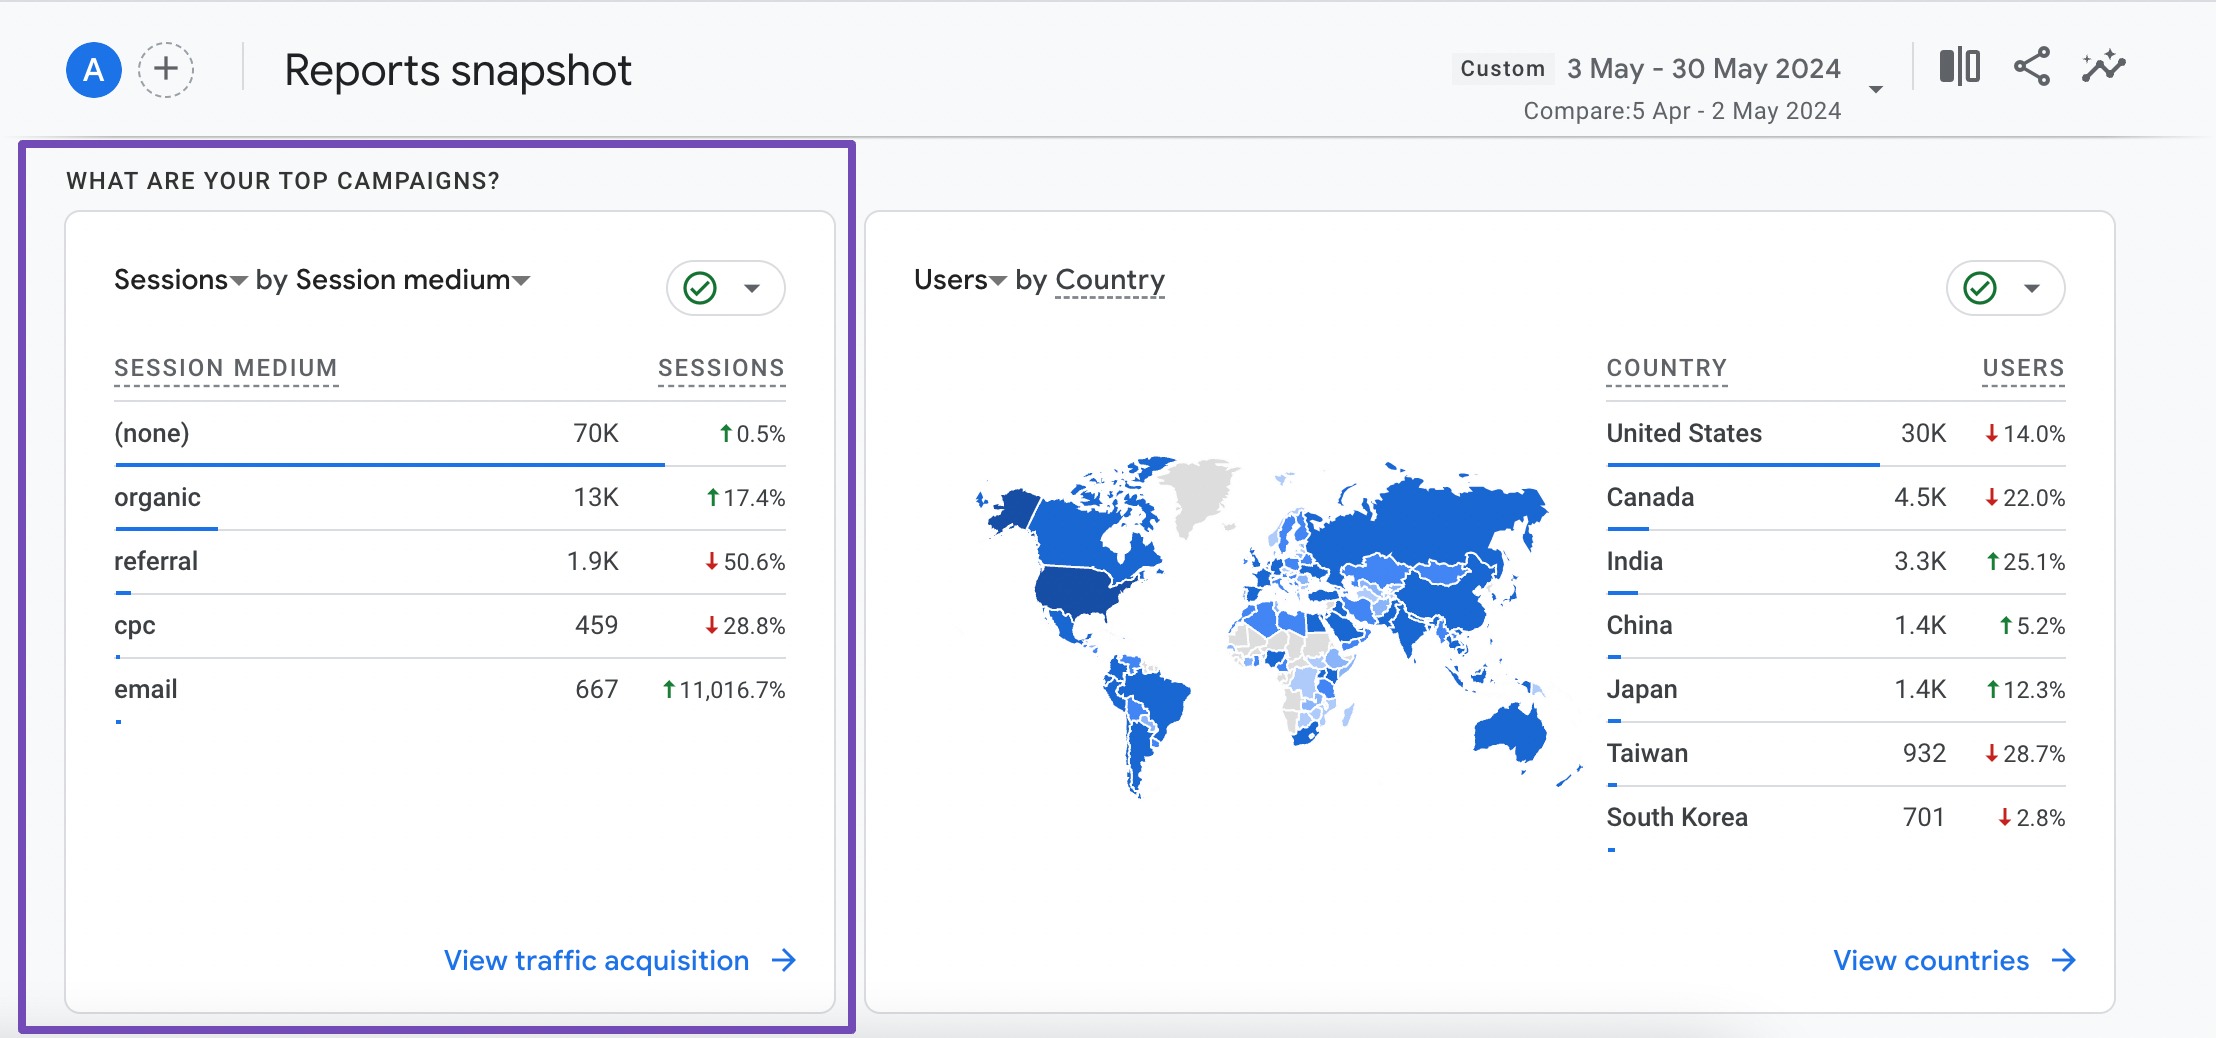
In the context of sessions, if a user visits your site multiple times, for example, five times, within the specified time frame, each visit is counted as a separate session.
When you encounter none in the sessions metric, it indicates that Google Analytics couldn’t determine the specific source or medium responsible for bringing the user to your website.
Users Card
Next, you’ll observe users accessing your site from various countries. The data is arranged from the highest number of users to the lowest. In the map overlay, darker shades indicate countries with the highest number of site visitors.
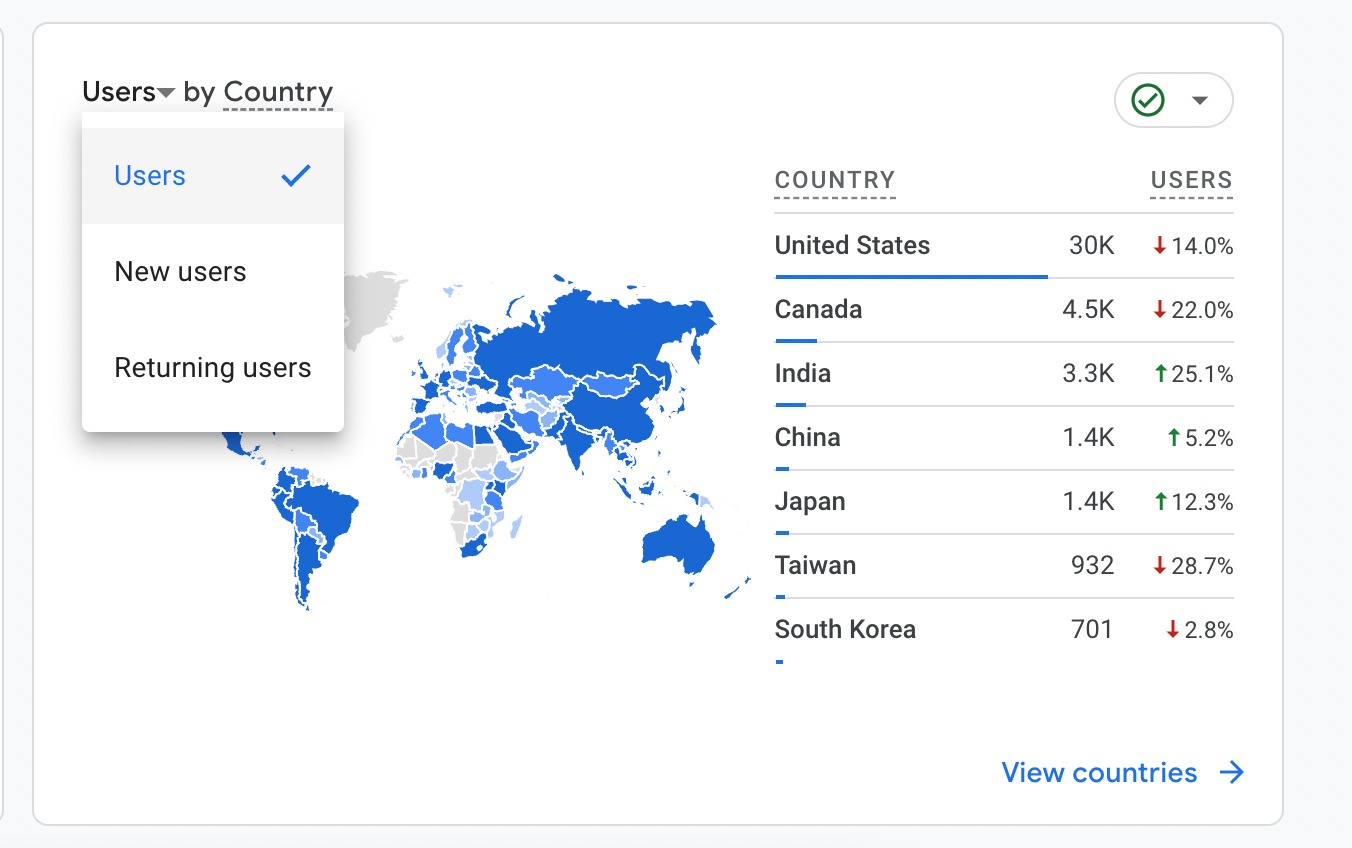
You have the option to switch this view to display New users by country or Returning users by country. These percentages reflect the changes made when the comparison range is enabled.
How Are Active Users Trending? Card
Next, we have the User activity over time section, which is a useful tool for assessing overall traffic trends. You can observe whether your site’s traffic is increasing, decreasing, or remaining stable over the past 30 days, 7 days, and 1 day.
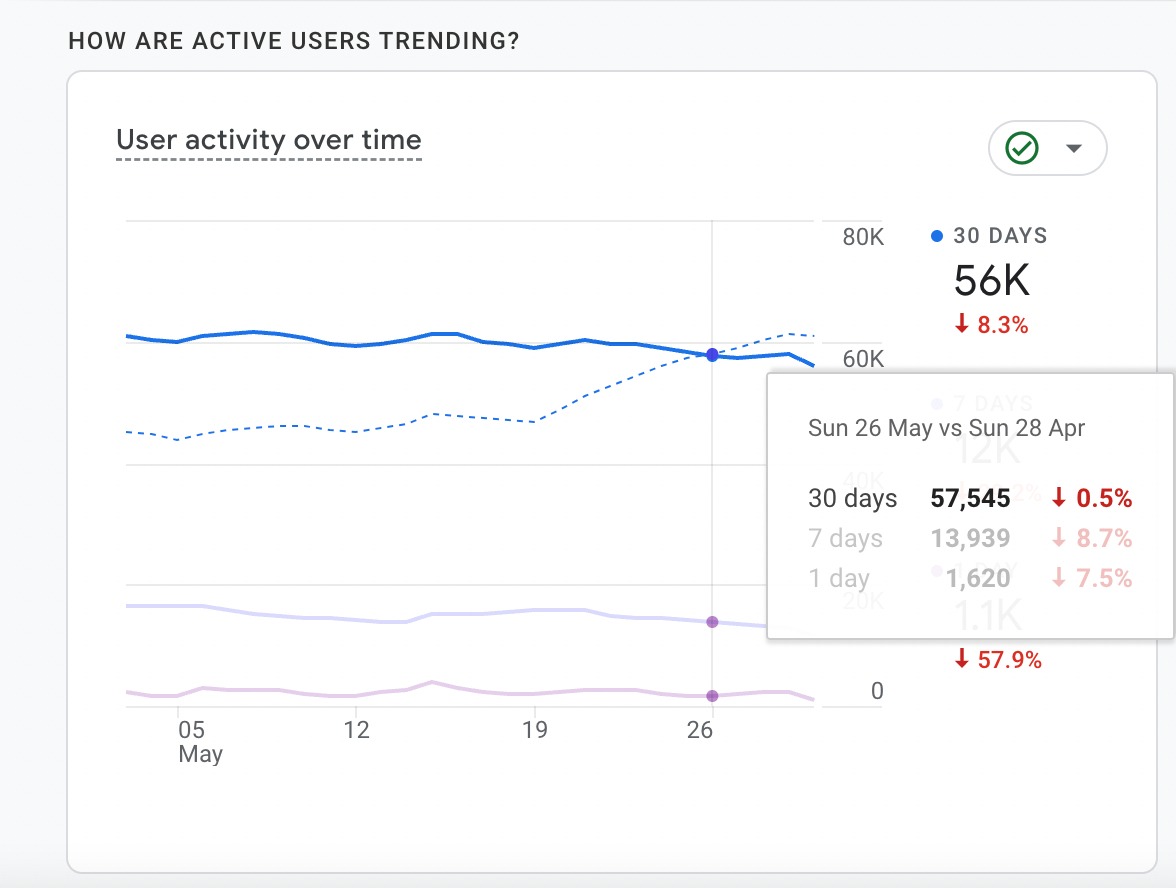
By hovering over the graph, you can view the comparison data. Additionally, as you hover near the line, the comparison data line will also appear, providing further insights.
How Well Do You Retain Your Users? Card
In this card, you can understand how effectively your website or app retains visitors after their initial visit. For instance, 5.3% returned within the first week, 3.1% returned within the second week, 2.7% returned within the third week, and so on.
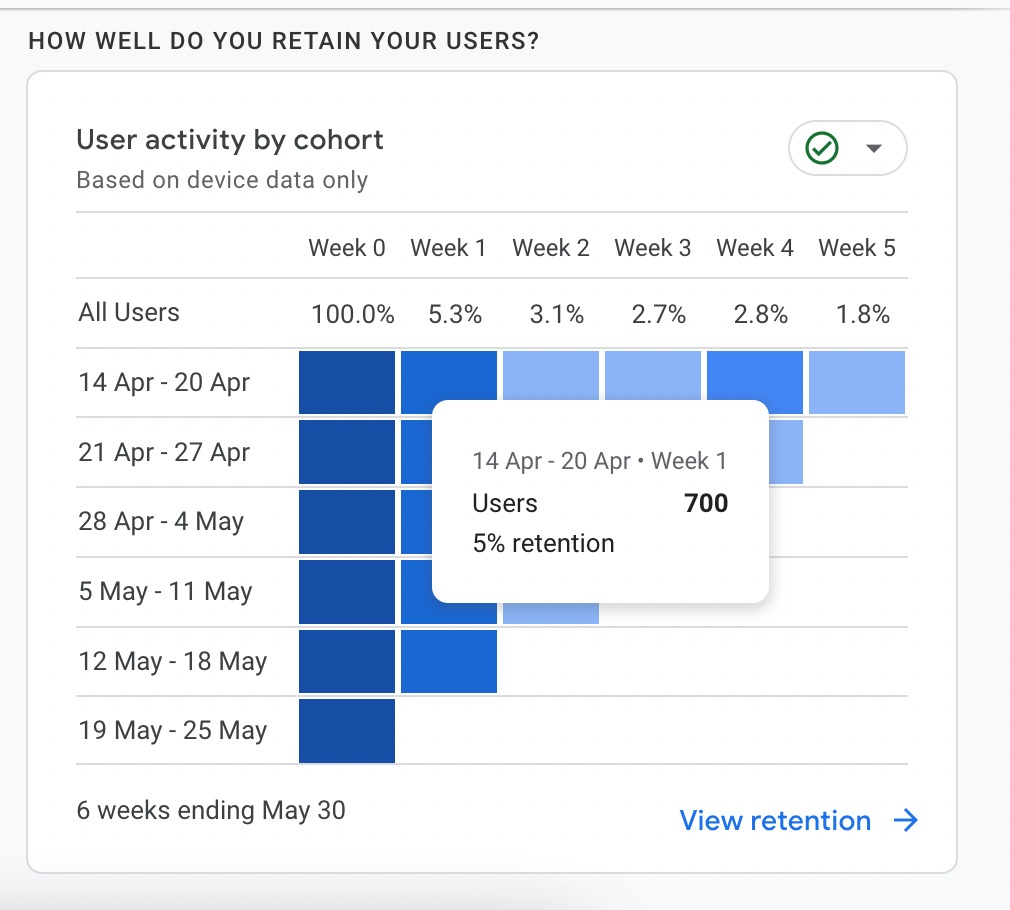
By hovering over the blue boxes, you can view the actual number of users who returned to the site.
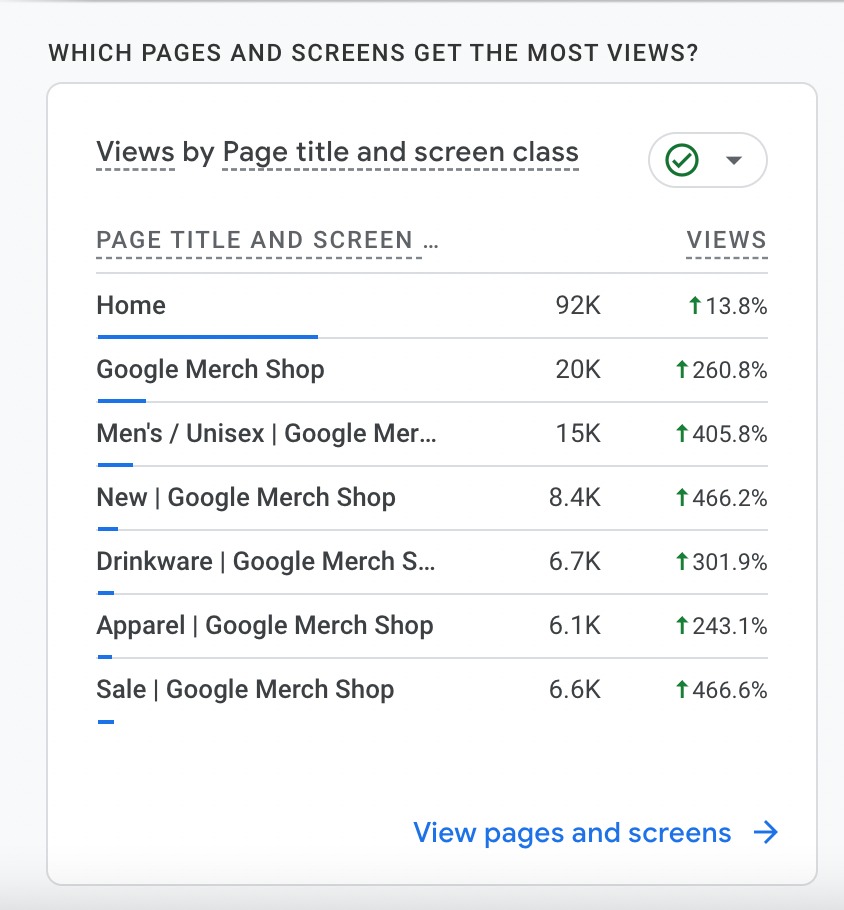
Which Pages and Screens Get the Most Views? Card
Next is the section displaying the most-viewed pages and screens.
What Are Your Top Events? Card
Next, we have the top events, which represent activities tracked on your website. Analyzing this data allows you to understand which actions or activities your users are most engaged with.
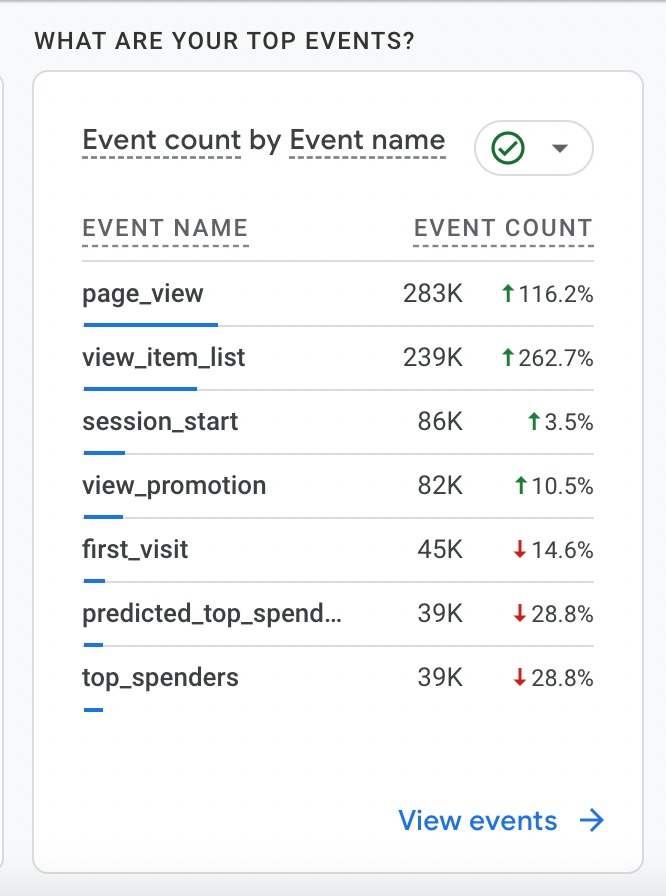
For instance, if view_item_list is among the top events, indicating that many users are interested in browsing your product listings on category pages or search results pages.
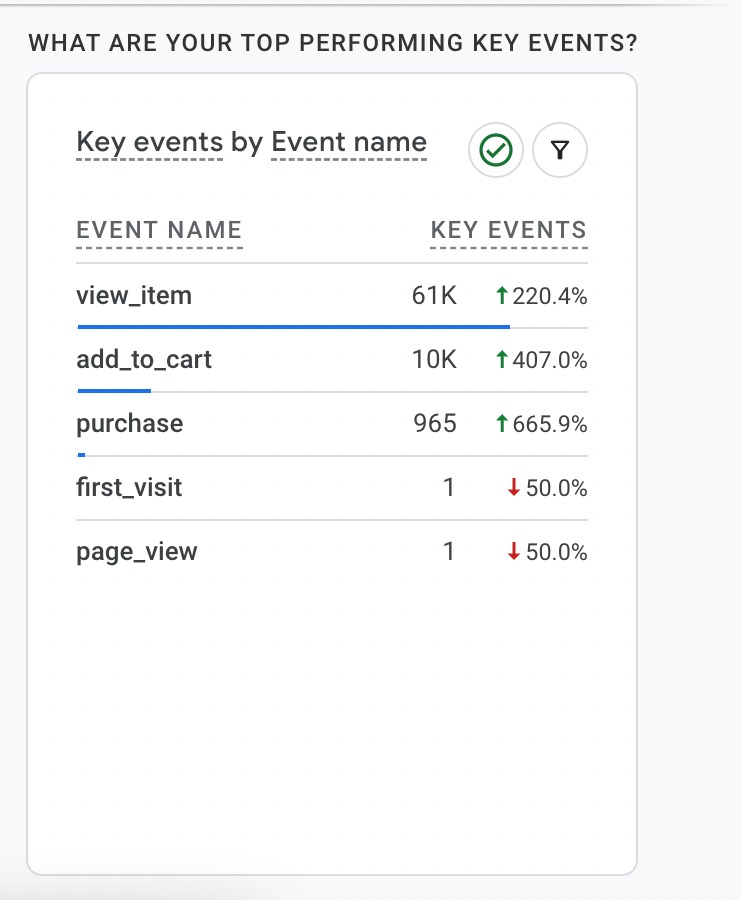
What Are Your Top Performing Key Events? Card
As you know, key events are events you define and typically align with your business objectives. In this card, you’ll find data such as 10K views on specific product pages and 7.2k additions to carts, indicating whether there has been an increase or decrease compared to the previous period.
What Are Your Top Selling Products? Card
This card provides information on your top-selling products.
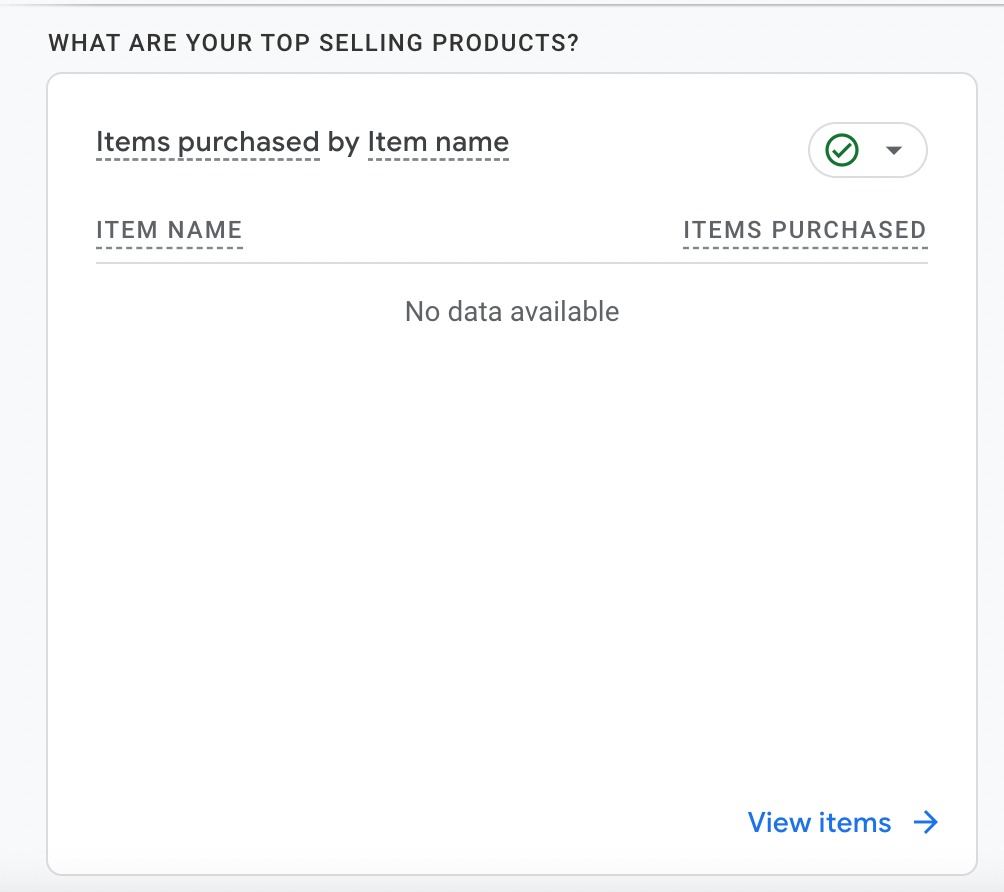
It provides valuable insights into your product sales performance, helping you make data-driven decisions to optimize your product strategy, inventory management, and marketing efforts.
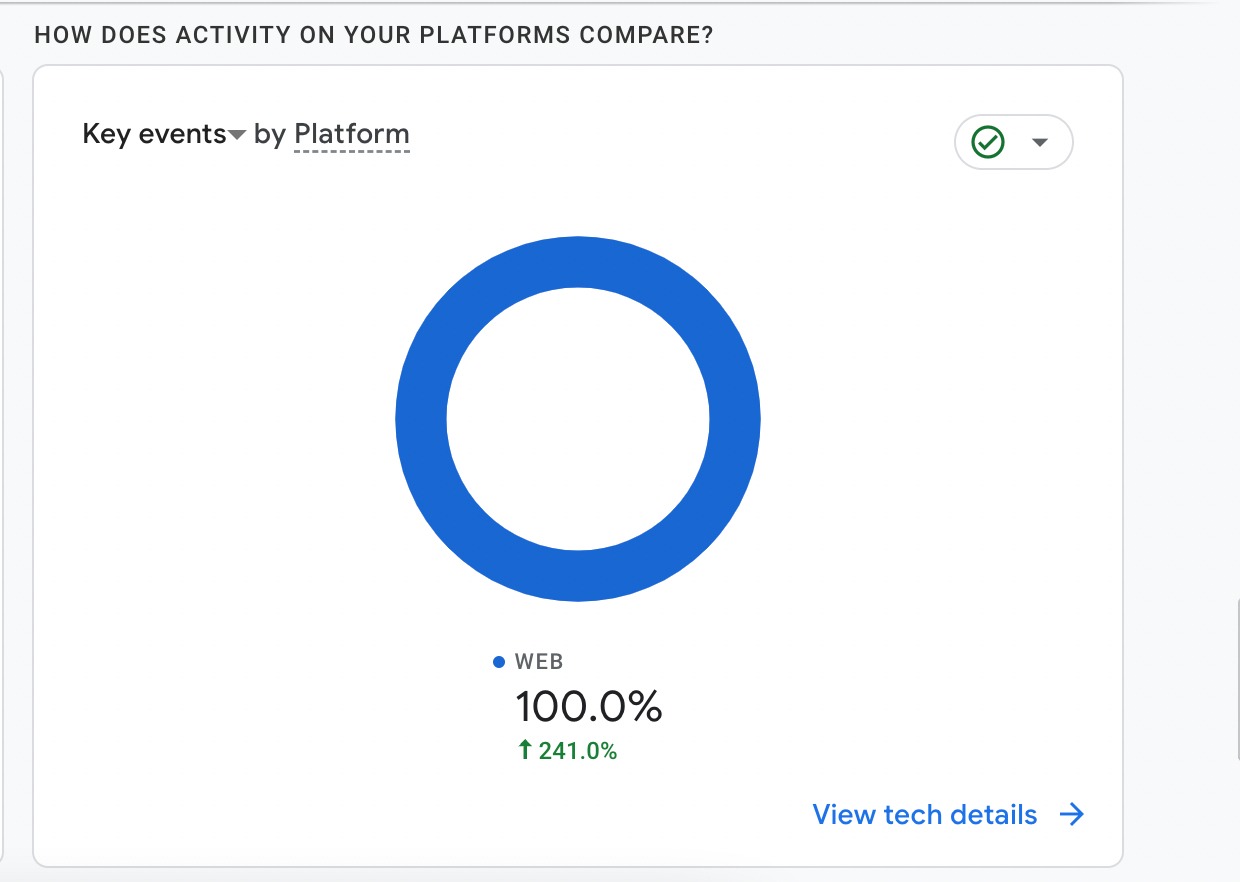
How Does Activity on Your Platforms Compare? Card
If you are tracking different platforms, such as Mobile App Activity, you can compare the performance of different platforms with the help of this card.
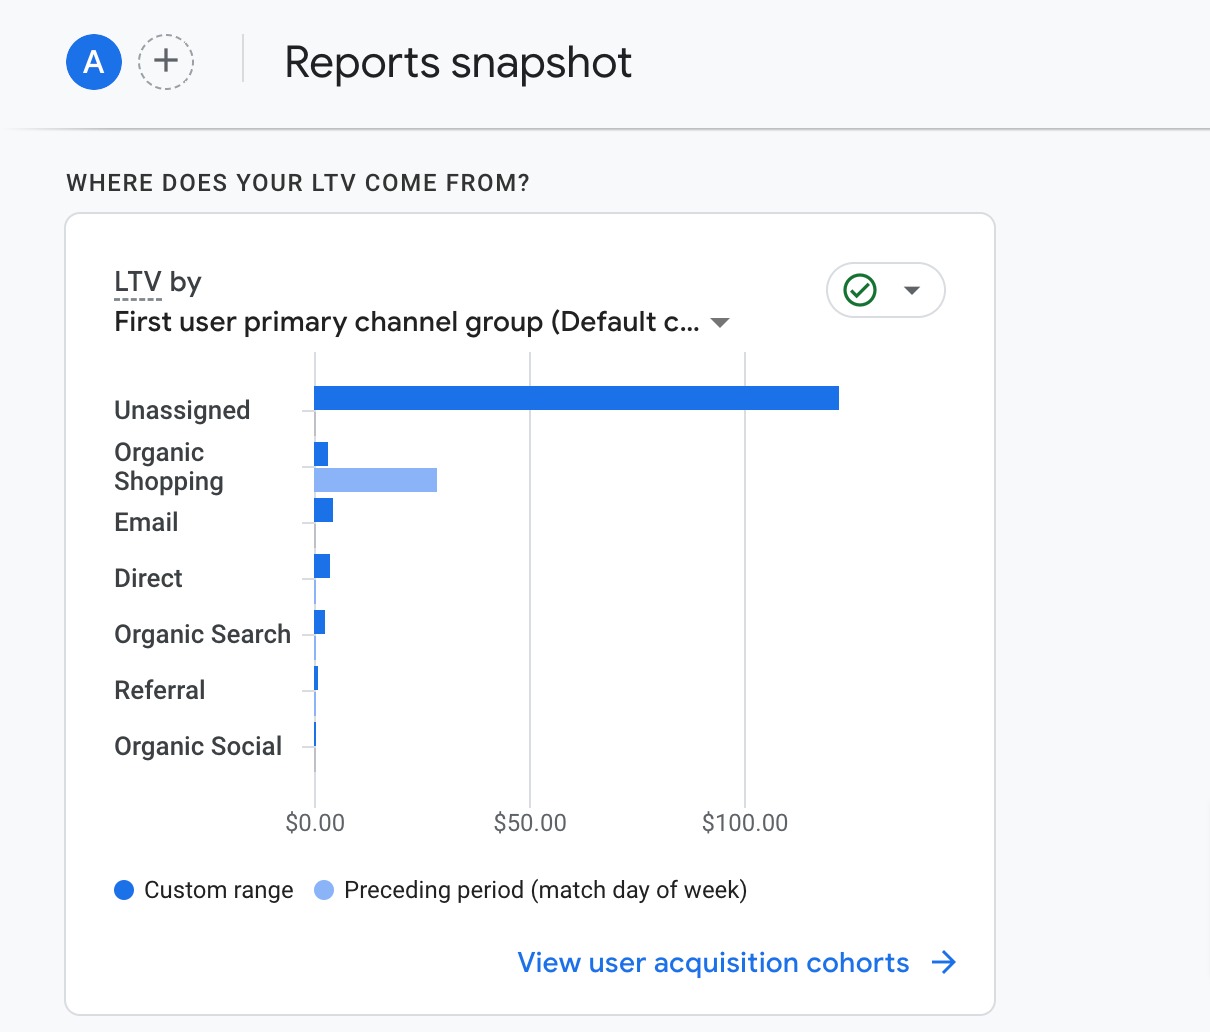
Where Does Your LTV Come From? Card
The last card on the list is the LTV card (lifetime value of a customer).
Essentially, it’s the total revenue a customer generates for your business over the duration of their relationship with you. This includes not only their initial purchases but also repeat business and their overall value over time.
Real-time Reports
Real-time reports allow you to monitor activity on your site in real time. This is useful for understanding the immediate impact of new campaigns, real-time user behaviour, and live monitoring of traffic spikes.
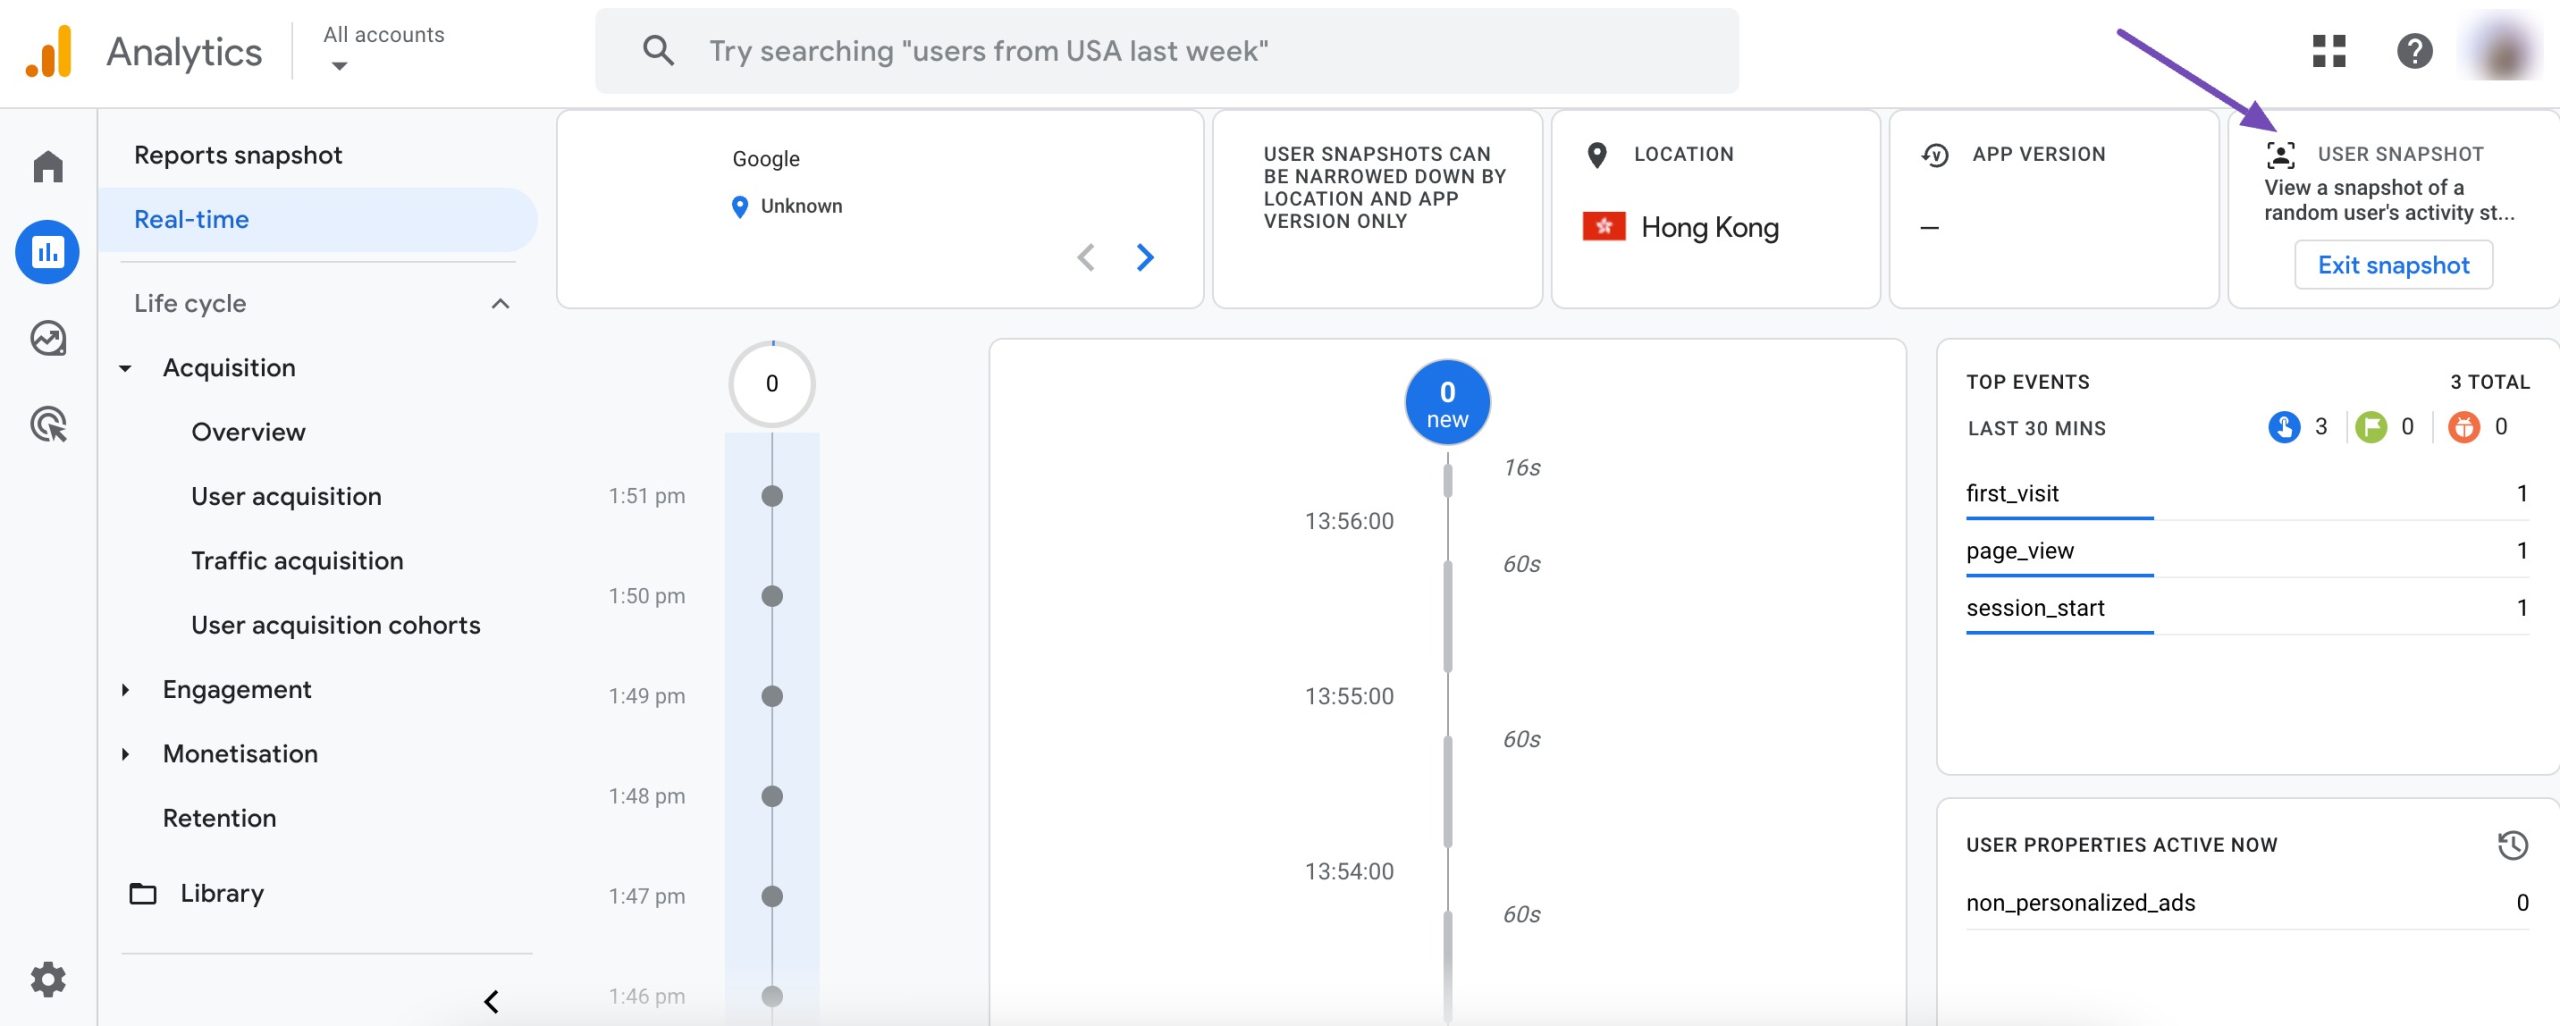
For instance, there were 3 users active on the site in the last 30 minutes. This number will keep changing constantly.
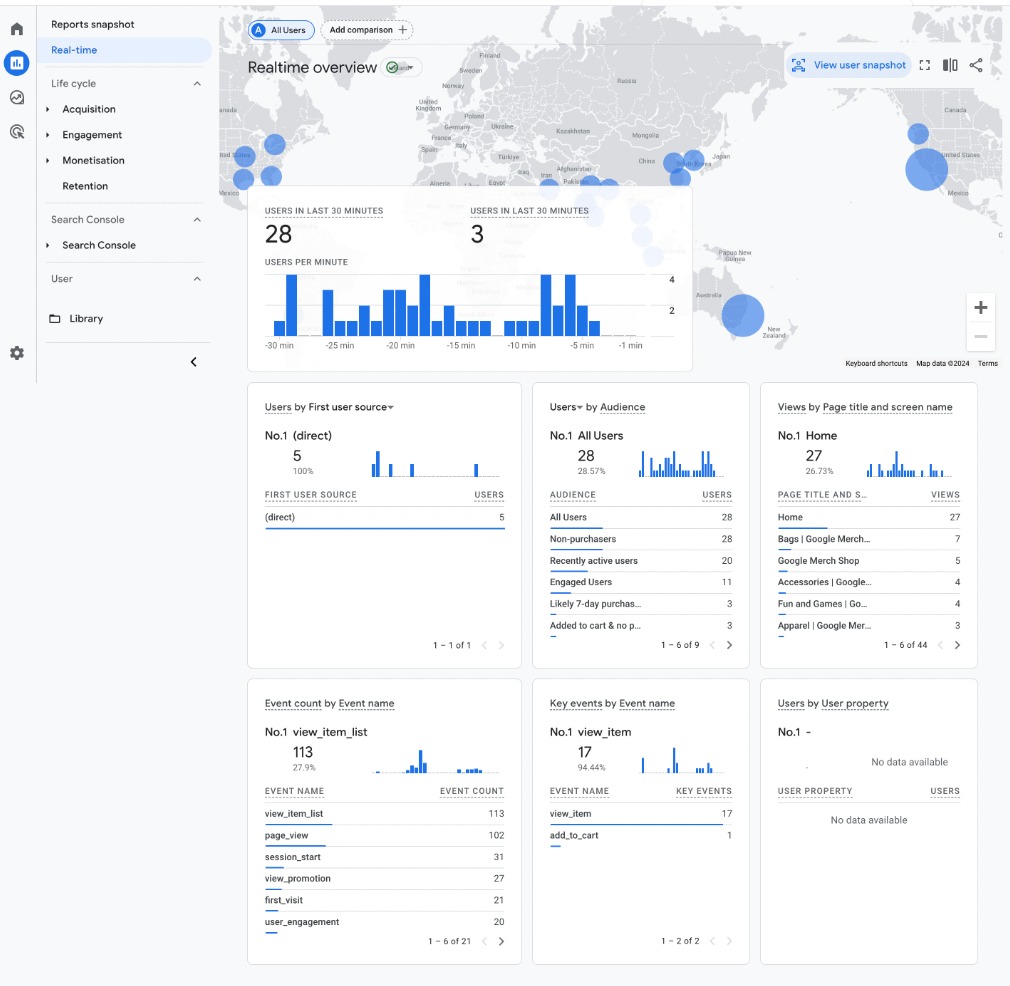
Next to the user reports, you’ll find the Users by First User Source section, which offers insights into the original channels through which users initially discovered your website or app.
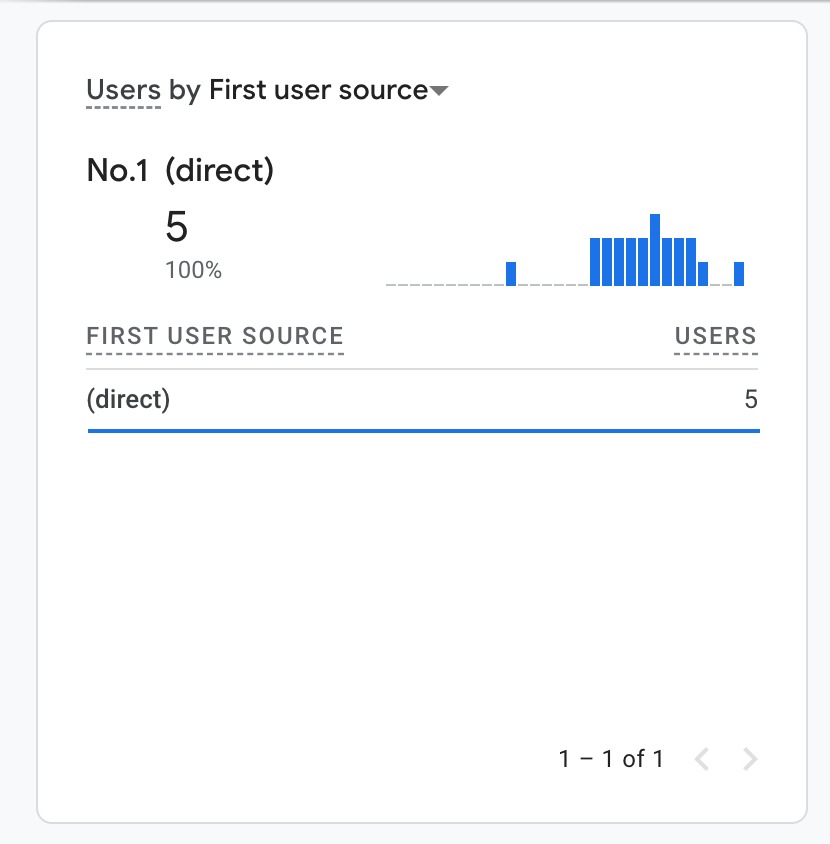
For instance, you’ll see 5 users arriving directly at the site.
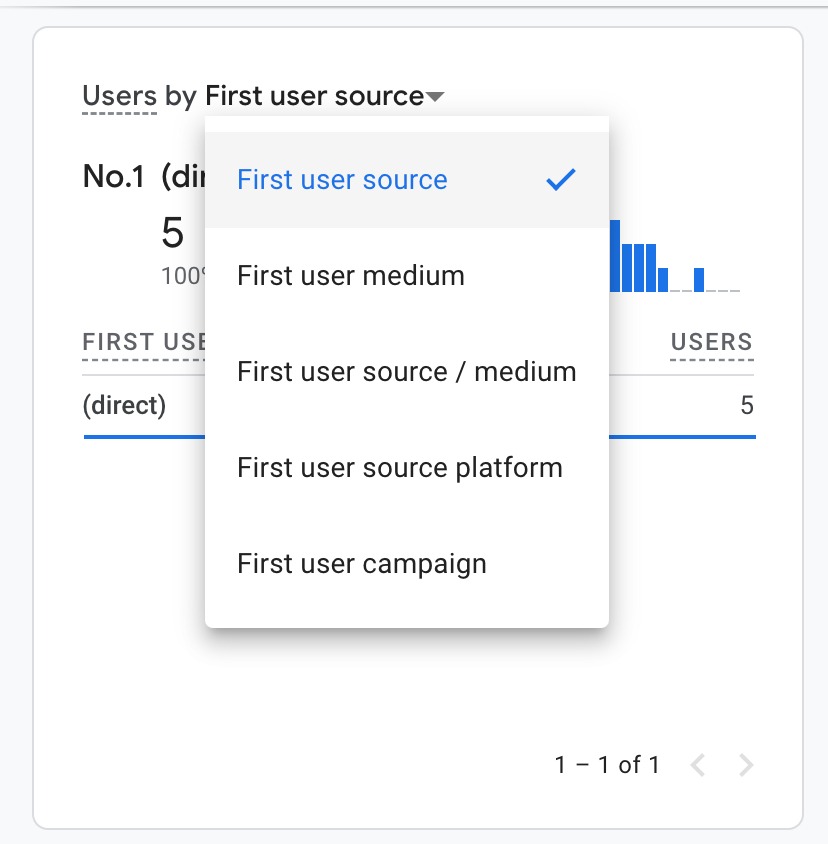
You can also choose the option which displays both the source and medium. The First user source platform option is similar to the First user source option, while the First User Campaign option shows users who arrived through specific ad campaigns.
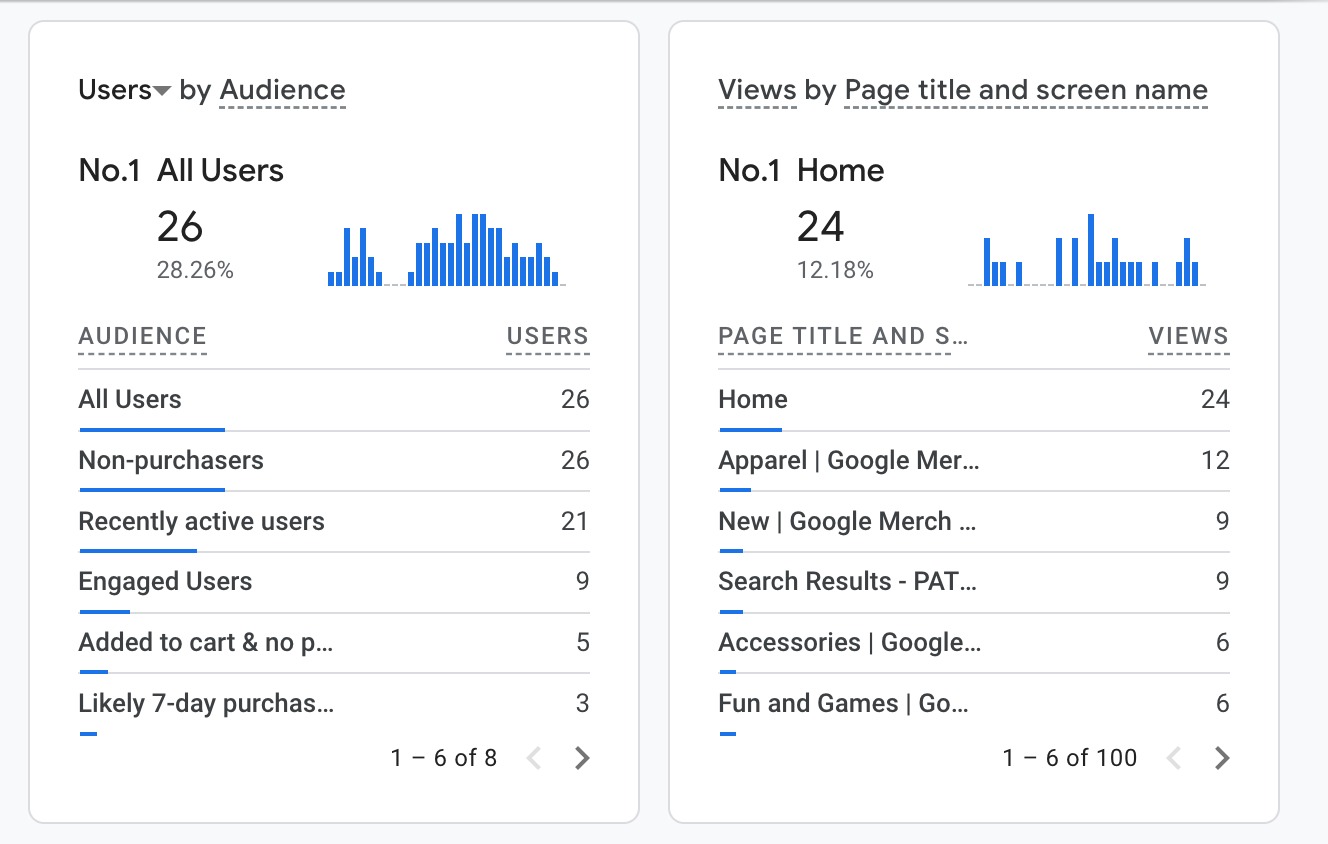
Moving on, Users by Audience presents data on recently active users, engaged users, users who added items to cart but haven’t made a purchase yet, and those who are already customers. Lastly, we have a real-time view of page views by title and screens, similar to what we saw in the Reports snapshot section.
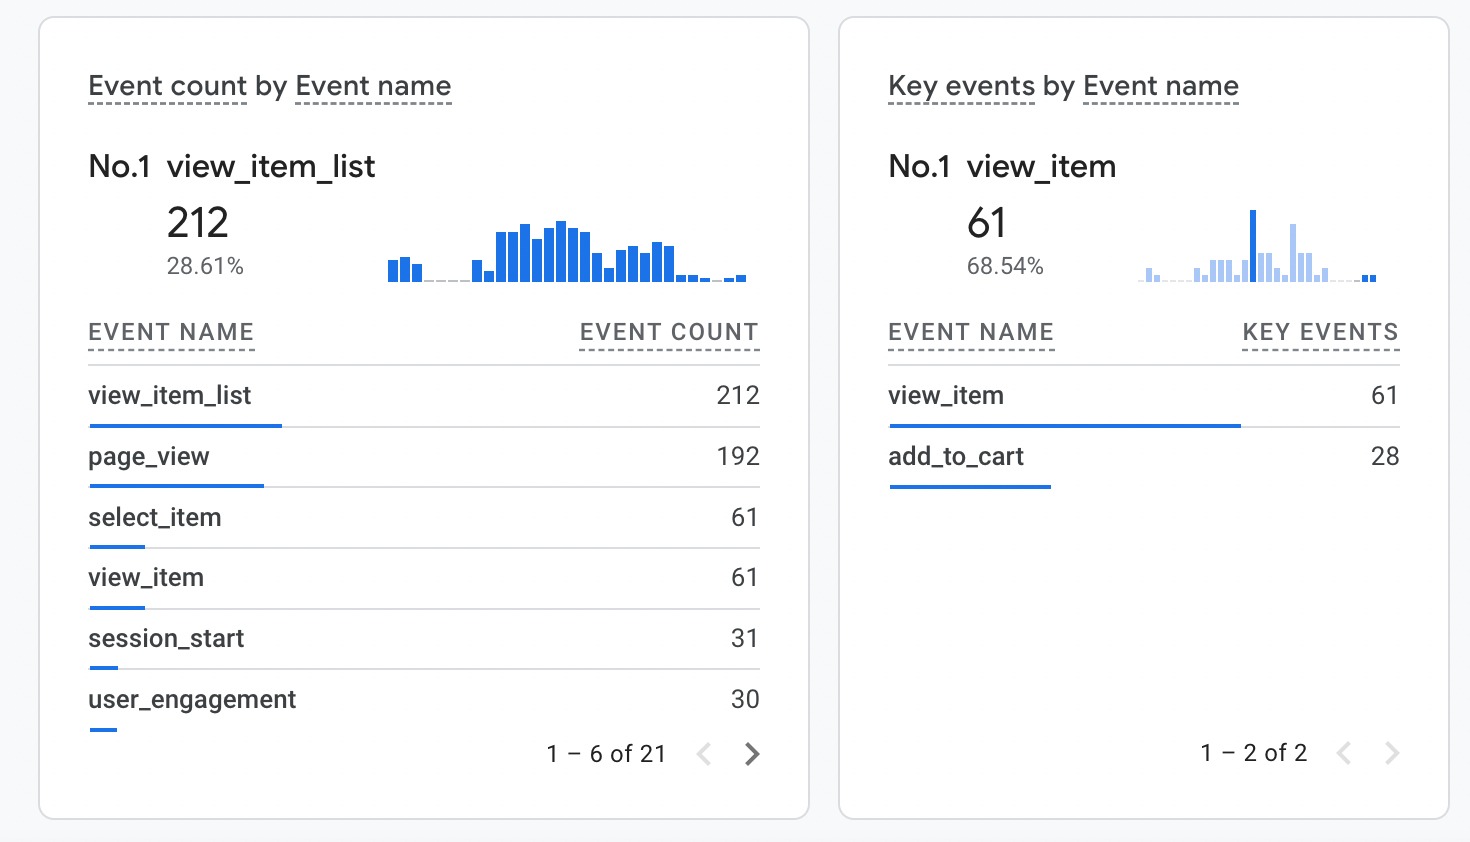
Similarly, there is an Event count by Event name, as well as Key events cards, which show the real-time data for the past 30 minutes.
If you want to see the events triggered by each user, click on View User Snapshot. This will show you which events a particular user has triggered in the last 30 minutes, along with their location and the time each event was triggered.
Life Cycle Reports
Life Cycle Reports in Google Analytics are designed to help you understand user behavior from acquisition to retention.
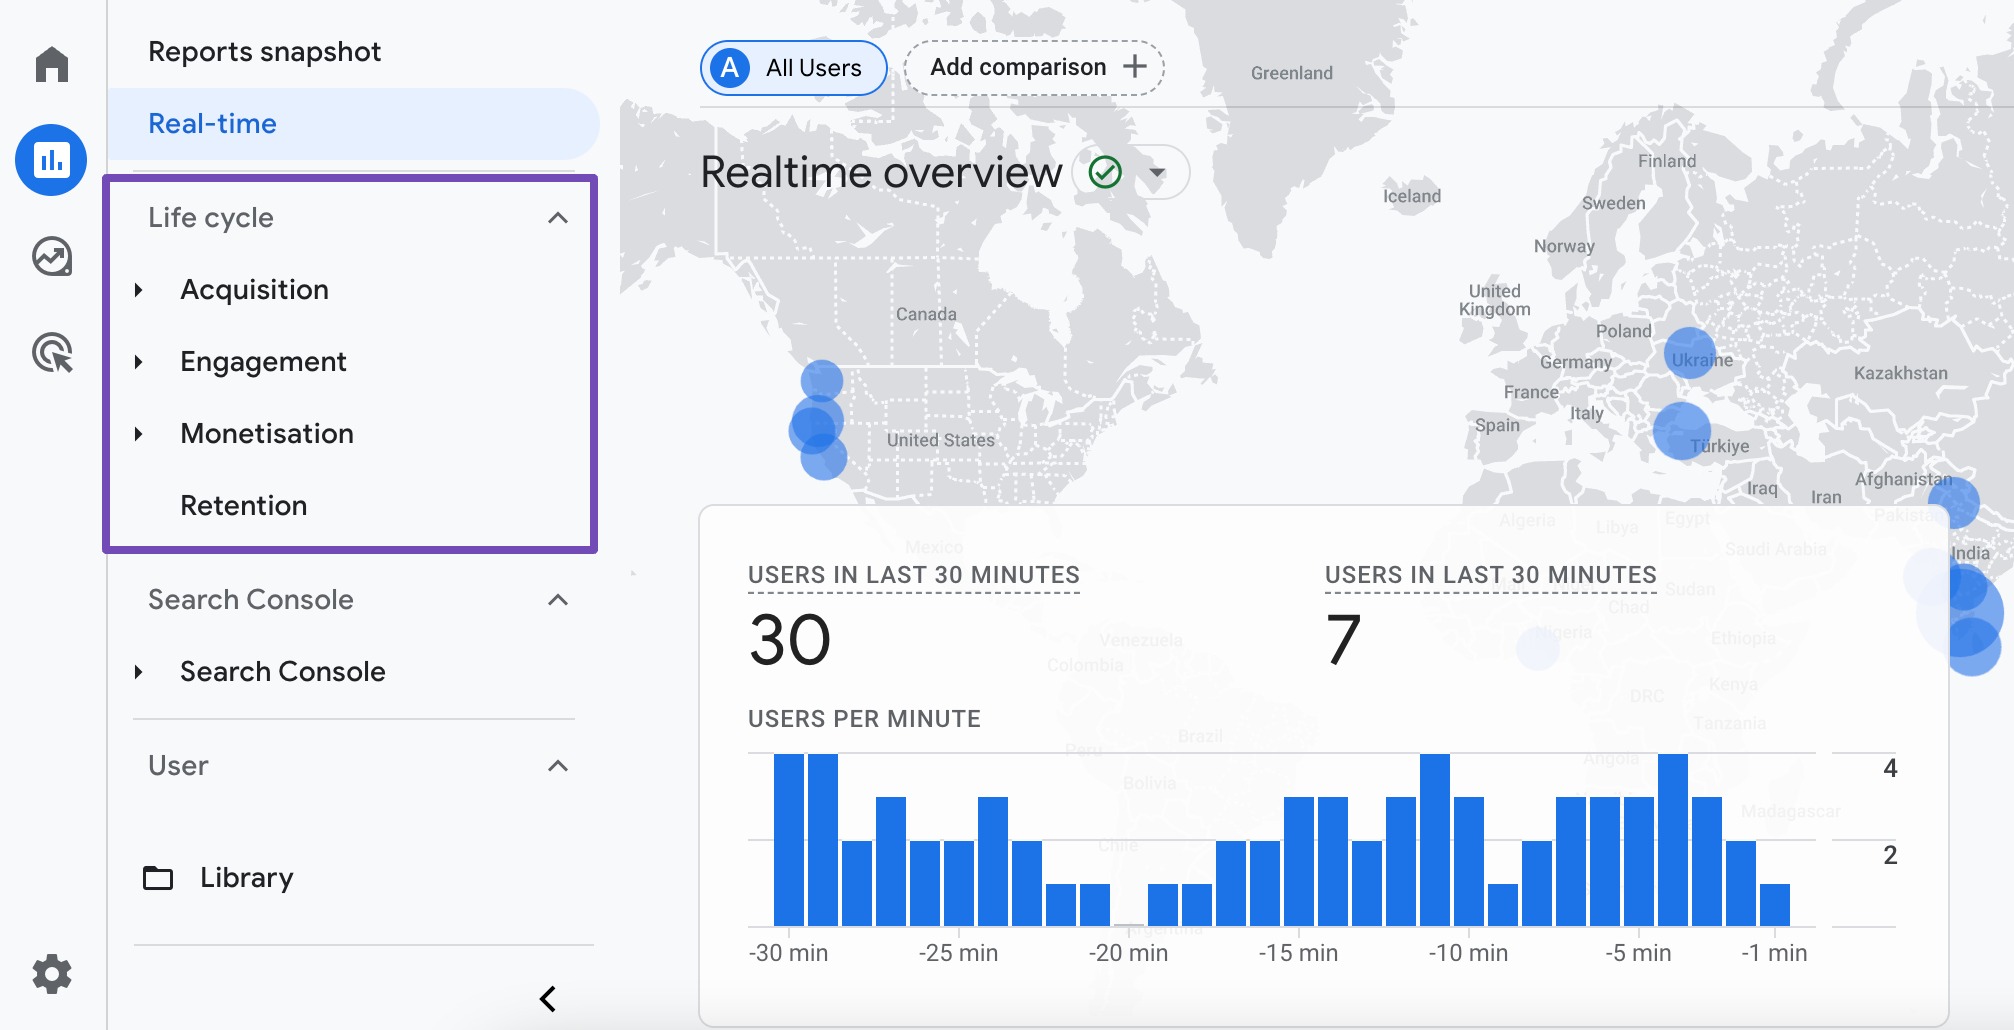
Key components include:
- Acquisition Reports: Show how users find your site, detailing the performance of various channels like organic search, paid ads, social media, and direct traffic.
- Engagement Reports: Highlight user interaction on your site, including metrics such as page views, session duration, and specific events triggered by users.
- Monetization Reports: Track revenue-related metrics, showing how much revenue is generated from different products or services, including e-commerce transactions and ad revenue.
- Retention Reports: Measure user retention over time, indicating how many users return to your site after their initial visit.
These reports collectively help you analyze and optimize user journeys, improve engagement, and increase conversions.
3.3 Explore Section in Google Analytics
The Explore section in Google Analytics allows you to create customized, in-depth reports and analyses. This section is designed for advanced users who want to dig deeper into their data beyond the standard reports.
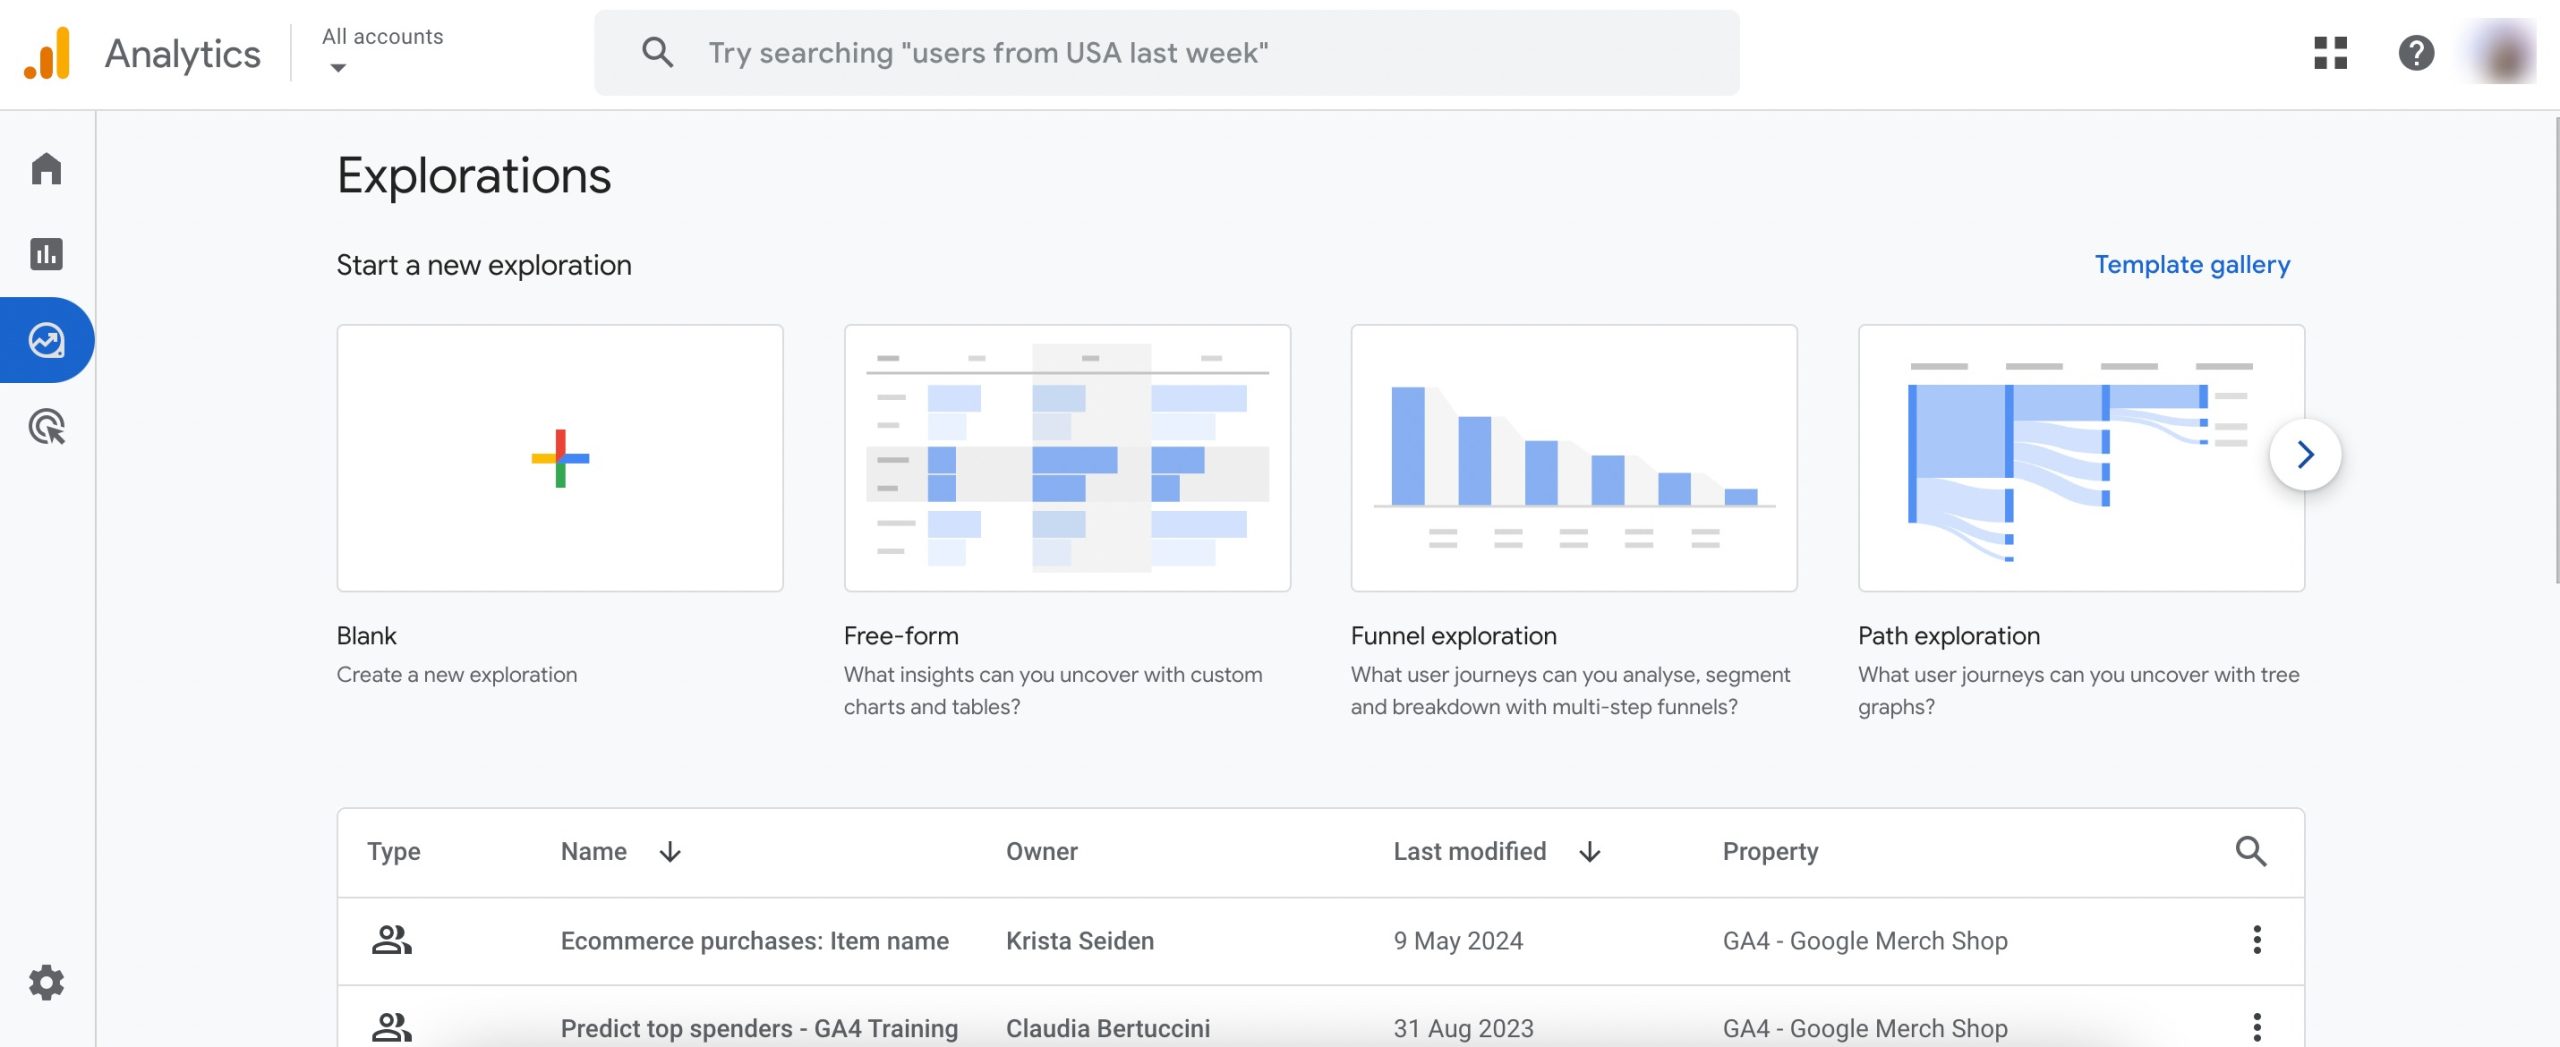
You have several exploration techniques to customize and analyze your data in detail. We’ve explained each one of them in brief:
- Blank: This is a starting point for creating a custom exploration from scratch. You can select dimensions, metrics, and segments without any predefined structure, giving you complete control over the analysis setup.
- Free-form Exploration: Allows you to build custom reports using a drag-and-drop interface. You can mix and match various dimensions and metrics to create pivot tables, cross-tab reports, and visualizations tailored to your specific analysis needs.
- Funnel Exploration: Visualizes the steps users take towards a conversion goal, showing where users enter, progress, and drop off in the funnel. This helps you identify bottlenecks and optimize the conversion process.
- Path Exploration: Displays the sequence of events or pages users interact with, illustrating common paths taken through your site or app. This helps you understand user behaviour patterns and identify potential areas for improvement in navigation and user flow.
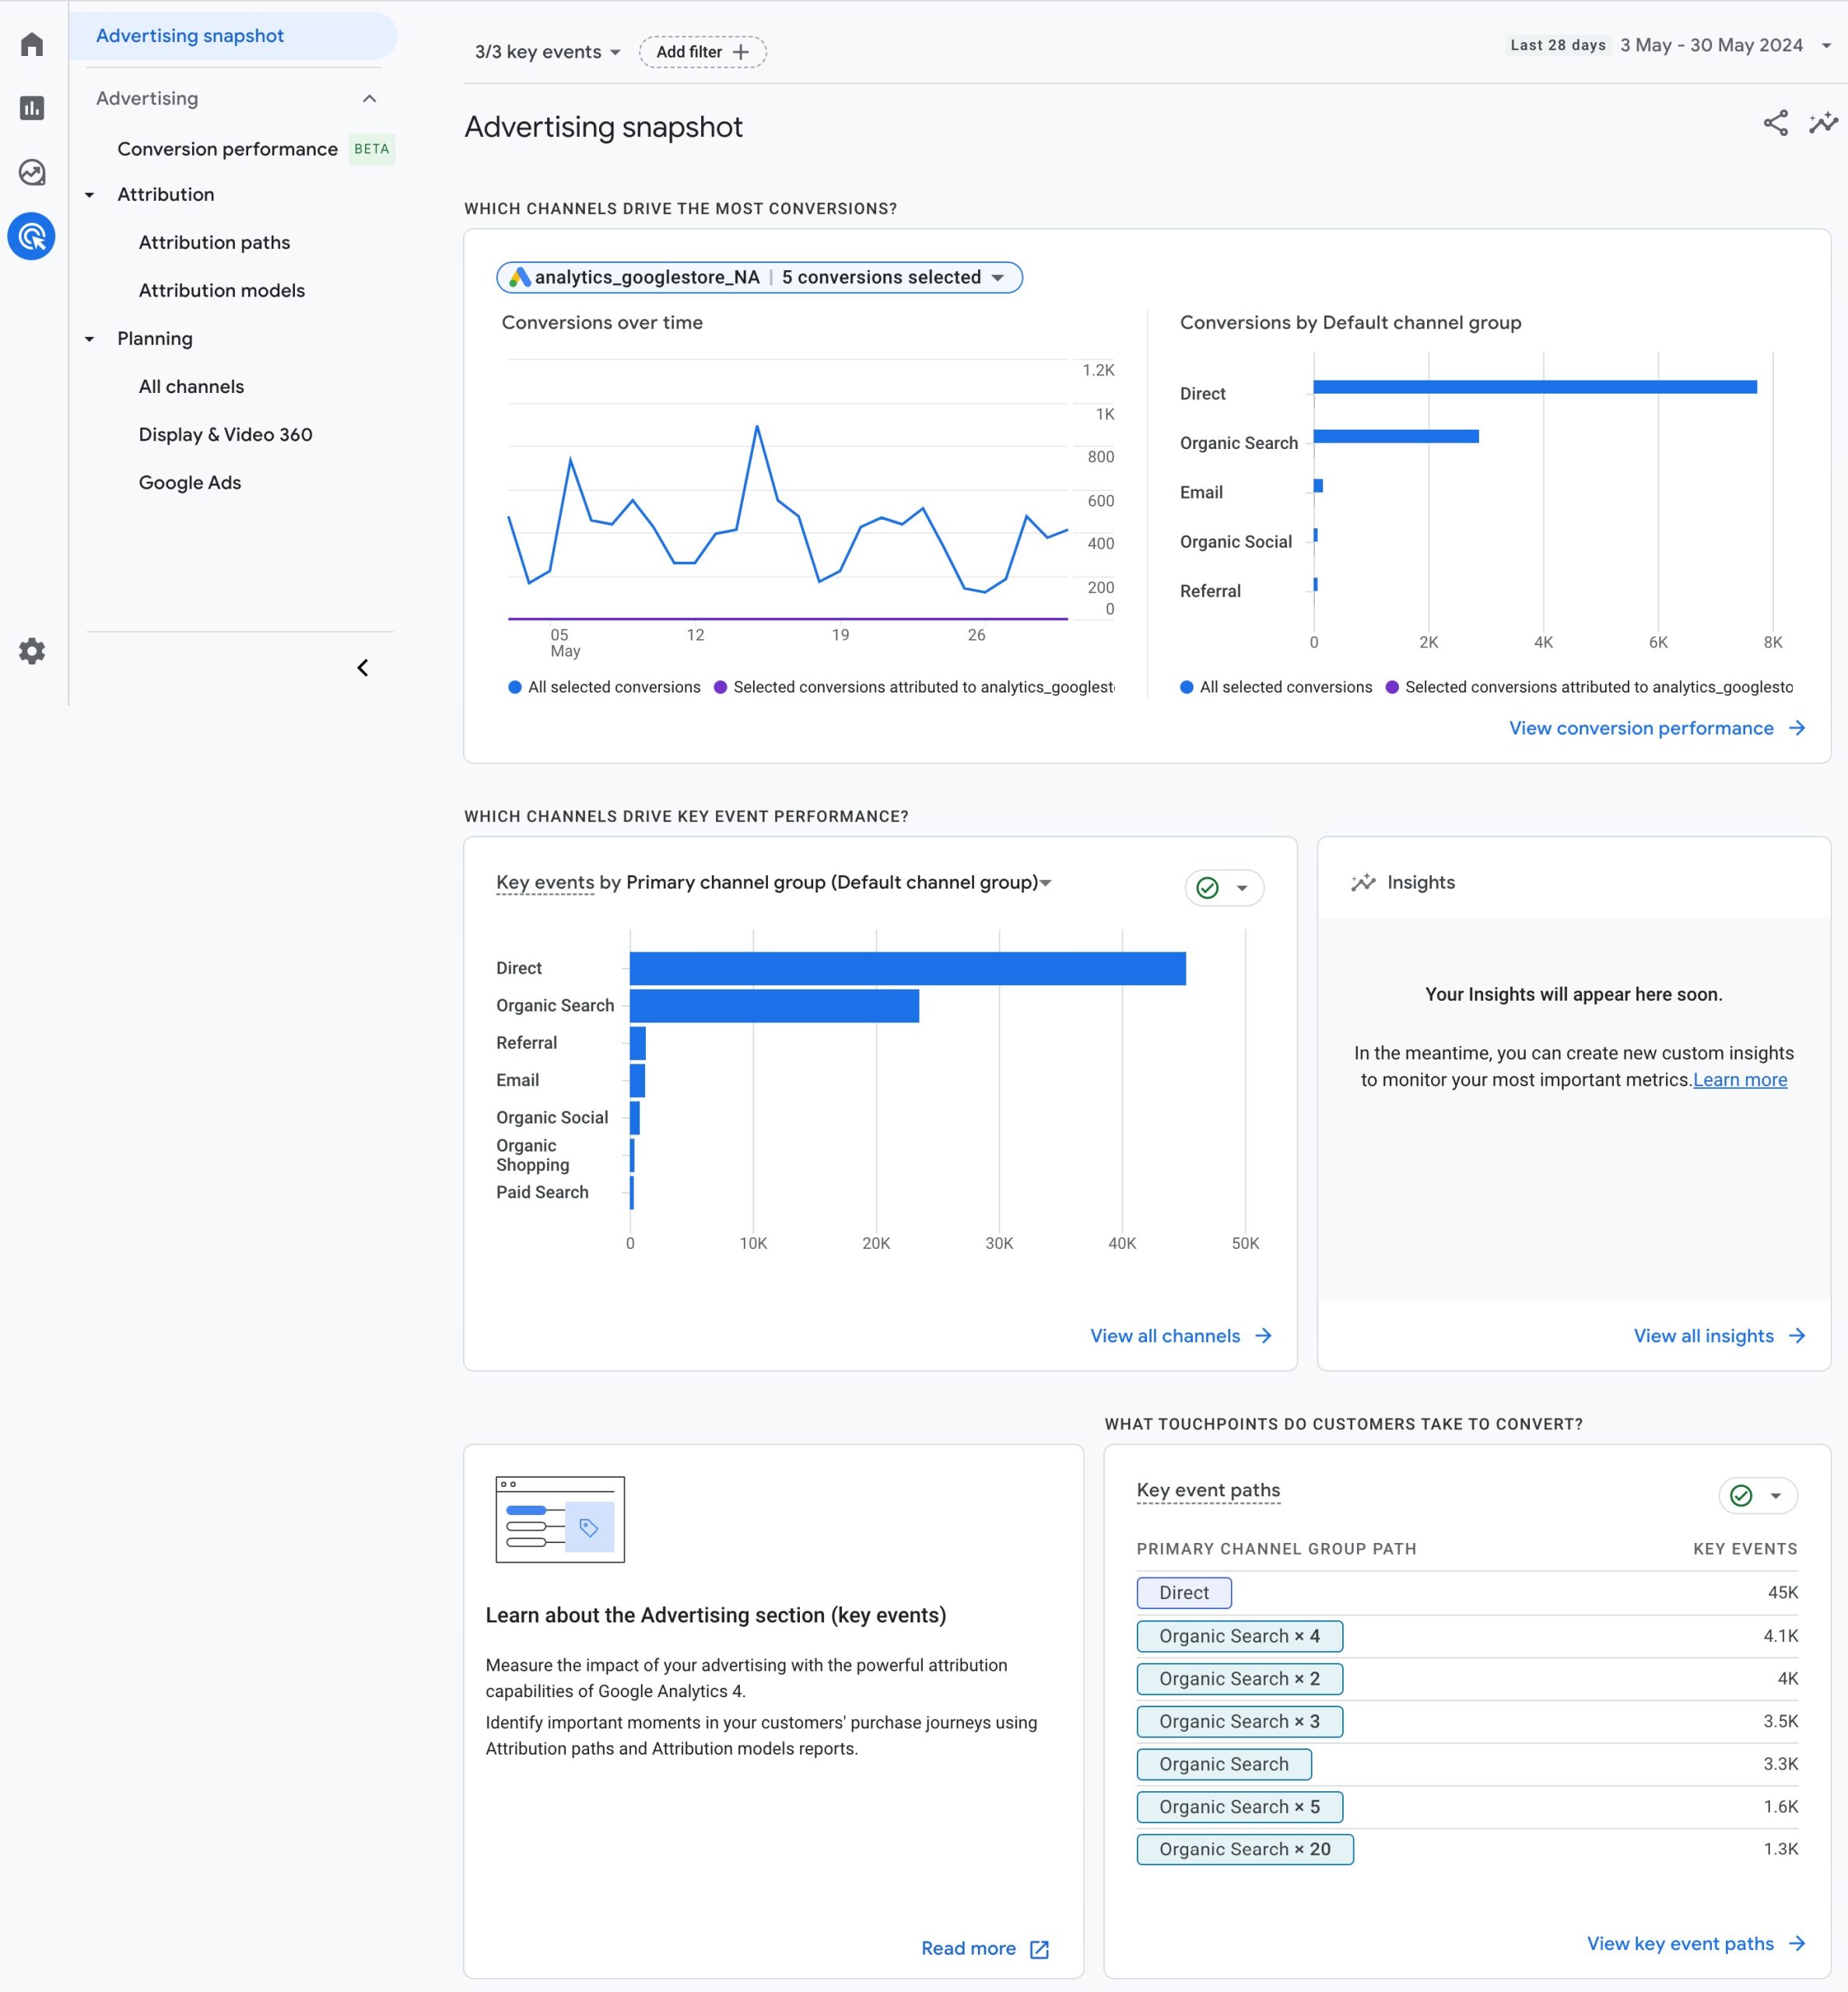
3.4 Advertising Section in Google Analytics
The Advertising Section in Google Analytics helps you track and analyze the performance of your advertising campaigns.
This section integrates data from various advertising platforms, providing a comprehensive view of how your ads are driving traffic and conversions.
4 Conclusion
Setting up Google Analytics might feel a little technical at first, but once you’ve gone through the steps, you’ll see how valuable it is.
With your account in place, you can start tracking who visits your site, what they do, and which areas need improvement.
The more you explore your reports, the better you’ll understand your audience and how to grow your website.
Take it one step at a time, and soon, checking your analytics will become a natural part of how you manage your site.
If you like this post, let us know by tweeting @rankmathseo.