If you’re looking to troubleshoot issues or optimize your WordPress site, enabling debugging is one of the first steps you should take.
Debugging helps you identify errors, warnings, and notices that may be affecting your website’s performance or functionality. By turning on WordPress debugging, you can gain clear insights into what’s going wrong, whether it’s a theme conflict, a plugin issue, or a PHP error.
In this post, I’ll share simple steps to enable debugging, allowing you to see exactly what’s going on under the hood of your WordPress site.
Table Of Contents
1 What is Debugging?
Debugging in WordPress is the process of identifying and fixing errors, warnings, or issues that affect your website’s functionality, performance, or appearance.
WordPress runs on PHP, and sometimes themes, plugins, or custom code can cause conflicts or generate errors that aren’t visible by default.
By enabling debugging, you can view detailed error messages, notices, and warnings that help you pinpoint exactly what’s going wrong.
This allows you to troubleshoot problems more effectively, whether it’s a broken plugin, a theme conflict, or a PHP issue, and ensures your website runs smoothly for both you and your visitors.
Note: Before enabling debugging in WordPress, ensure you have a site backup. You can easily restore your website to its previous stage if anything goes wrong during debugging. Refer to our dedicated tutorial on backing up the WordPress site.
2 Enable Debugging in WordPress
Let us now discuss the methods to enable debugging on your WordPress site.
2.1 Enable Debugging Using a Plugin
An easy way of enabling debug mode is by using the WP Debugging plugin. This method is recommended for beginners and those who are uncomfortable working with website files.
WP Debugging is a free WordPress plugin that works out of the box. By using this plugin, you won’t have to edit your website files manually.
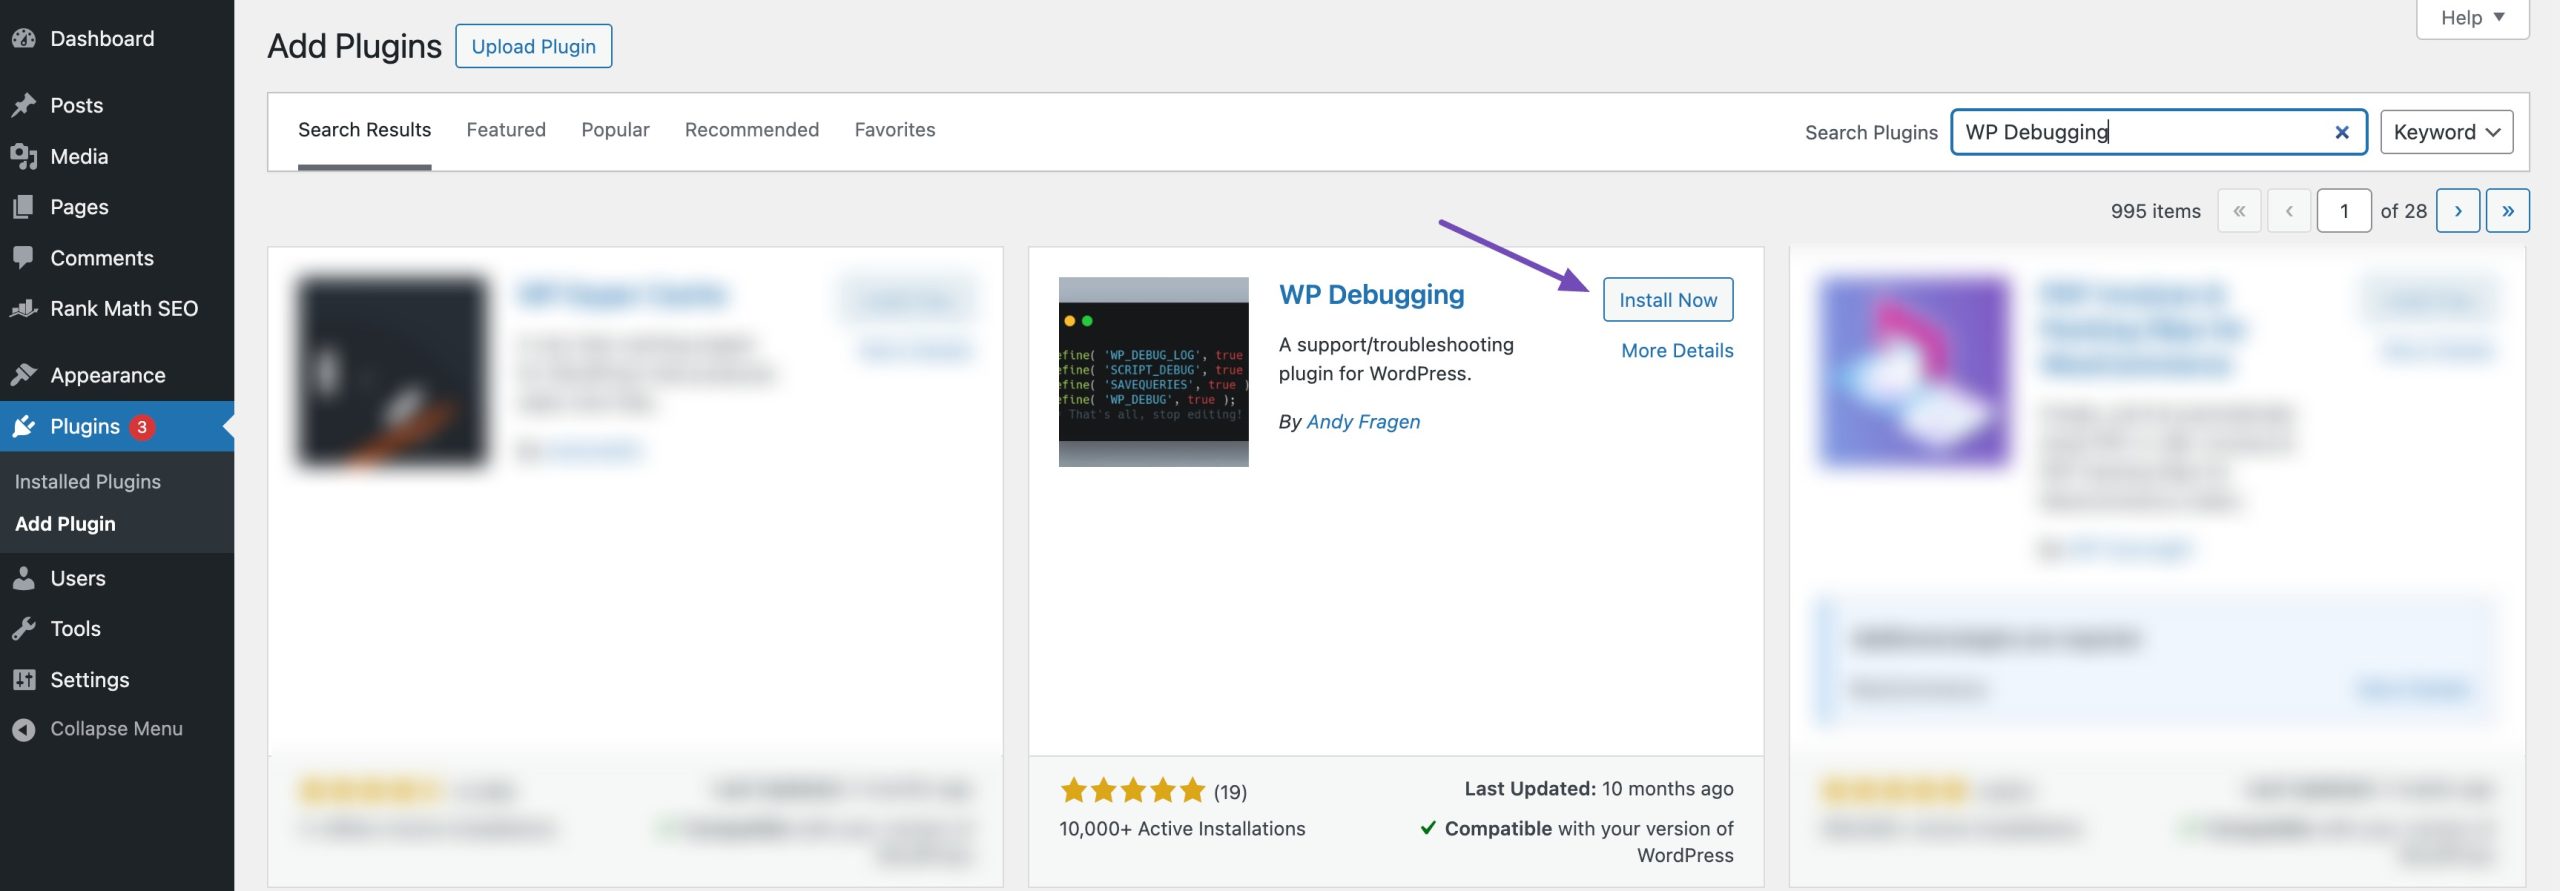
First, you’ll need to install and activate the WP Debugging plugin. Navigate to Plugins → Add Plugin section from your WordPress dashboard. Refer to our dedicated tutorial to install and activate the plugin in WordPress.
Search for the WP Debugging plugin and install and activate it.
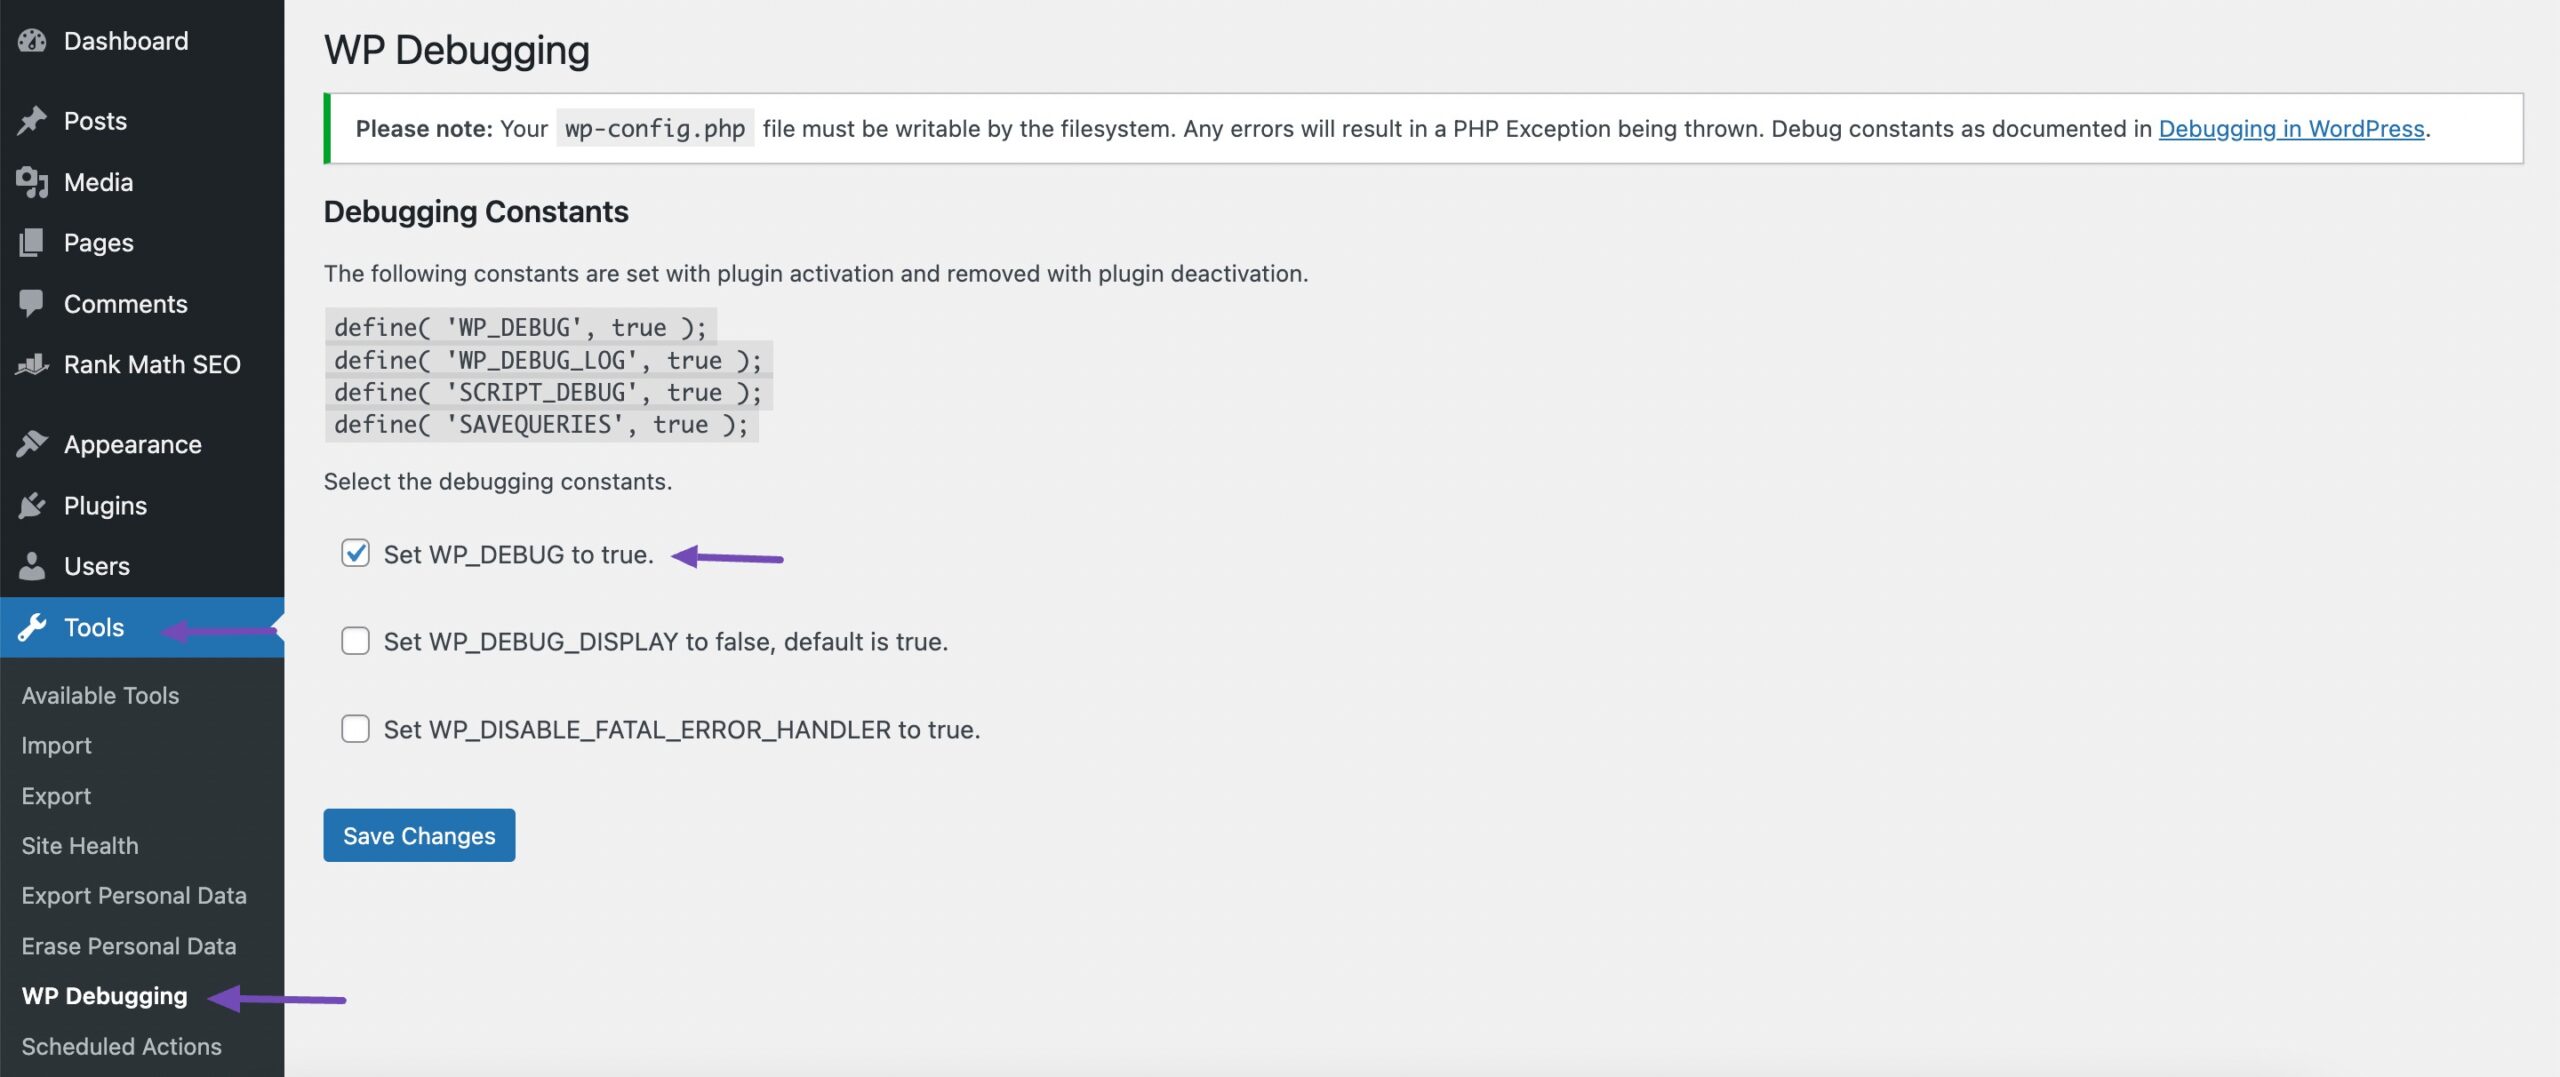
Upon activation, you can navigate to Tools → WP Debugging from your WordPress dashboard. Next, enable the Set WP_DEBUG to true option.
You’ll now see a Debug Quick Look option added to your admin bar at the top.
Hover over it and then click the View File option.
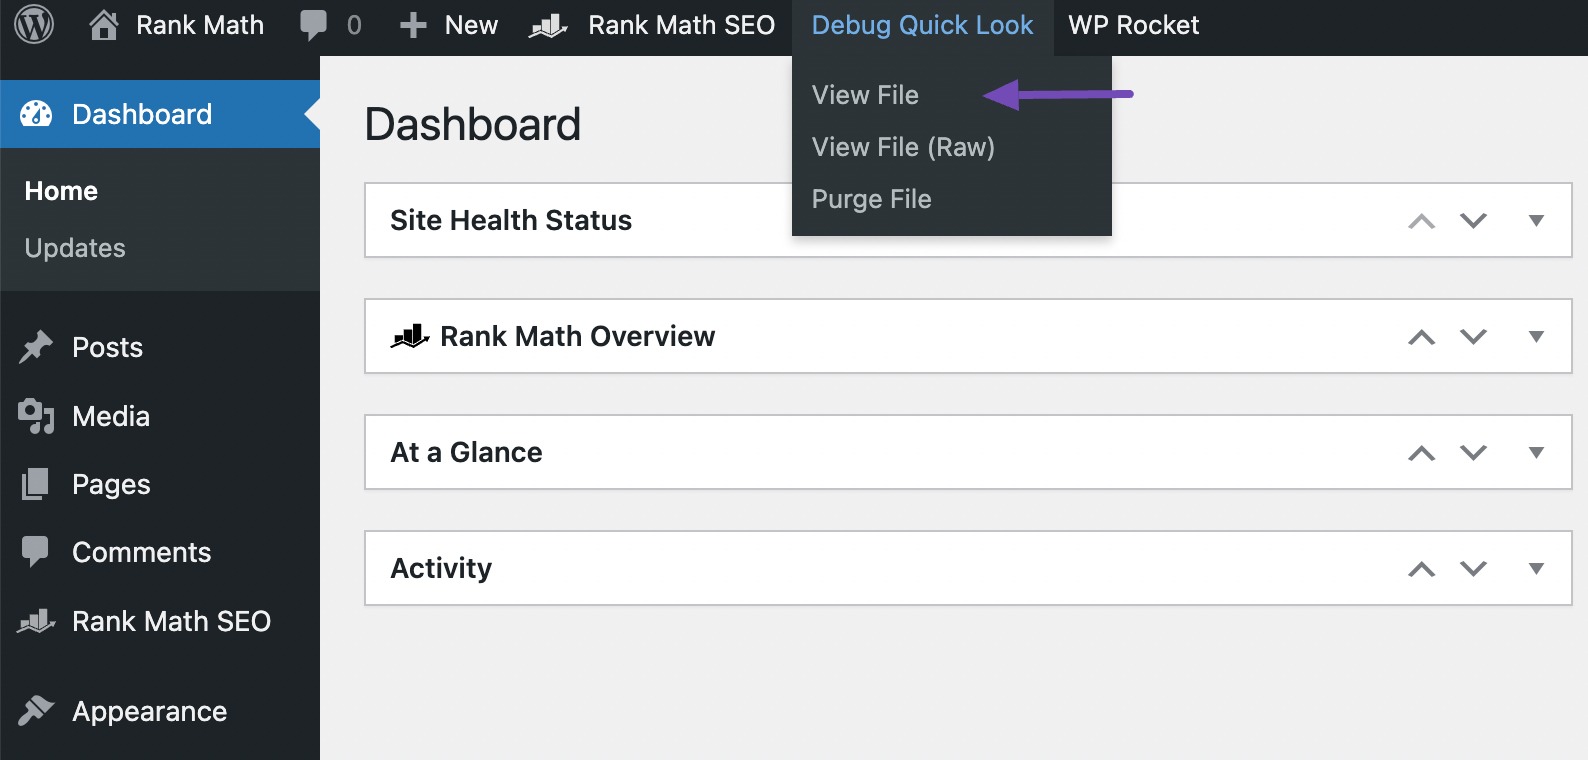
By doing this, you’ll access a log file containing all the errors on your website. This will allow you to pinpoint the root causes of any issues and resolve them promptly.
Once you’ve completed the debugging process for your website, remember to deactivate the plugin.
2.2 Manually Enable WordPress Debug Mode
You can manually enable debugging in WordPress, which involves editing a configuration file.
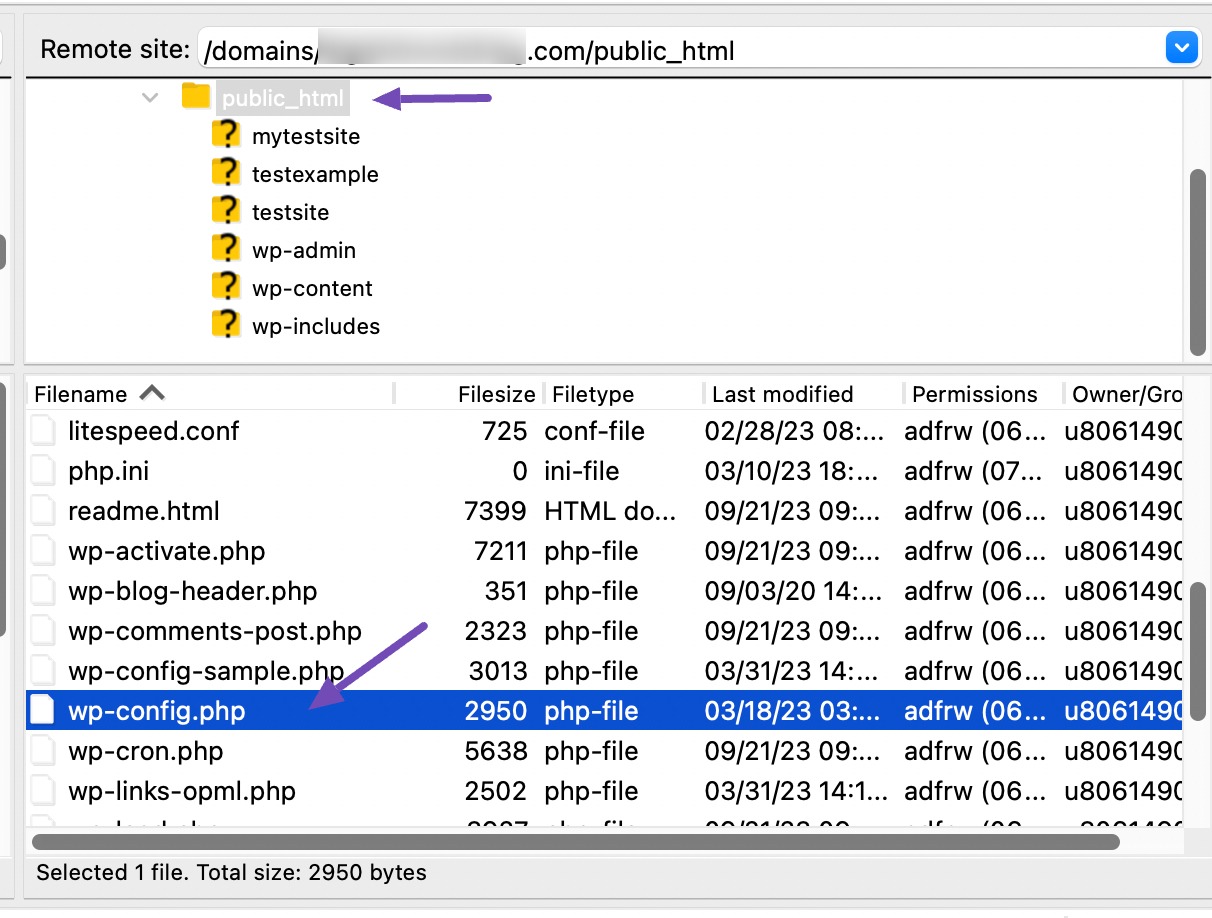
To begin with, you’ll need access to your WordPress website’s files. You can do this via FTP, like FileZilla or through your web hosting control panel.
Once you’re logged in, look for the wp-config.php file. You’ll find this file in the public_html folder.
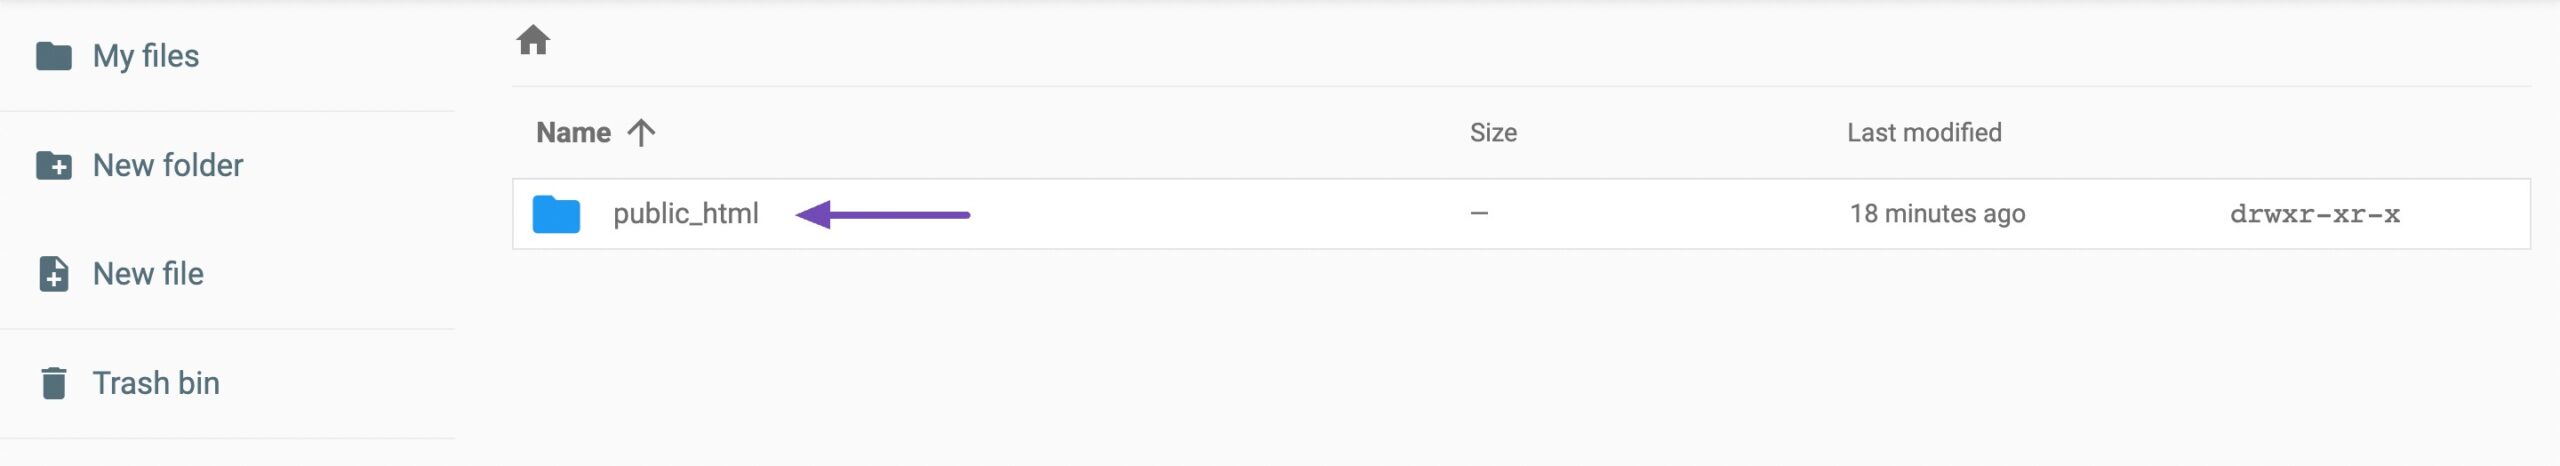
Alternatively, you can access the public_html folder from the File Manager in your web hosting control panel.
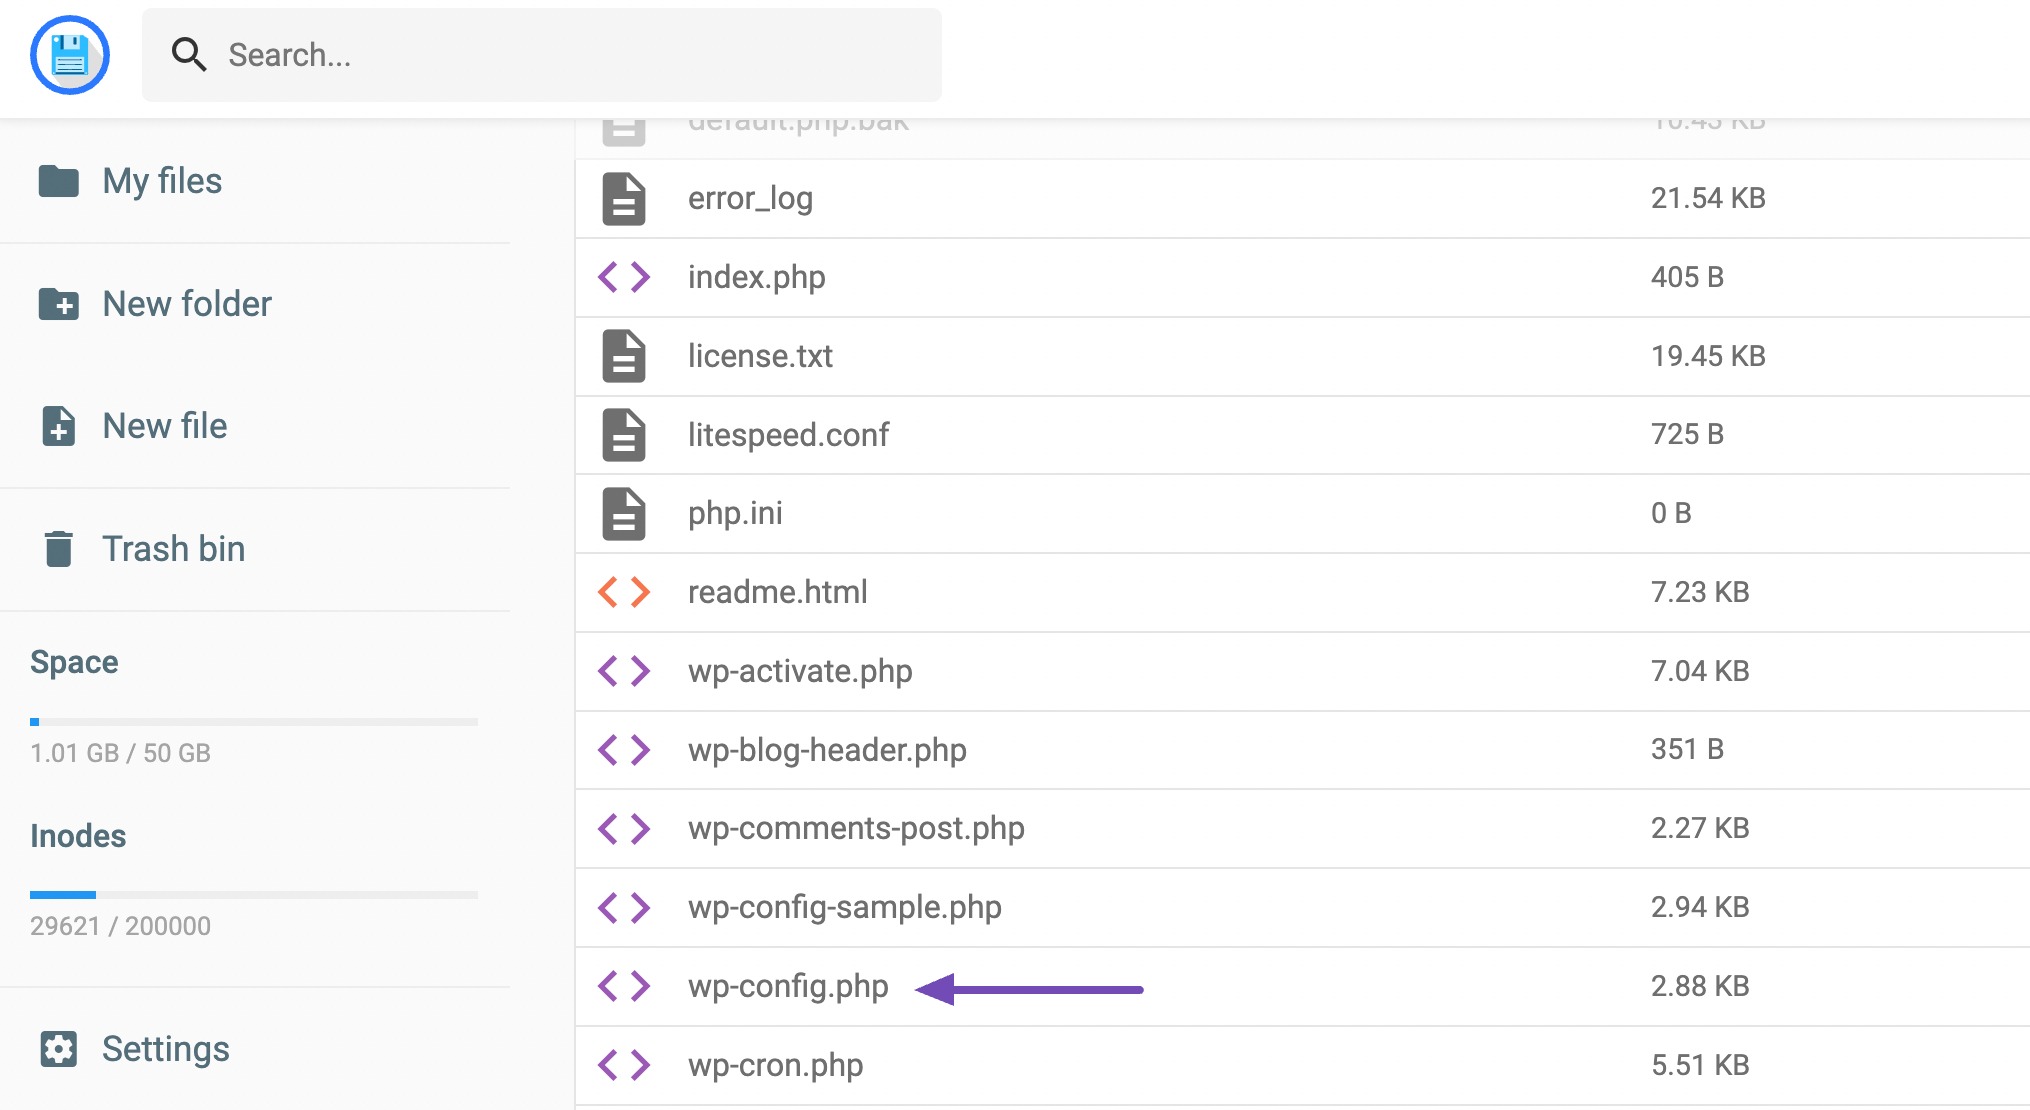
Scroll down to the wp-config.php file.
Before making any changes to the wp-config.php file, it’s important to create a backup of it. To do so, right-click the file and download it to your computer. This backup acts as a safety net in case anything goes wrong during the process.
Next, open the file using a text editor(such as Notepad on Windows or TextEdit on Mac).
Once the file is open, scroll down to the ‘That's all, stop editing! Happy publishing‘ line and add the following code before that:
define( 'WP_DEBUG', true);
define( 'WP_DEBUG_LOG', true); 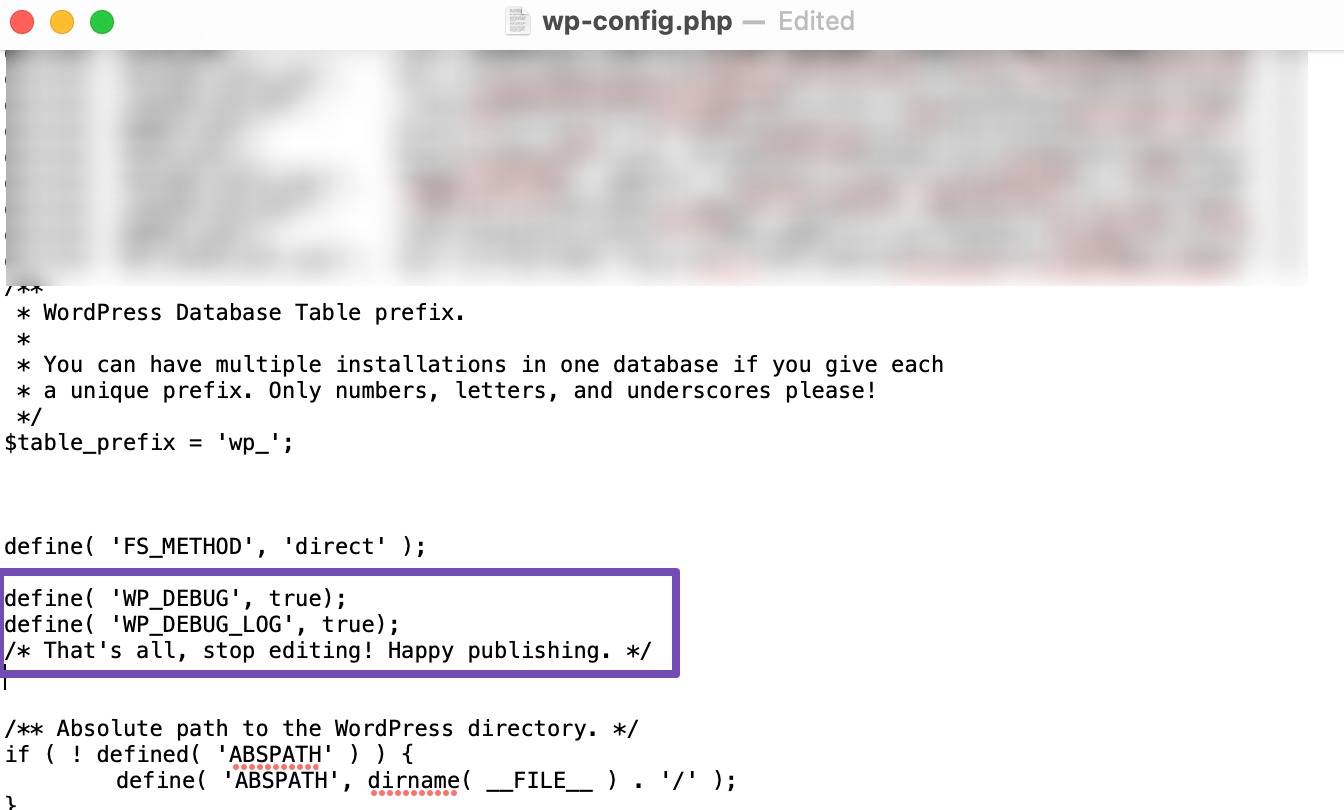
Save the file and upload it back to your server using the FTP client.
With debugging enabled, any errors on your website will now be displayed or logged. You can view these errors in a debug.log file located at https://yoursitename.com/wp-content/debug.log.
Note: The URL to access the debug.log file can vary depending on your website’s setup. For instance, if your website is installed in a subdirectory, the main URL to access the log might resemble this: https://yoursitename.com/your-subdirectory-name/wp-content/debug.log. If you’re uncertain about locating this file, don’t hesitate to contact your hosting provider for guidance.
After you’ve resolved the issues on your website, it’s a good practice to disable debugging. To do so, return to the wp-config.php file and remove the code you added or edit the following code to have a false value.
define( 'WP_DEBUG', false);Save the changes and upload the file back to your server.
4 Conclusion
Debugging your WordPress site is essential for keeping your website healthy and running smoothly. It helps you quickly identify and fix issues before they affect your visitors.
Whenever you encounter problems, follow the steps outlined in this post. Debugging can be your go-to tool for resolving issues and improving your site’s performance. By using it regularly, you’ll ensure a more stable and reliable WordPress experience.
If you like this post, let us know by tweeting @rankmathseo.