Massive movements in search results occur regularly, and they are nothing but signs of a possible change in Google’s search engine algorithm. Since SEO requires continuous effort, you should keep track of these Google search updates to evaluate if your site has performed well or declined after each update.
Thankfully Rank Math integrates the Google search updates timeline into your Analytics graphs so that you can stop doing the guesswork around evaluating search performance and keep yourself updated with what’s happening around in search.
In this knowledgebase article, we will show you how you can take advantage of the Google search updates timeline in Rank Math’s graphs to understand your site’s performance after each update so that you can take action to improve your website’s SEO further (whenever required).
Table of Contents
1 Google Search Updates
Google’s search algorithm includes hundreds of ranking factors to evaluate web pages so that the search engine can deliver the most relevant and useful results for search queries.
While the search engine continues to improve the search experience with regular updates, the major changes are pushed together as a core update, and the minor ones are pushed together as daily search algorithm updates.
These minor updates include rigorous testing, live traffic experiments, search quality tests, and side-by-side experiments aiming to improve specific search features or improve search relevancy matching without trying to have any adverse effect on the search engine ecosystem.
2 Google Search Updates Timeline in Analytics PRO
While the details of minor updates are most likely not disclosed, for the major search updates, with guidelines being provided, you must check their effects on your website.
Rank Math brings all these Google search updates right inside your WordPress dashboard along with your Analytics data for visualization so that you can stop doing the guesswork and get to know if your website is unharmed, scored big, or lost huge traffic after every search update – let’s get started.
2.1 Enable Analytics Module
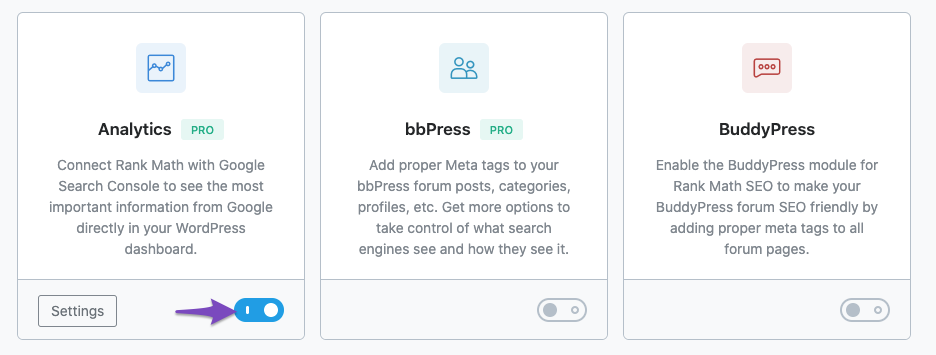
The search updates timeline is available only in the Analytics module of Rank Math’s PRO version. If you haven’t already enabled the Analytics module, then head over to WordPress Dashboard → Rank Math SEO. From the list of available modules, enable the Analytics module as shown below.
2.2 Connect Your Google Account With Rank Math
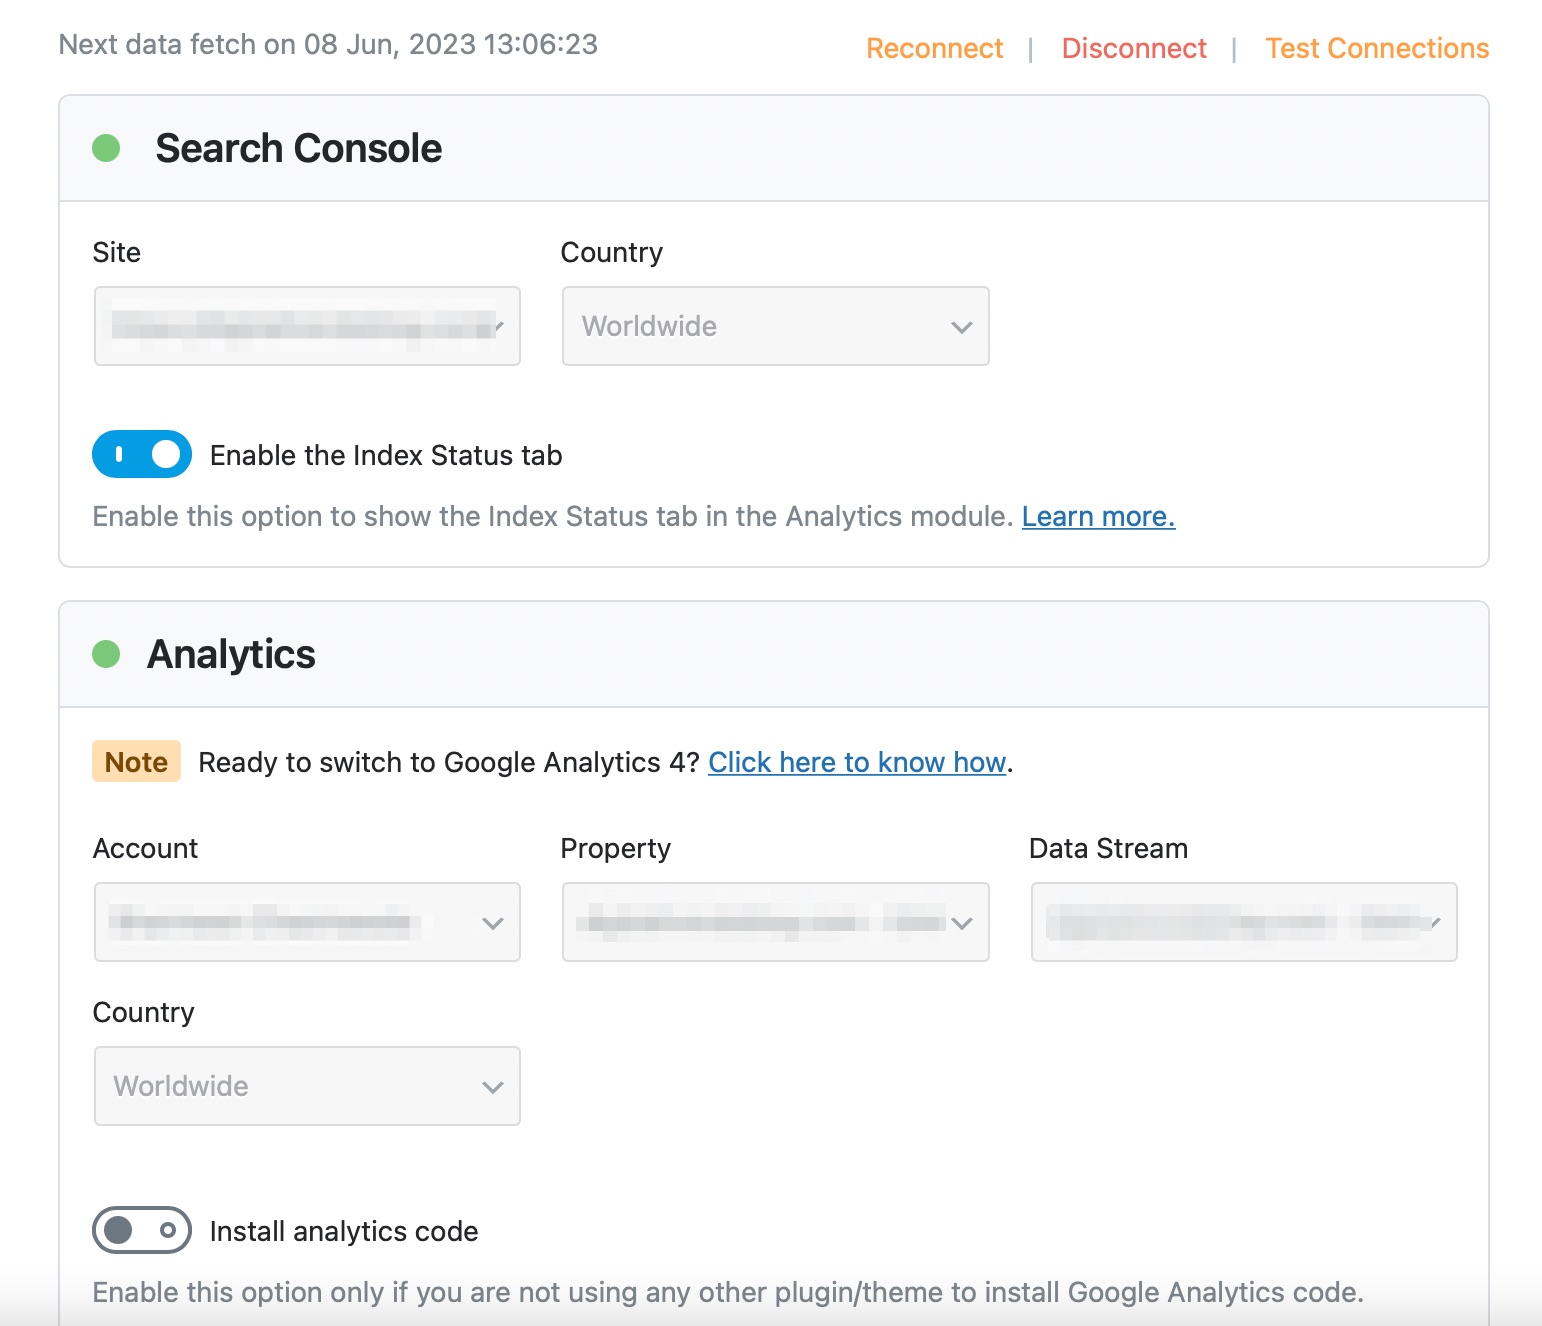
Once you’ve enabled the Analytics module, you need to connect your Google account with Rank Math SEO under Rank Math SEO → General Settings → Analytics. You can refer to our dedicated knowledgebase tutorial here to connect your Google account with Rank Math.
2.3 Access Rank Math Analytics
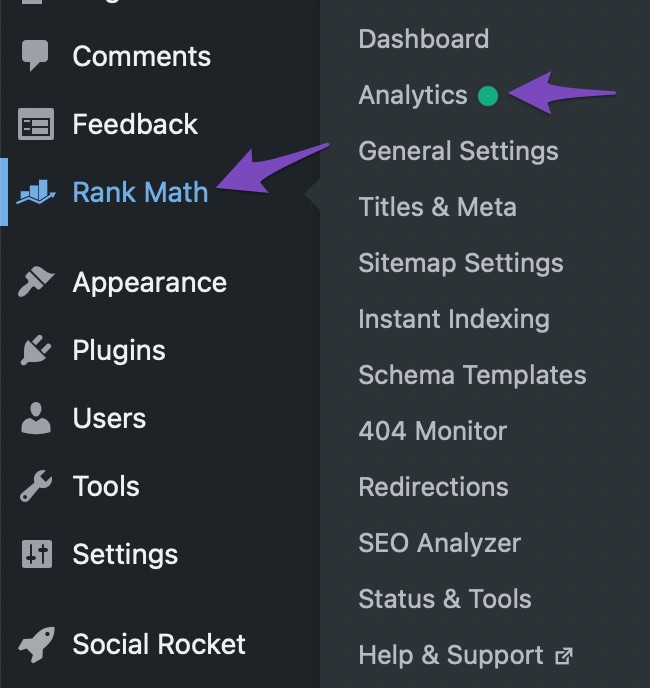
Now that you’ve configured the Search Console and Analytics property of your website under Analytics settings, you can access the Analytics module under the Rank Math menu in your WordPress admin area.
2.4 Open SEO Performance
Inside the Analytics Dashboard, click the SEO Performance tab as shown below.
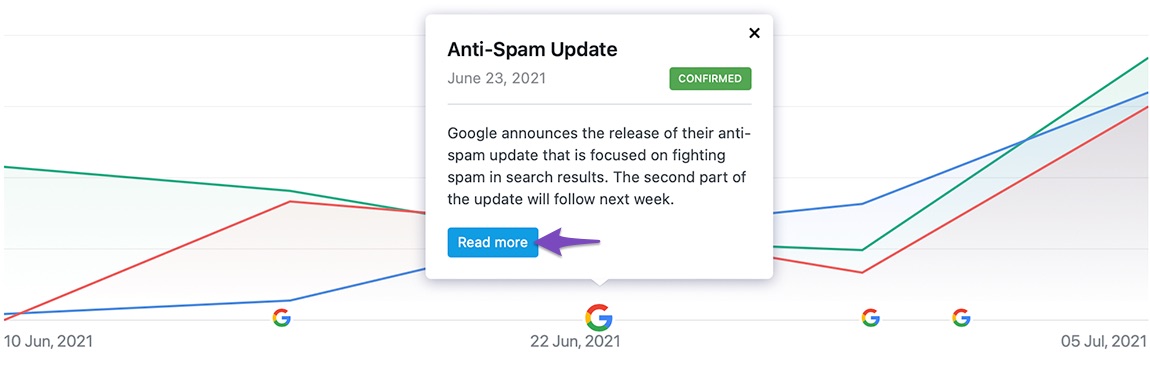
Now in the SEO Performance graph, you can notice some Google labels along the horizontal axis indicating any search engine algorithm updates in that period. You can click the Google icon to see a snippet with the details of that update.
The snippet will let you know when the update was rolled out, was it confirmed, and what were the changes brought by this update. You can click the Read more button to learn more about these updates at Rank Math.
Note: To keep your workflow smooth and avoid switching tabs, Rank Math includes the search engine timeline in all the Analytics graphs, including the one in the Keywords tab.
3 Understanding Analytics Data
The Analytics data in the SEO Performance graph can also be tailored to display only the essential data, making it easy to interpret. Let us look into the options you can use to build the SEO Performance graph with your requirement.
3.1 Comparing Metrics
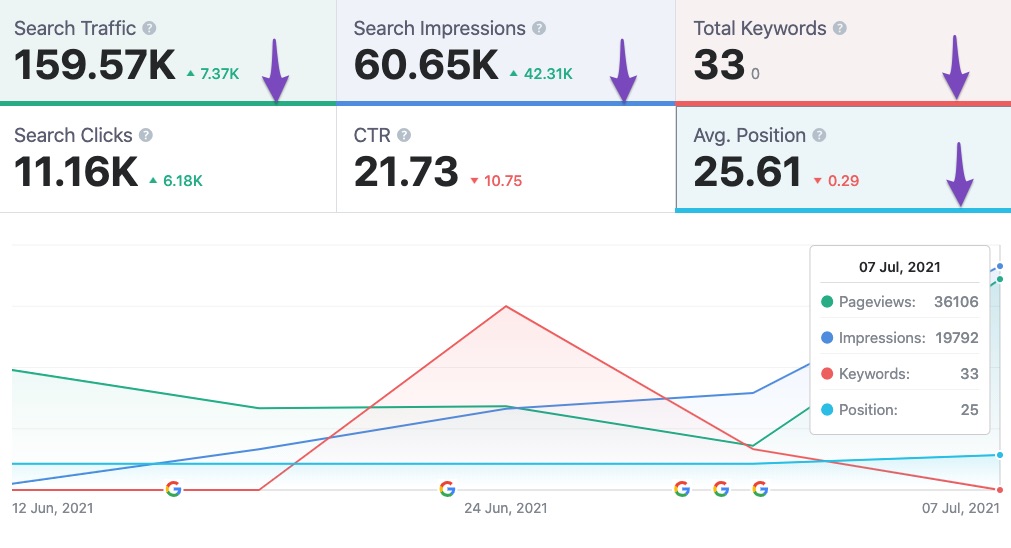
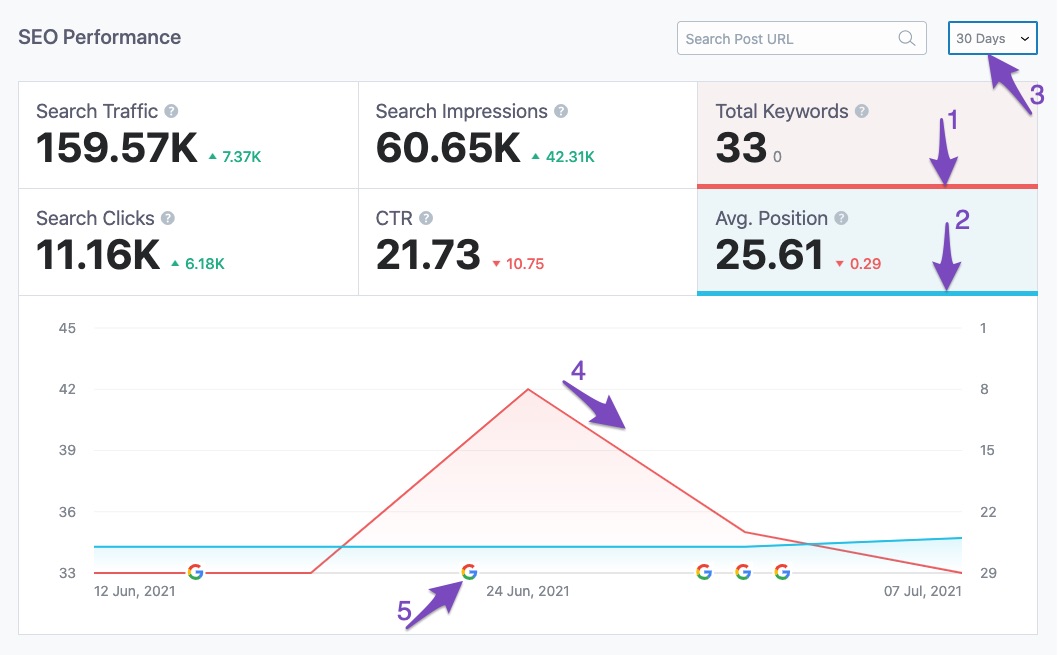
You can notice six different metrics available above your line graph labeled with:
- Search Traffic
- Search Impressions
- Total Keywords
- Search Clicks
- CTR
- Average Position
By choosing only the essential metrics, you can plot the graph with only the exact data that you want to look into.
Click a metric to enable it. Once enabled, a colored line will appear below it, and the line graph will be updated to reflect the changes.
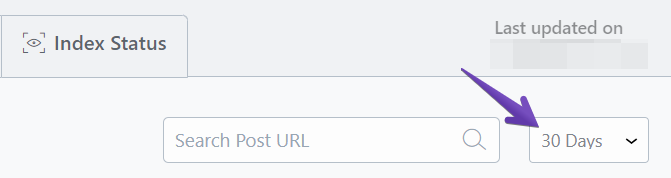
3.2 Selecting Timeframe
The option to select the timeframe is available in the top-right corner. By selecting a timeframe, you can get to look into your very recent data or over a longer duration, up to 6 months.
When you change the timeframe, the data in the line graph will reflect the changes.
3.3 Confirmed Updates vs Unconfirmed Updates
Each search update is marked with the status of the update, whether it is confirmed or not, just as shown below.
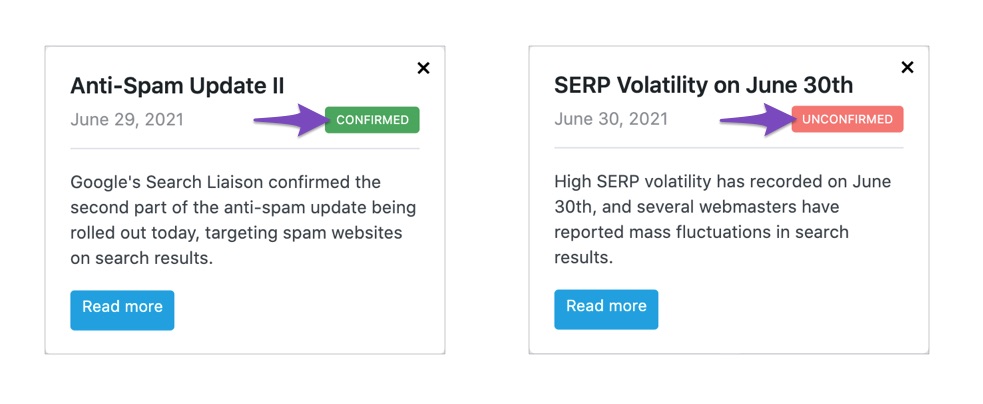
For major search updates, Google would keep us posted with such changes, well before the update or just at the time of rolling out the update. Any search update confirmed on Google’s part is marked with confirmed status.
As we mentioned earlier, Google does a lot of fine-tuning and test experiments throughout the year. Google won’t keep us posted on such daily changes. Although these changes are expected not to cause any adverse effects in search results, at times, they end up with massive changes in SERP. We track any such abnormal SERP volatility and report them. Any update not being confirmed on Google’s part is marked with unconfirmed status.
4 Checking Google Search Algorithm Update Effects on Your Site Performance
To evaluate if your website has been benefited or negatively hit by a search update, the following checks would be helpful.
4.1 Search Clicks/Traffic
The first metric you’ll have to look into is your website’s search clicks or traffic over a timeframe.
Search Clicks are the number of times people saw and clicked your website in search results. Whereas the Search Traffic is the total traffic, you’ve received from these search clicks. This includes the search clicks and any additional page views that have been generated from these clicks.
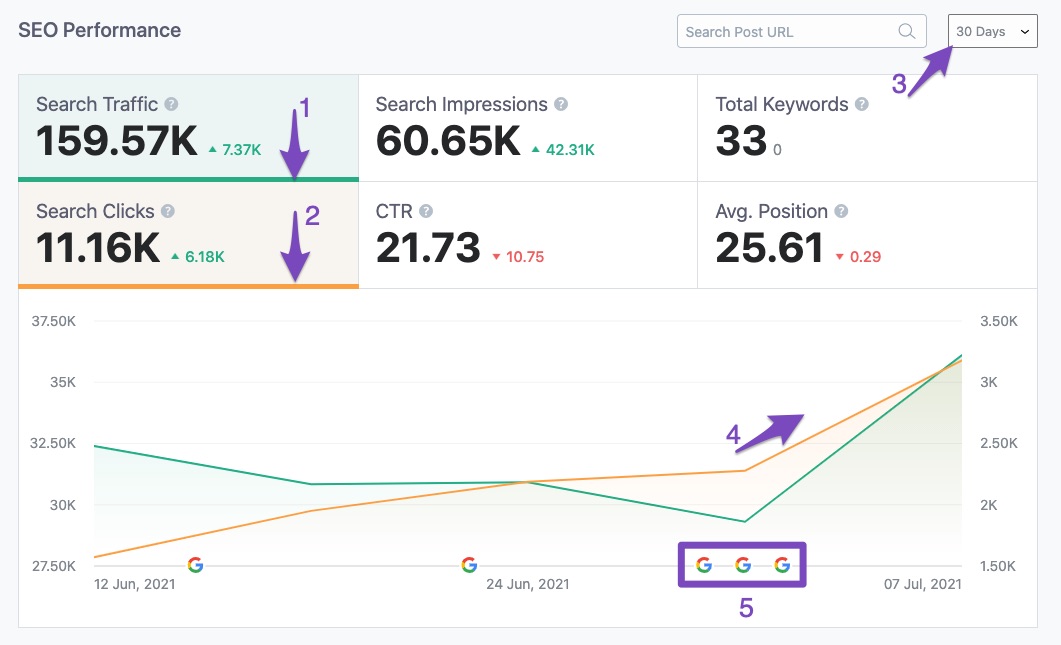
On the SEO Performance graph, select the Search Clicks/Traffic (or both) metric and then choose a timeframe. The line graph will be updated for the criteria you’ve set.
The line graph makes it easy to check the trend if your site’s traffic/clicks have increased or decreased over time and makes it easier to spot any changes. If you could notice any major changes lookout for the updates in the timeline that were rolled out in this period.
From the below example, you can notice an upward trend in the clicks and traffic (marked by 4). The timeline at the bottom of the graph points out a few Google updates (marked by 5) that could have resulted in this uptrend.
4.2 Impressions
Next, you should check the Impressions. Impressions are the number of times your website had appeared in search results when people searched the keywords you’re ranking for.
At times, after an algorithm update, your search traffic might have been steady, but there are chances that your website could have seen a drop in impressions.
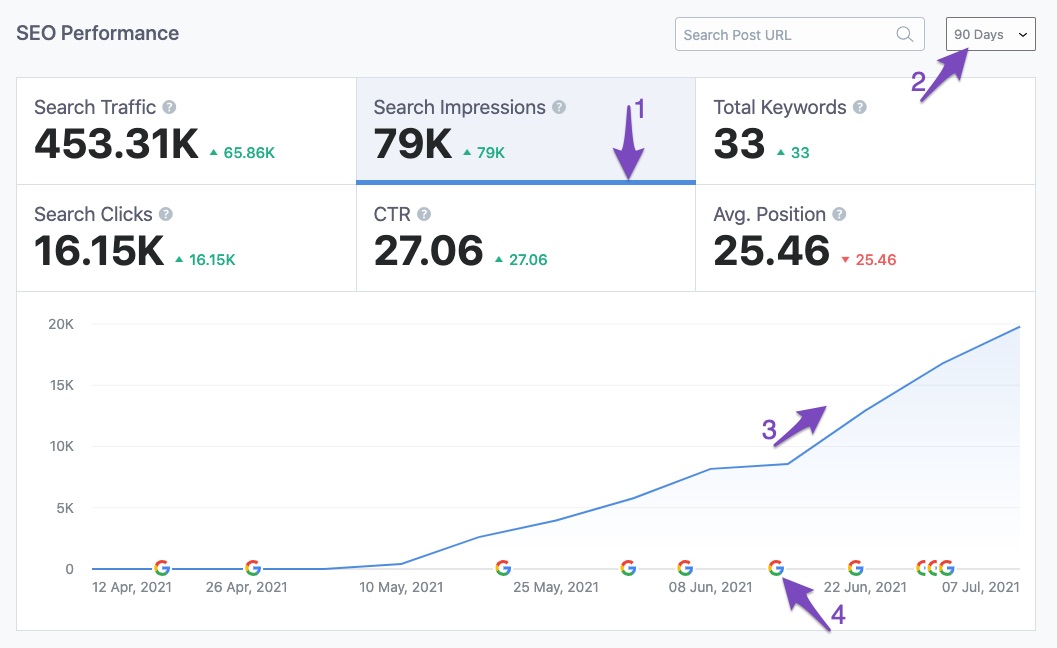
In the SEO Performance graph, you can choose the Impressions and set a timeframe to see the updated line graph. You can now look for any changes in the impressions.
Upward trend – indicates that your website is now being shown more often in search results than before.
Downward trend – indicates that your website is now being shown fewer times in search results than earlier.
In the below example, you can notice a massive gain in search impressions (marked by 3). The timeline points out a Google search update (marked by 4) that has benefited us with this increased visibility.
4.3 Total Keywords and Average Position
The last thing you should look into is the Total Keywords and Average Position. The Keywords metric indicates the total number of keywords your website is ranking for. The Average Position indicates the average rank of your website’s pages for your search keywords.
Choose the Keywords and Average Position metric in the graph and set a timeframe. And then look for any change in the trend.
Upward trend (Total Keywords) – indicates that your website is now ranking for more keywords than earlier.
Downward trend (Total Keywords) – indicates that your website is no longer ranking for some of the keywords you were ranking earlier.
Upward trend (Average Position) – indicates that your website pages have slipped rankings for some keywords.
Downward trend (Average Position) – indicates that your website pages have improved rankings for some keywords.
From the below example, you can notice a drop in the number of Total Keywords (marked by 4), and the timeline points to a possible search update (marked by 5) that could have resulted in this drop.
5 Measures to Take if Your Site Performance is Hit
From the above checks, if you had noticed your site’s performance has improved, then it’s great, and you can continue with your current strategies and efforts in place.
But, in case if your site’s performance is being negatively hit, then you can follow the below steps to alter your SEO techniques for recovering your search traffic.
5.1 Identify the Affected Update
Since Google rolls out a number of algorithms, at first, you would need to identify the exact update that has resulted in this decline in organic traffic. The checks we did earlier would help you point the update.
Note: At times, the changes made by algorithm updates would take a few days to roll out. So while looking out for the algorithm updates, make sure to look into the updates near to the shift in trend as well and not just on the exact date.
5.2 Understand the Changes Caused by the Update
Now that you’ve identified the algorithm update that has affected your website’s search performance, you should get to know more about the update.
The search update displayed in the timeline includes information related to the update. Click the Read more button for more details, or you can directly check our Google updates page.
The idea is to understand what changes happened during the update so that you will know what you should fix to get your site’s performance back to normal.
5.3 Take Recovery Measures
For most confirmed updates, Google provides guidelines as well. Although the guidelines are so vague, you can still evaluate your site using it and look for any potential issues on your website violating Google’s rules and guidelines.
Once you’ve identified any such guidelines or violations, you can get started with fixing them.
And, that’s it! We hope the article was helpful in understanding the usage of the search update timeline in Rank Math. If you still have absolutely any questions on using Rank Math, feel free to reach our support team directly from here, and we’re always here to help.