Understanding where your website traffic comes from is essential for optimizing your marketing efforts and improving your website’s performance. Google Analytics 4 (GA4) provides a powerful toolset to track and analyze your traffic sources, giving you insights into how users discover your site.
In this knowledgebase guide, we’ll walk you through the steps to check your website’s traffic sources in GA4, helping you make data-driven decisions to grow your audience and achieve your goals.
1 Connect Your Website to Google Analytics
Before you can track the traffic sources of your website, the first step is to connect your website to Google Analytics. Without this connection, Google Analytics won’t be able to collect or analyze your website’s traffic data.
If you haven’t set this up yet, don’t worry—Rank Math SEO makes the process quick and easy. With Rank Math, you can connect your website to Google Analytics without adding any code or going through lengthy processes. Simply refer to our step-by-step guide on how to connect your website to Google Analytics using Rank Math for detailed instructions.
Once the connection is established, make sure the Install analytics code option is enabled in the Rank Math Analytics settings. This will ensure that Google Analytics is actively tracking your website’s activity.
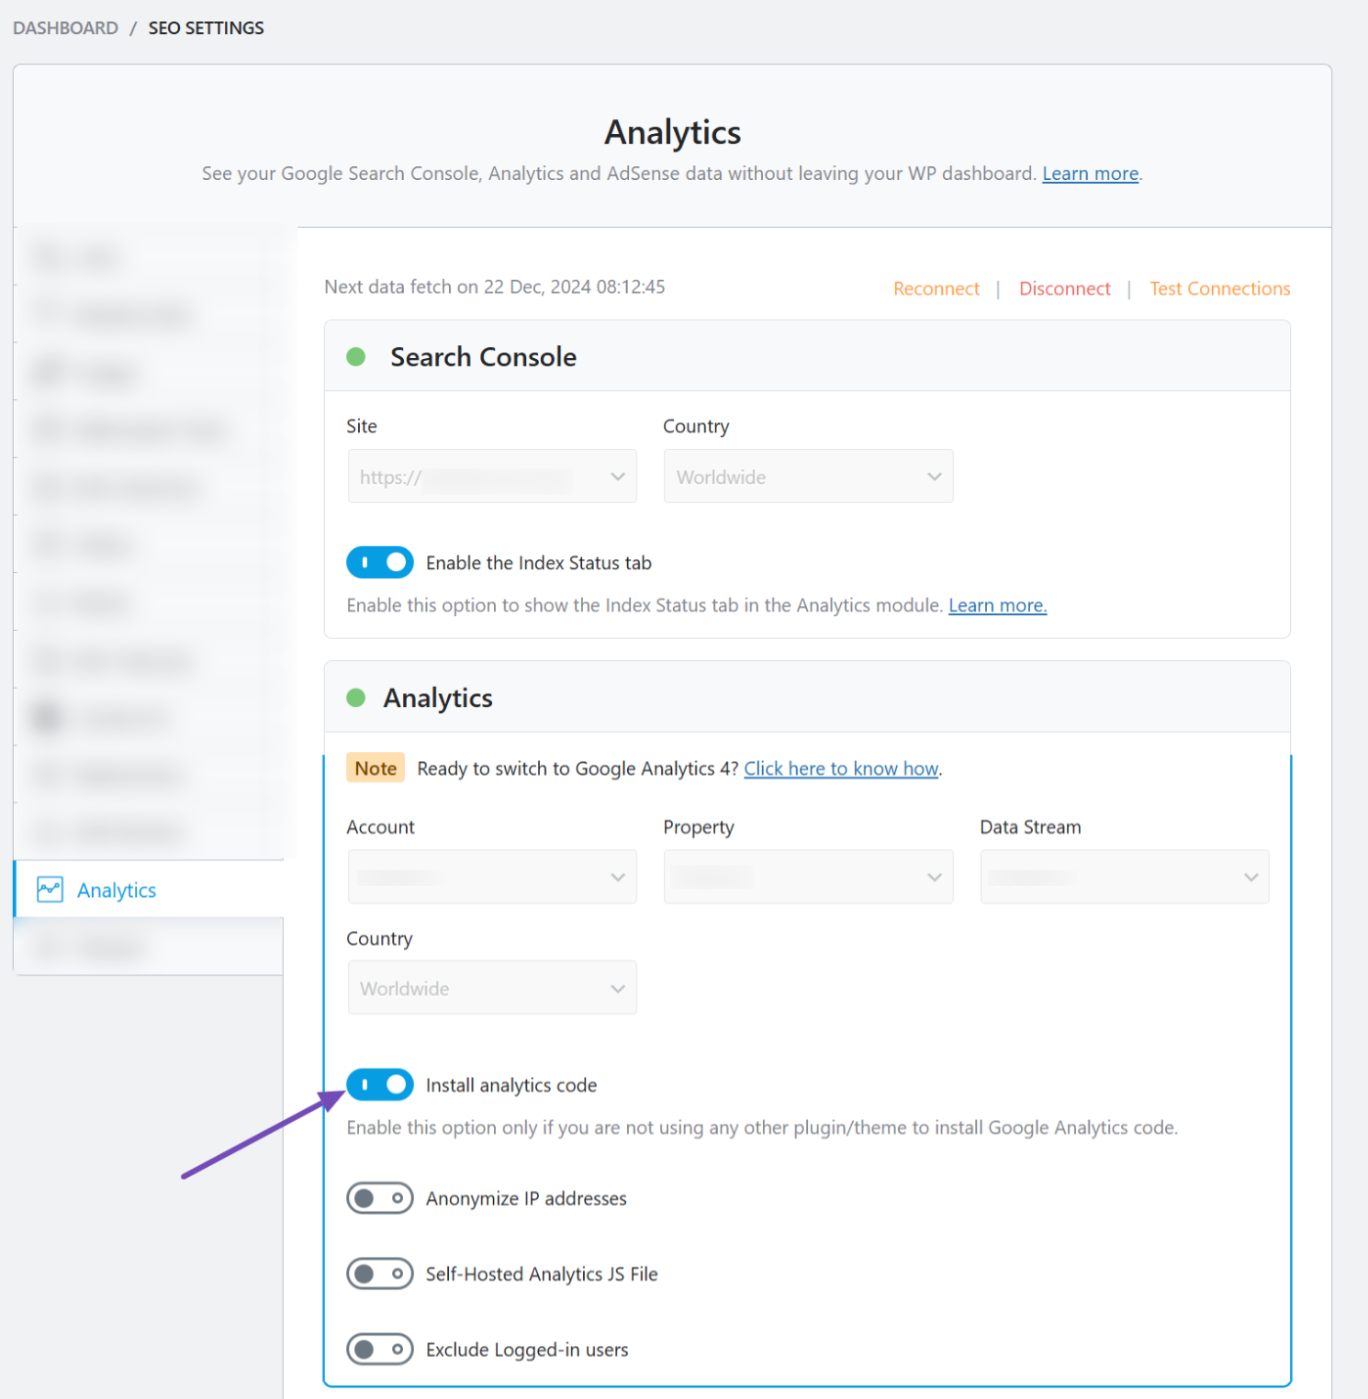
After completing these steps, you can start monitoring your traffic sources.
2 Viewing Traffic Sources in Google Analytics
Now that your website is connected, tracking your traffic sources becomes straightforward. Start by logging into your Google Analytics 4 (GA4) account. Once logged in, head to the Reports section—this is your central hub for all website performance insights. From there, navigate to Acquisition → Traffic acquisition.
This is where the magic happens! You’ll find detailed information about how visitors are landing on your site. GA4 breaks this down into channels like Organic Search, Direct, Paid Search, Organic Social, Paid Social, Referral, and more. These insights allow you to see which channels are driving the most traffic to your site.
If you need more detailed insights, you can customize filters or adjust date ranges to focus on specific time periods or sources. The beauty of GA4 is that it presents this data in an easy-to-digest format, so you can spend less time analyzing and more time making informed decisions.
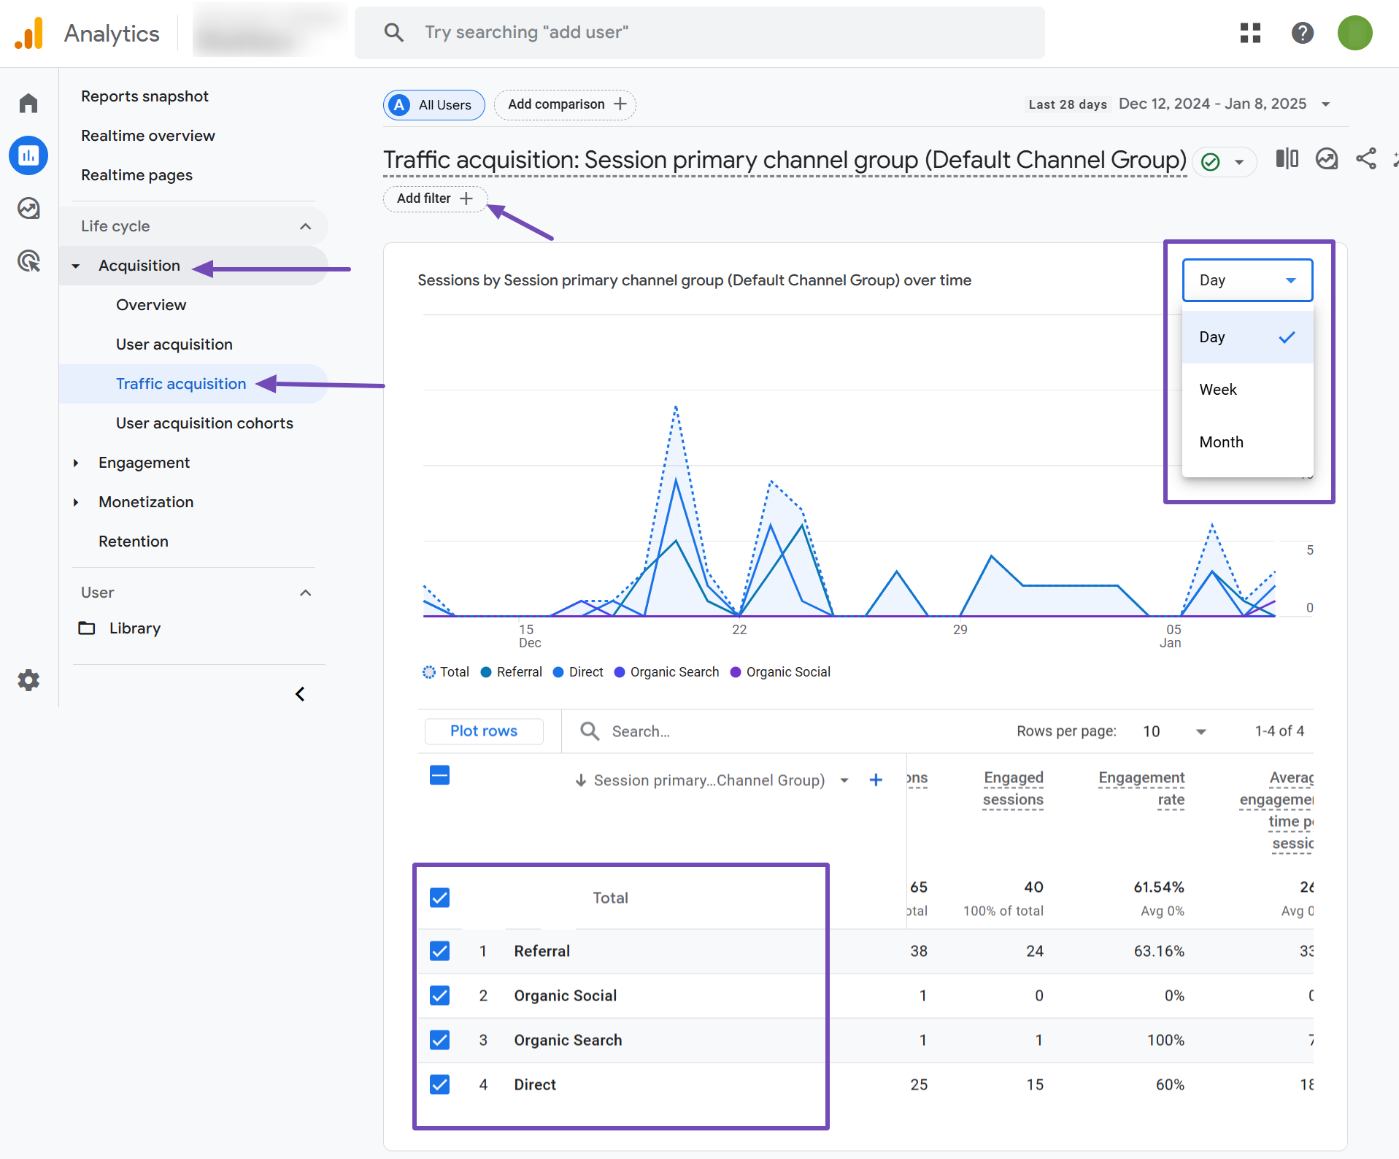
Now, as you look at the table, you’ll notice various metrics that help you evaluate your website’s traffic sources and understand how users perform. Let’s take a closer look at them.
3 Understanding Your Traffic Source Metrics
In this table, GA4 provides a detailed breakdown of your traffic sources using various metrics.
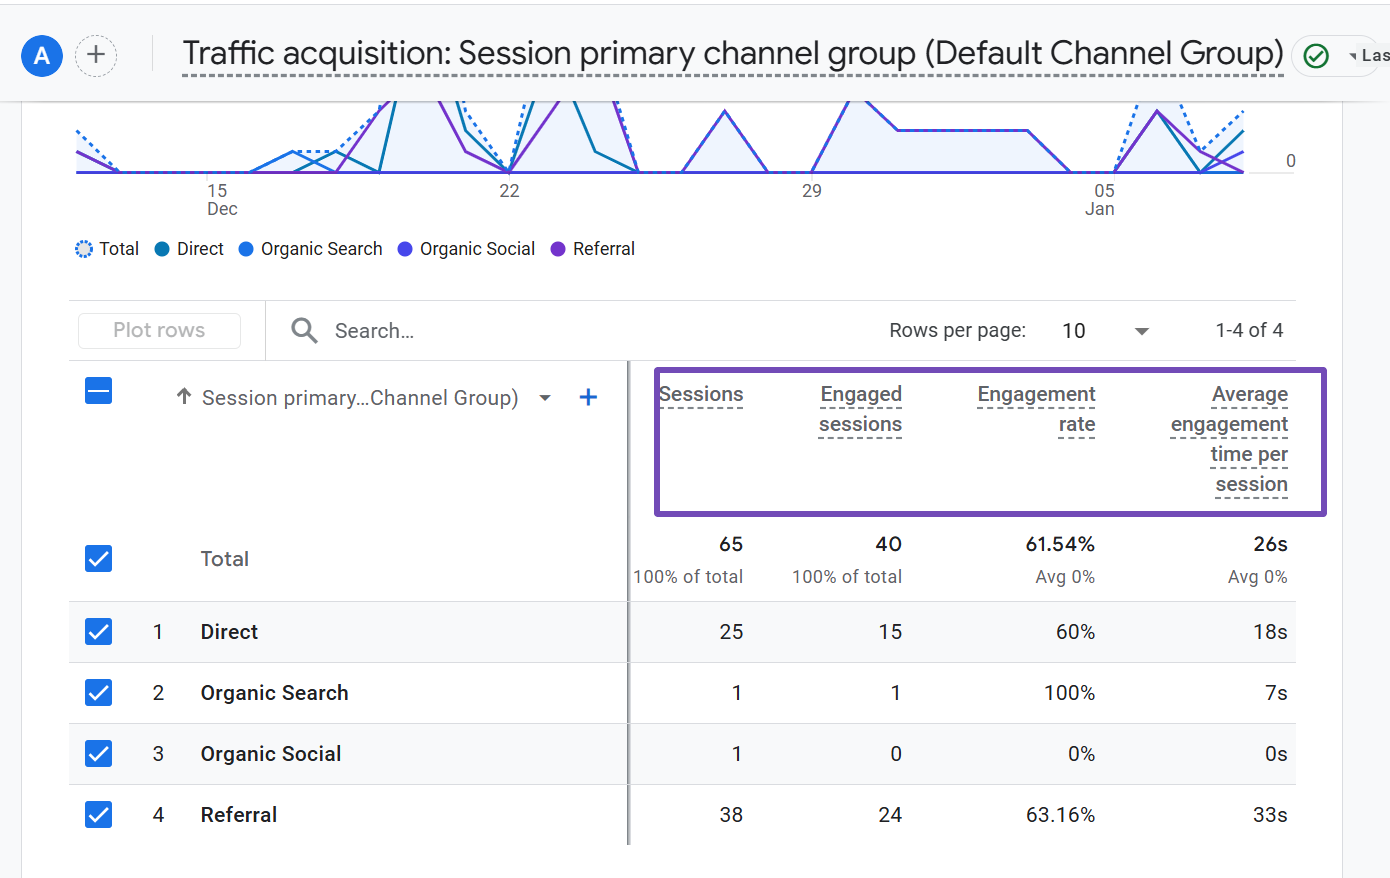
Here’s what each one means:
- Sessions: The total number of user sessions on your website. A session begins when a user visits your site and ends after 30 minutes of inactivity or at midnight.
- Engaged Sessions: These are sessions where users actively interact with your site for at least 10 seconds, perform a conversion event, or view multiple pages/screens.
- Engagement Rate: The percentage of sessions that are classified as engaged. A high engagement rate often indicates users find your content valuable and interactive.
- Average Engagement Time per Session: The average amount of time users actively engage with your site during each session. This gives you an idea of how compelling your content is.
- Events per Session: The average number of events (e.g., clicks, downloads, or video plays) triggered during a session. It’s a great indicator of user activity.
- Event Count: The total number of events recorded for all sessions. This includes every action users take on your site.
- All Events: A more granular view that categorizes all the events tracked on your site, such as clicks, form submissions, or scroll depths.
- Key Events: Specific events you’ve marked as critical to your goals. For example, a purchase or newsletter signup.
- Session Key Event Rate: The percentage of sessions in which a key event occurred. This helps you measure how well your site is achieving its primary objectives.
- Total Revenue: If eCommerce tracking is set up, this metric shows the total revenue generated from all sessions. It’s essential for understanding which traffic sources are most profitable.
By analyzing these metrics, you can understand how each traffic source contributes to user behavior and performance on your site.
Now, if you want to dig deeper into the report, you can pinpoint exactly where those traffic sources originate. Let’s walk you through how to do that.
4 Find the Traffic Source / Medium Report in GA4
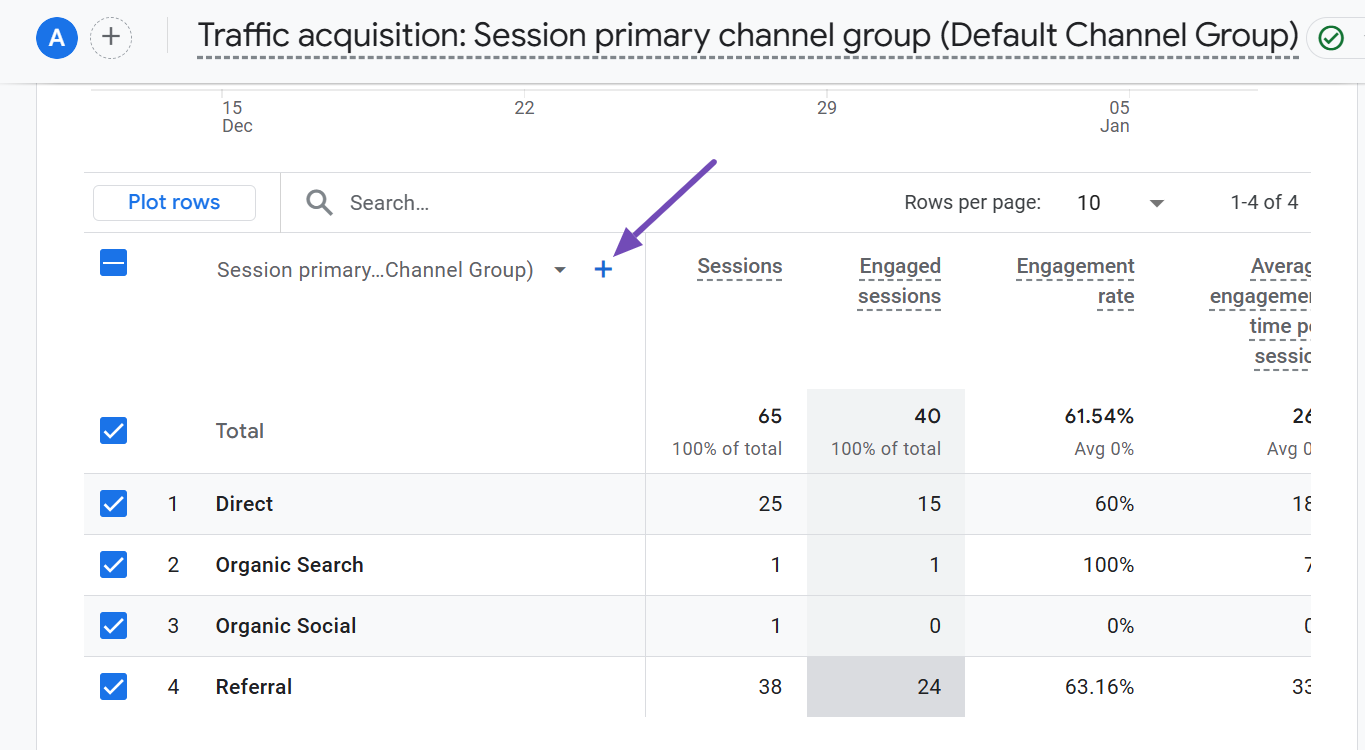
For more granular insights, you’ll want to add the “Source/Medium” dimension to your table. This allows you to see specific sources and their corresponding mediums. To do this, click the plus (+) icon at the top of the table, as shown below.
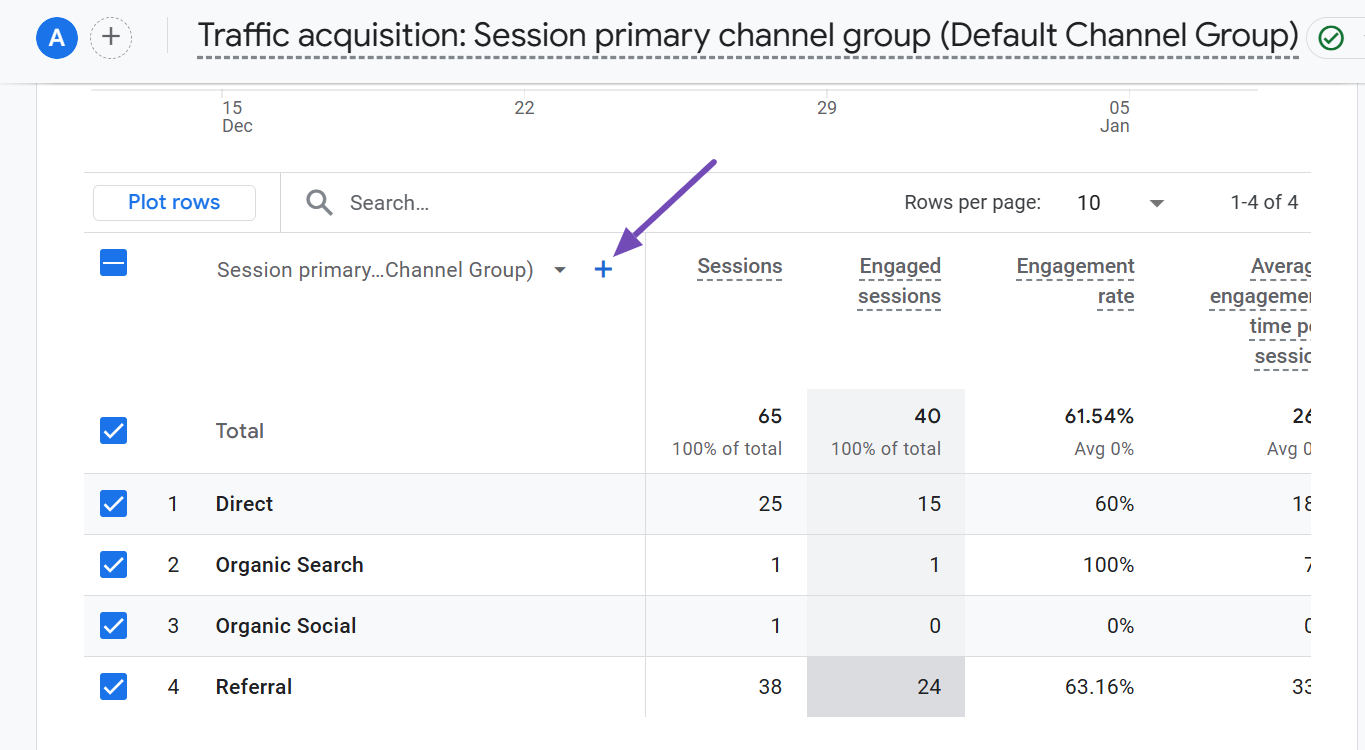
Next, navigate to the Traffic source section and select the “Session source/medium” option, as shown below.
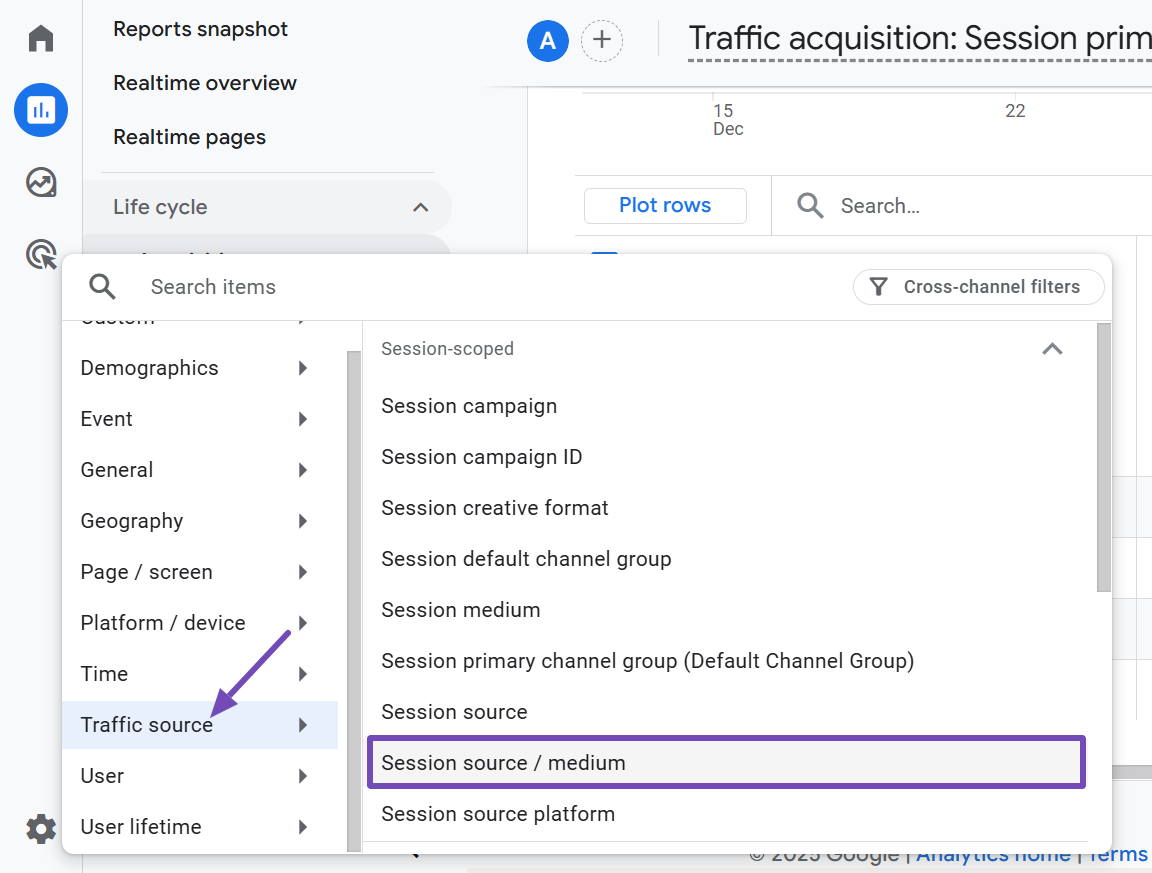
This will instantly update your table, showing the exact platforms driving traffic to your site and the medium they belong to, such as organic, referral, or paid.
By enabling this dimension, you’ll now have access to a complete Source/Medium report in Google Analytics. It provides a more detailed view than the basic source report.
For example, you can see exactly which social media platform (e.g., Facebook, Twitter) drives organic social traffic to your site and how users from those platforms perform.
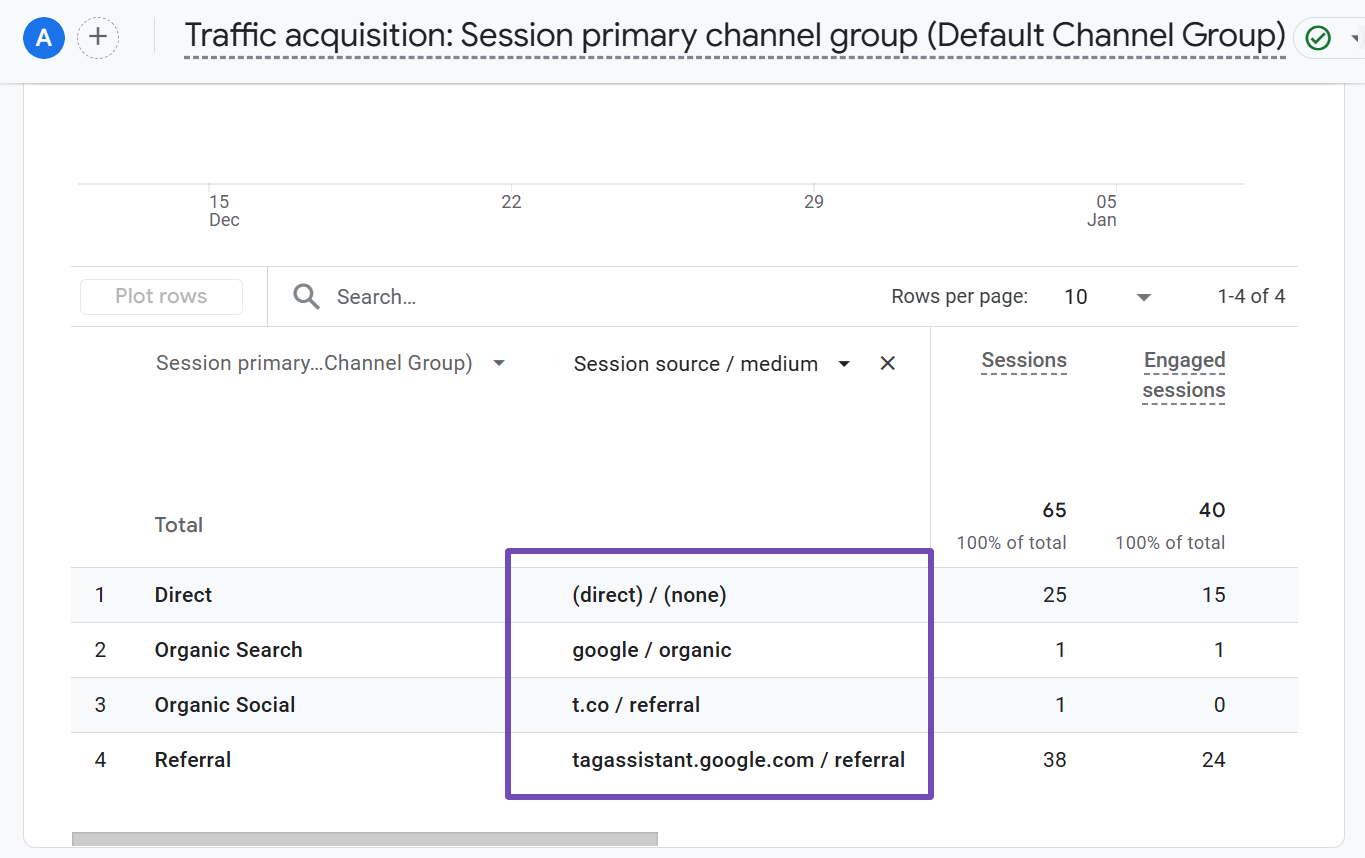
This deeper level of detail empowers you to understand not only where your traffic is coming from but also how well those visitors engage with your content.
5 Find the Traffic Sources for a Particular Page or Screen
Would you like to know the traffic sources for specific pages on your website? If so, we’d like to show you how. To find this information, you’ll need to add another secondary dimension to the report table.
To do this, click on the plus (+) icon at the top of the table.
This time, navigate to the Page / screen section and select the “Page path and screen class” option.
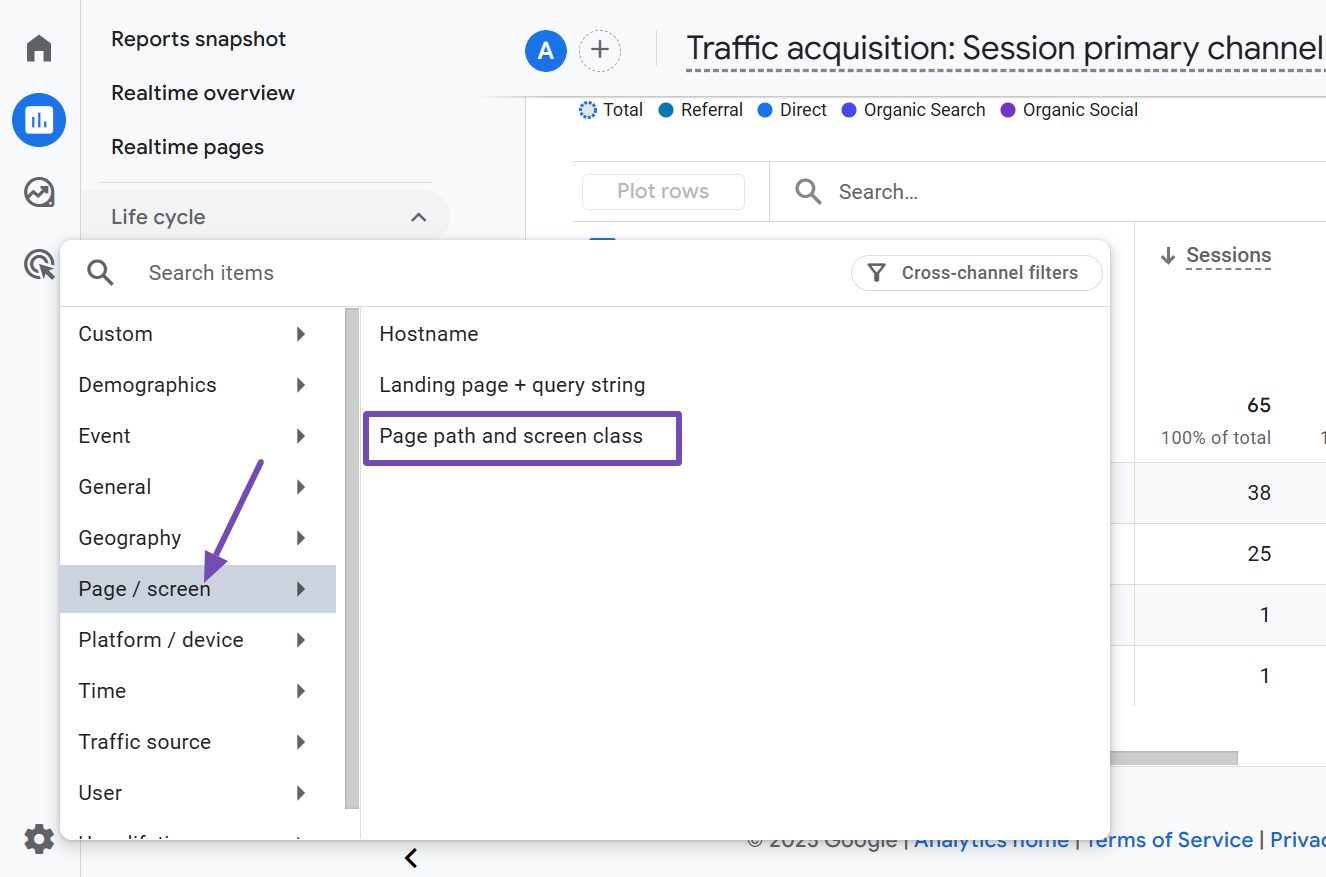
Once you’ve done that, the table will update to include your page URL paths, showing which pages are driving traffic and where that traffic is coming from. This insight allows you to analyze individual pages’ performance and traffic sources.
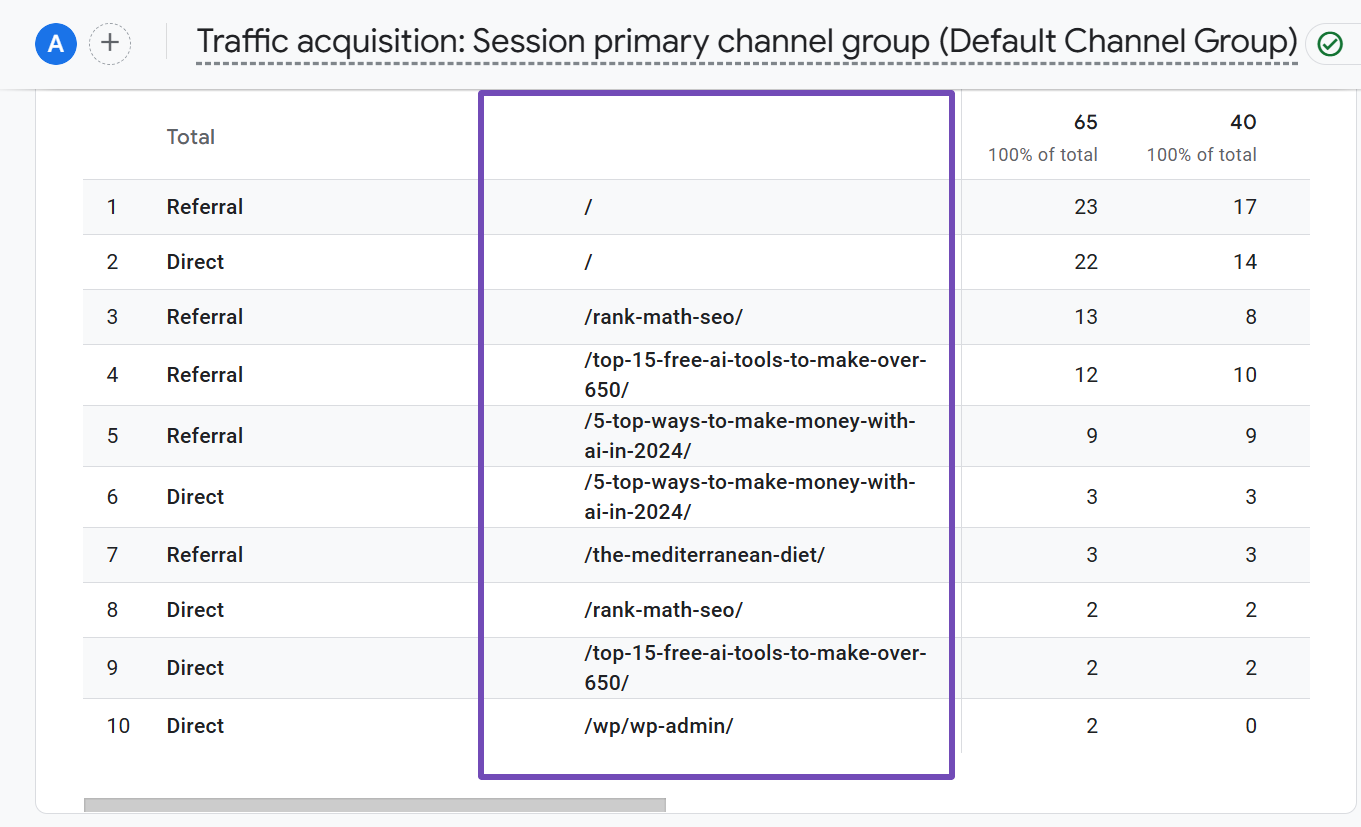
With this information, you can make informed decisions to refine your strategy and improve your website’s performance.
Pro Tip: You can also check the User Acquisition report from the menu for additional insights on how new users discover your site.
And that’s it! We hope you’ve successfully learned how to check your website’s traffic sources using GA4. If you have any questions or need assistance with Rank Math, feel free to reach out to our support team. We’re available 24/7, 365 days a year, and always happy to help!