What is Google Trends?
Google Trends is a free tool that allows users to analyze the popularity of a search query over time. It provides insights into what people are searching for and how interest in specific topics changes over time.
Google Trends is owned by Google and gathers its data from search queries that real-life users enter into Google Search.
Uses of Google Trends
Google Trends is a versatile tool that can be used for various purposes across different fields. However, it is often used by SEOs and marketers for keyword and marketing research.
1 Zoekwoordonderzoek
Bloggers, vloggers, SEOs, social media managers, and content creators use Google Trends to discover trending search terms and topics. This allows them to identify high-potential keywords they could include in new or existing content.
2 Marktonderzoek
Businesses and marketers use Google Trends to gain insights into consumer behavior and market trends. This helps to identify emerging trends, monitor brand health, and make data-driven decisions that allow them to stay ahead of their competitors.
How to Analyze Data Using Google Trends
Google Trends is intuitive to use, even for people who are not experienced with handling data. Below, we will show you how to use it to analyze and compare your keywords.
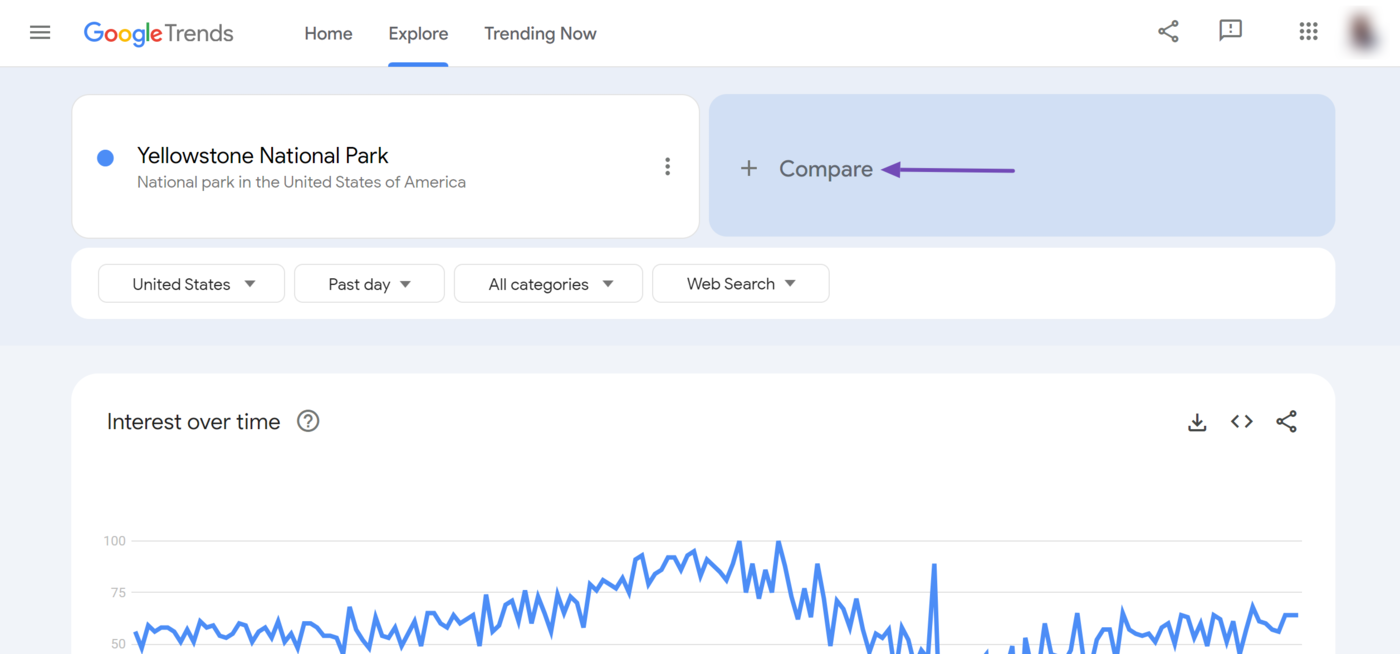
1 Entering a Keyword Into Google Trends
Eerste, navigate to the Google Trends tool and enter your keyword into the available field. If the content is intended for an audience outside your country of residence, you can select the country from the dropdown menu at the top of the page.
Als u klaar bent, klikt u op Ontdekken.
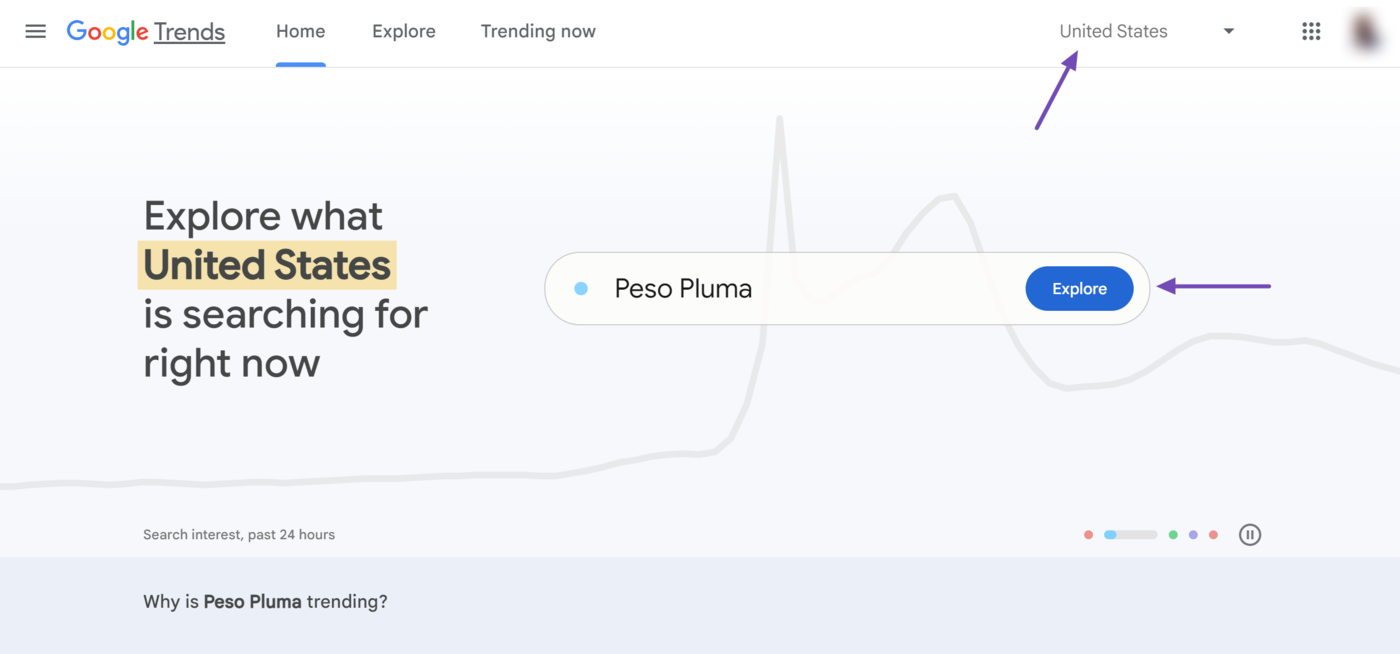
Google Trends will return with a page containing details of your keyword.
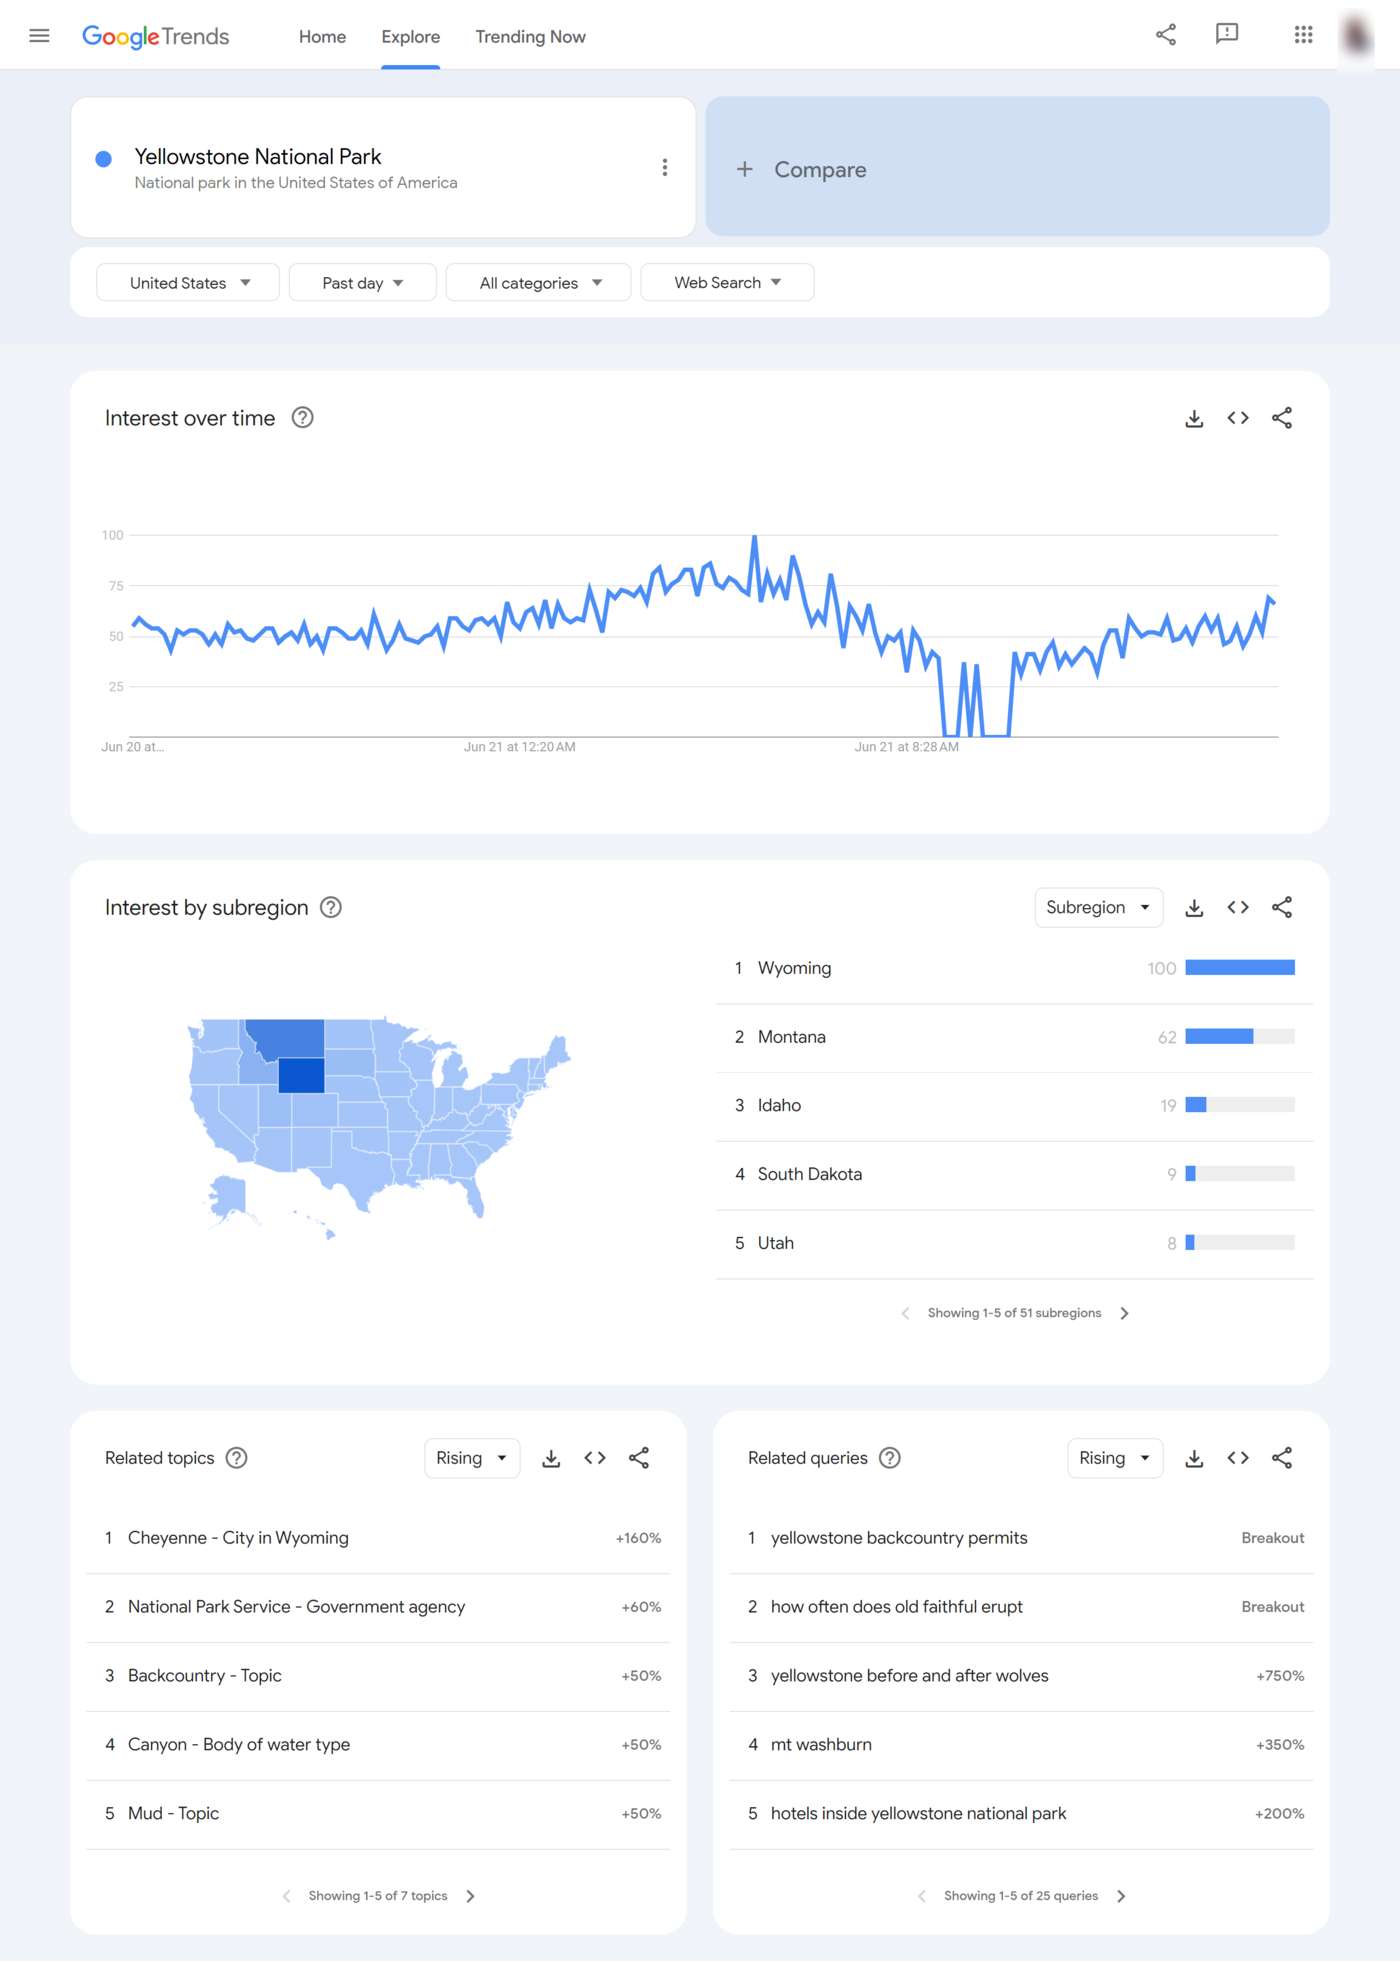
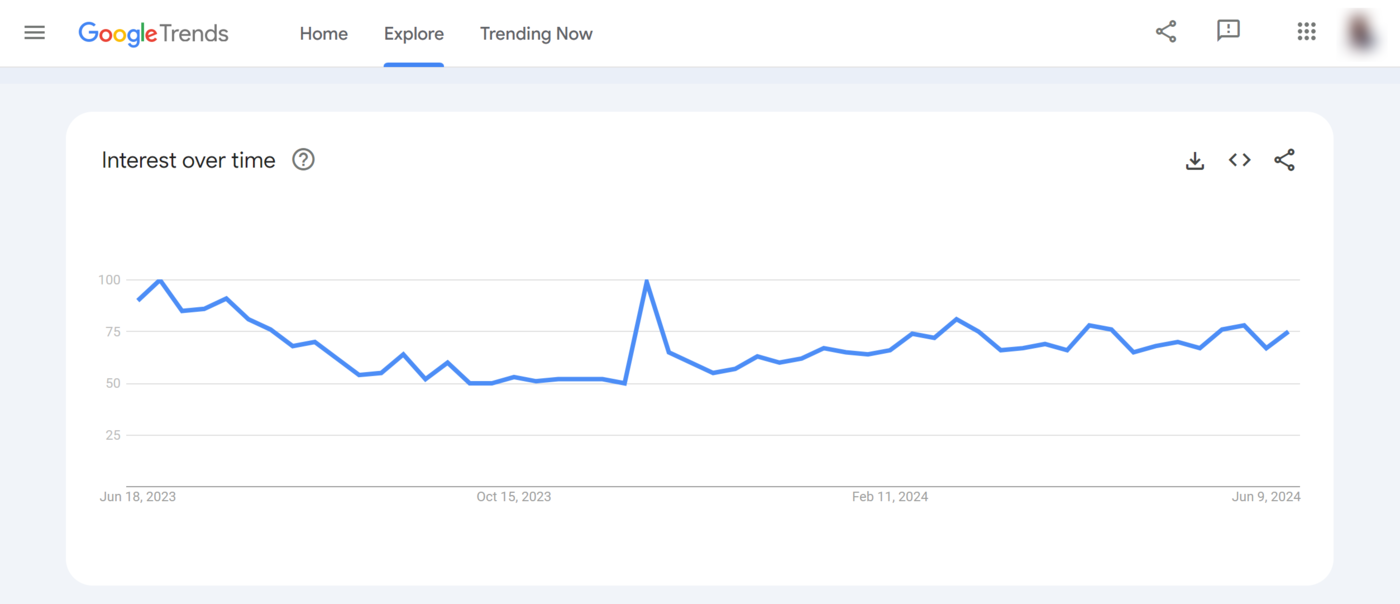
2 Understanding the Graph
The Google Trends results tool includes a graph at the top. This graph lets you quickly identify patterns indicating the rise and drop of the keyword’s popularity.
When you hover over the graph, you will see a tooltip that provides additional information about the keyword.
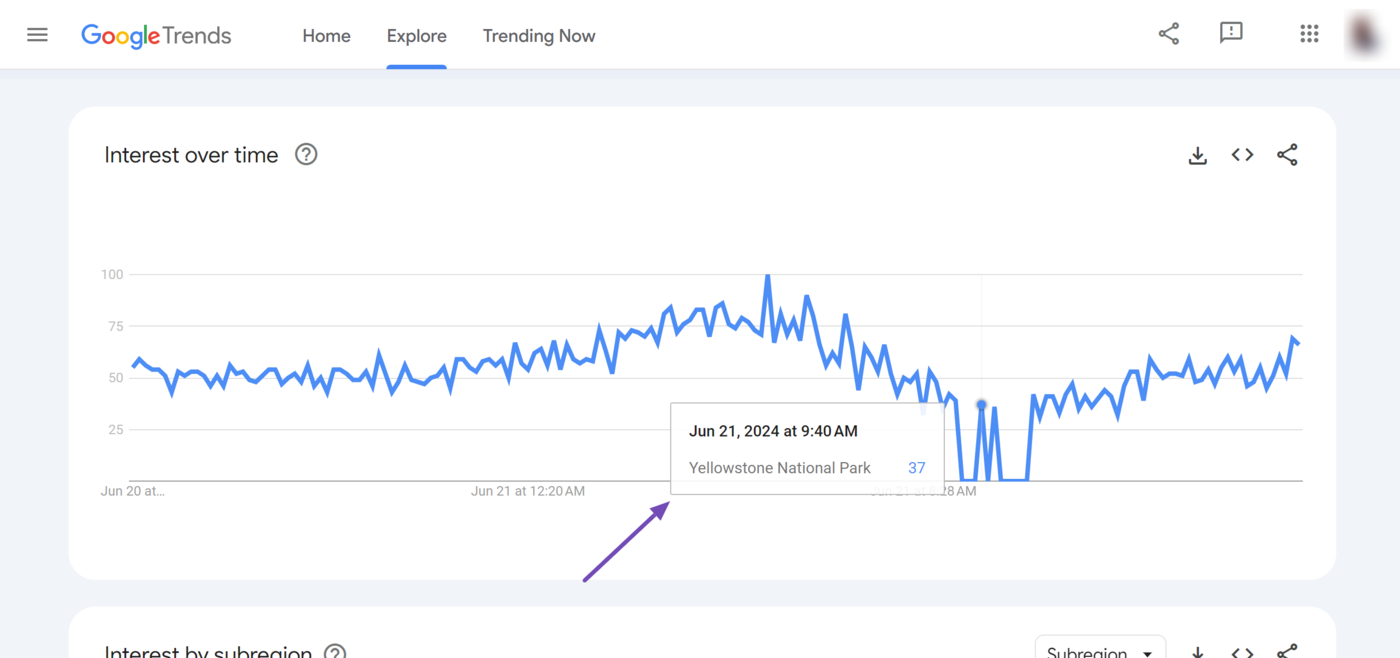
Now, look at the left side of the graph. You will observe a series of numbers that go up to 100.
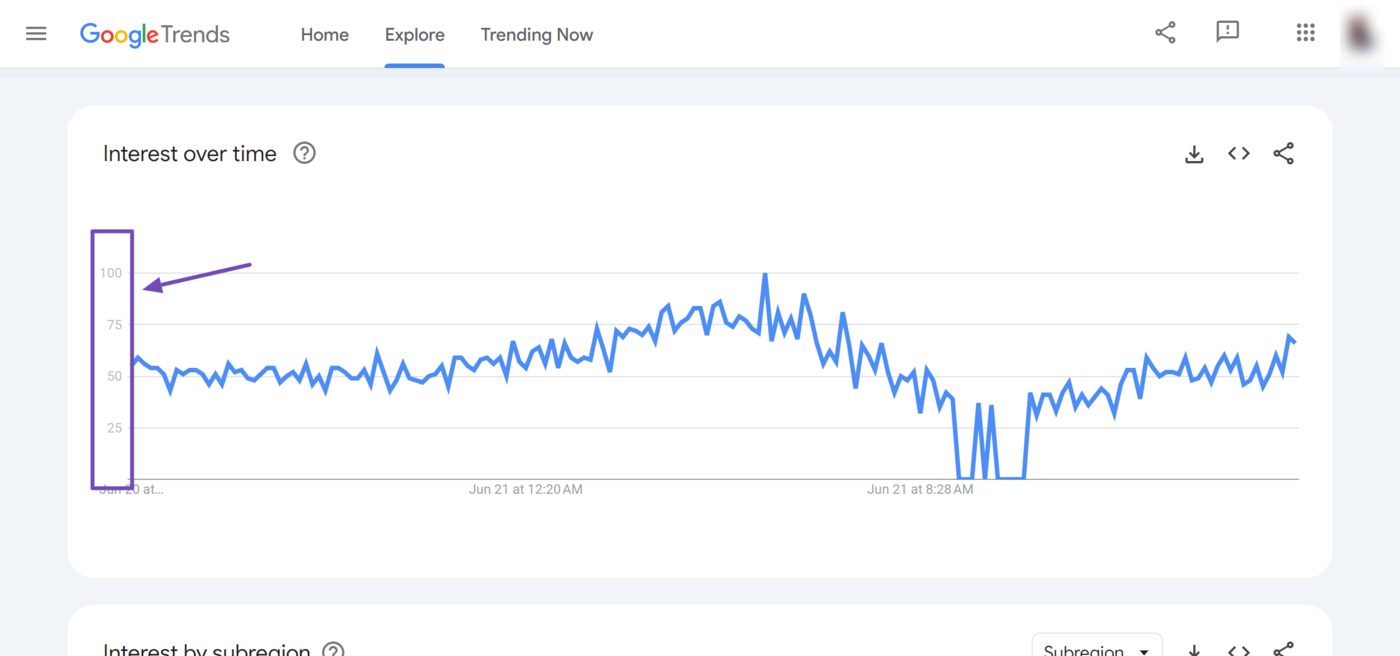
These numbers are known as the interest score. They do not represent the absolute search volume. Instead, they show when the keyword was most searched and least searched.
100 indicates the peak popularity for the term. In other words, this is where Google users search for the keyword the most.
Meanwhile, zero signifies that there was not enough data for the term. This could mean very low or no search interest at that specific time and location, or the search volume was so low that it wasn’t significant enough to be represented on the graph
3 Applying Filters for More Specific Data
Google Trends provides several options to modify the data shown to you. Some of these options are at the top of the graph. There, you will find four dropdowns that allow you to modify the search query displayed according to their:
- Region
- Timeline
- Category
- Search type
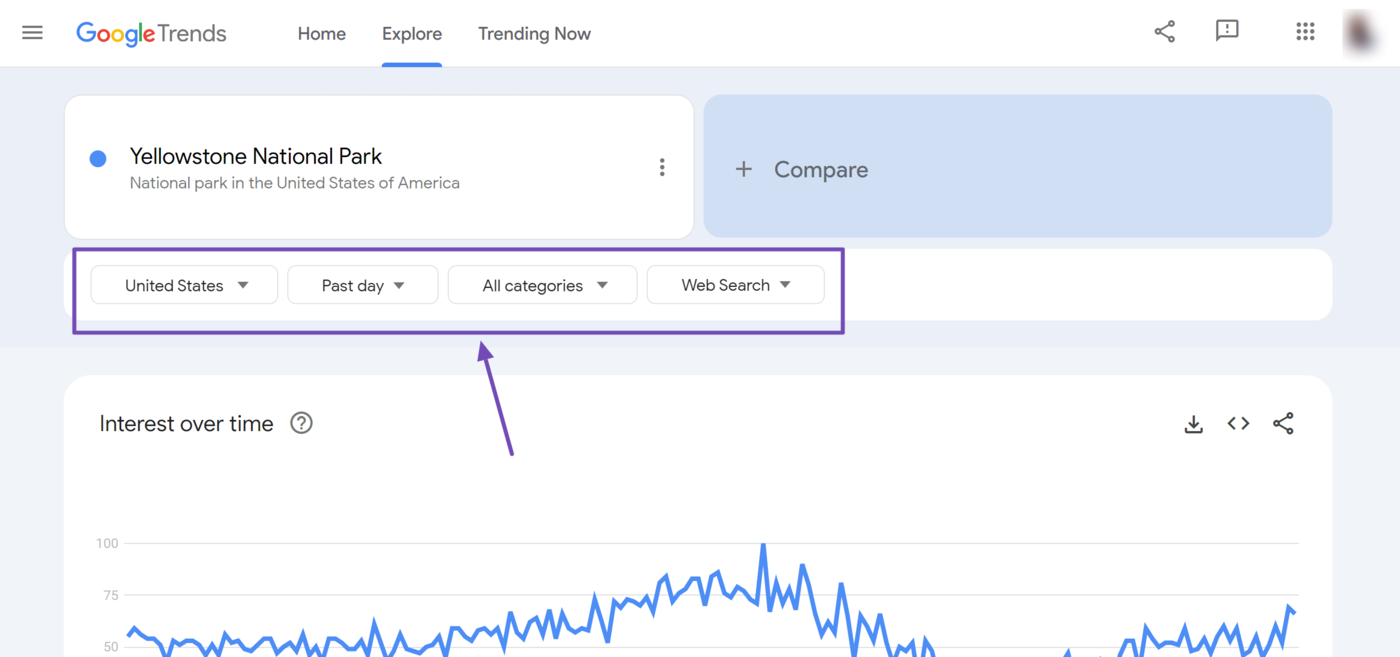
Region – The region dropdown allows you to select the region from which the search originated. This allows you to determine how much interest your keyword got from that region.
Timeline – The timeline dropdown lets you specify the dates people searched for that keyword. You can set a custom date or choose one from the predefined date options.
Category – The category dropdown allows you to filter the search data by the searchers’ fields of interest. This feature helps narrow down the search queries, particularly when they involve keywords that cut across various categories.
Search type – The search type dropdown allows you to filter the search data by the type of search. It is set to display Web search results by default, but there are options to select Image, News, Google Shopping, and YouTube Search.
Other Data Displayed in Google Trends
Google Trends displays some other data in sections located below the graph. These extra data include:
- Interest by region or subregion
- Related topics
- Related queries
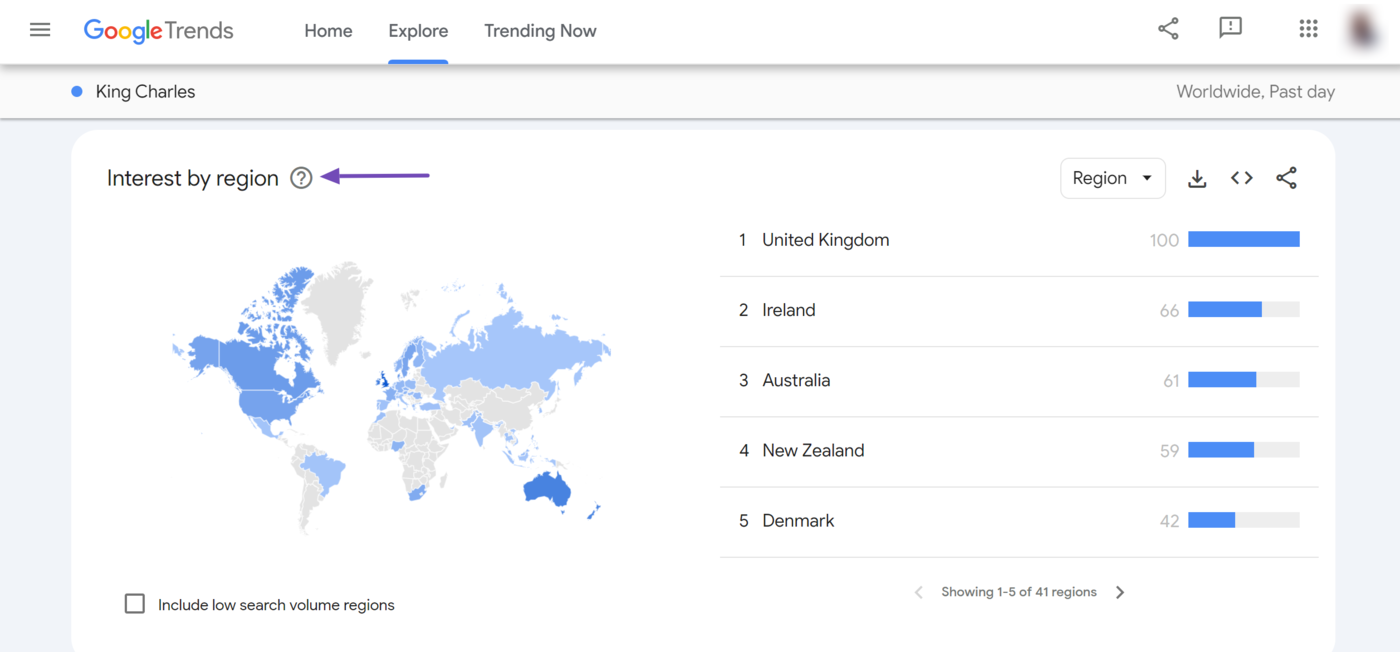
1 Interest by Region or Subregion
The interest by region section displays the popularity of the keyword by their countries.
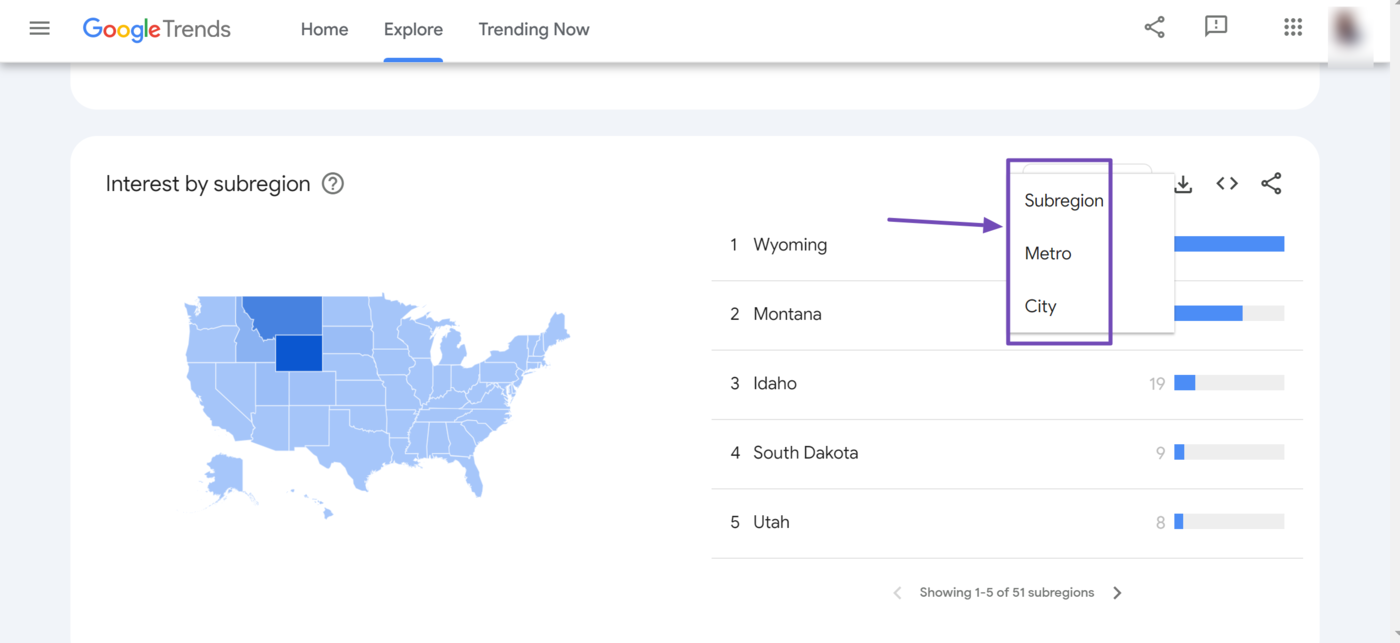
If the search is restricted to a country or territory, it will be labeled “Interest by subregion” instead and will display the popularity of the keywords according to the states or regions within the country.
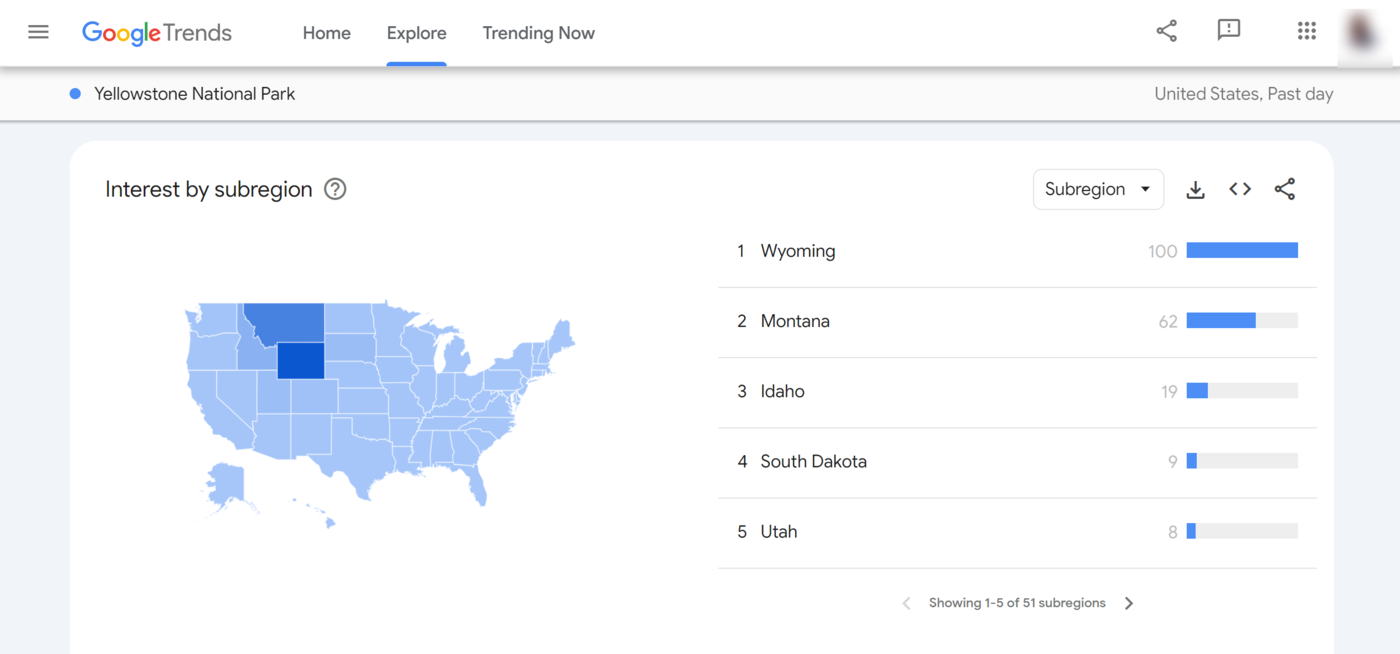
The map displayed is color-coded. The bluer the area, the more search queries originated from that area. Meanwhile, areas with low or nonexistent search queries are grayed out.
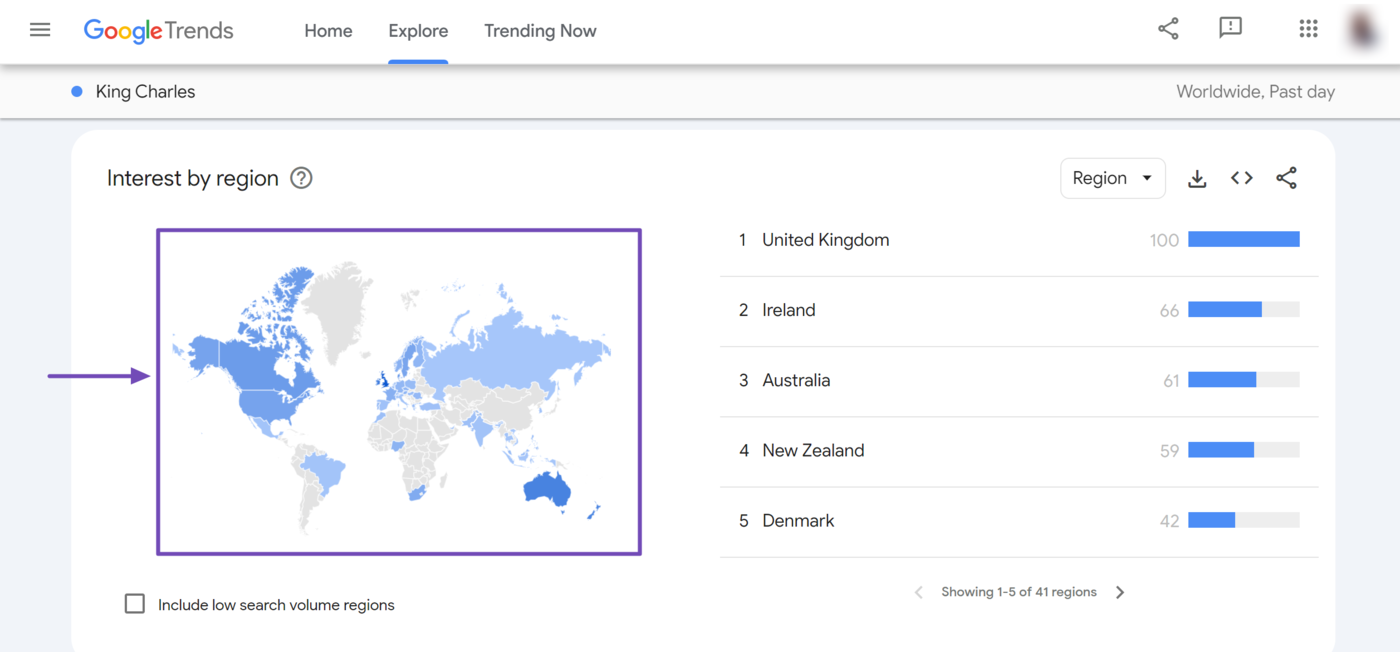
That said, you can click the arrows at the bottom to navigate the regions or subregions displayed on the map.
![]()
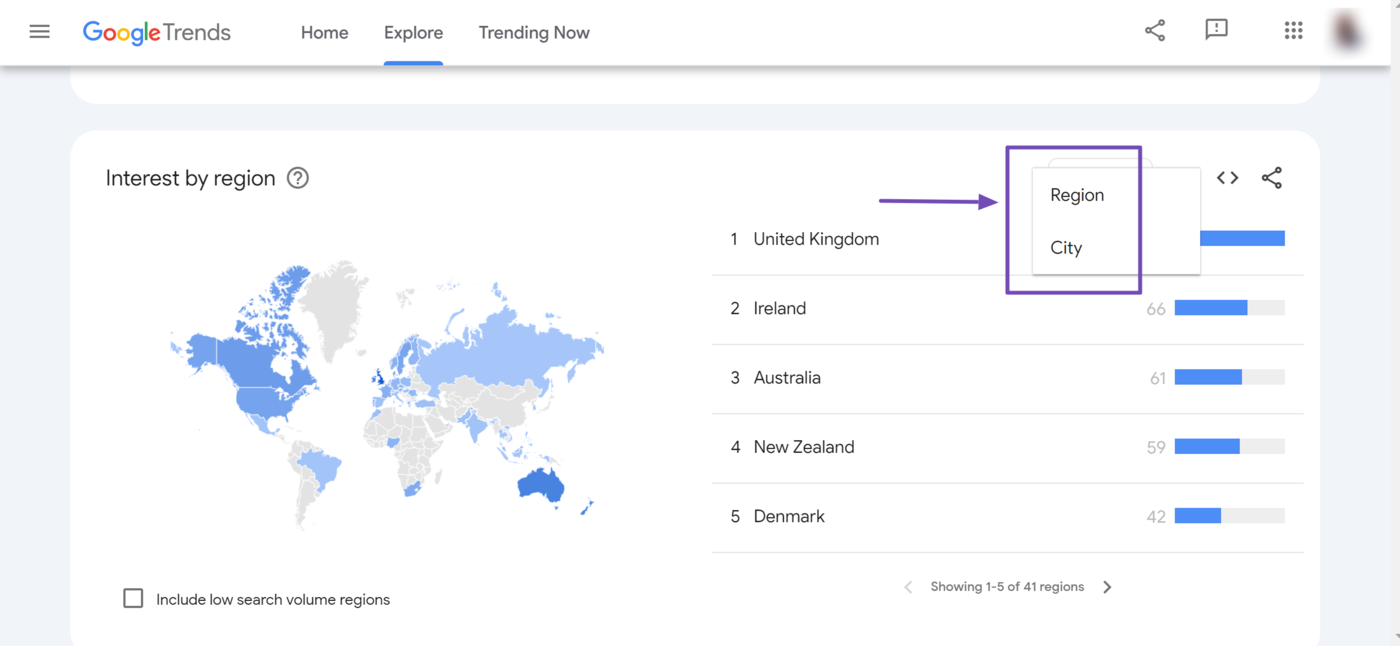
You can also use the Region/Subregion dropdown menu at the top of the section to view search reports for specific areas within the region or subregion.
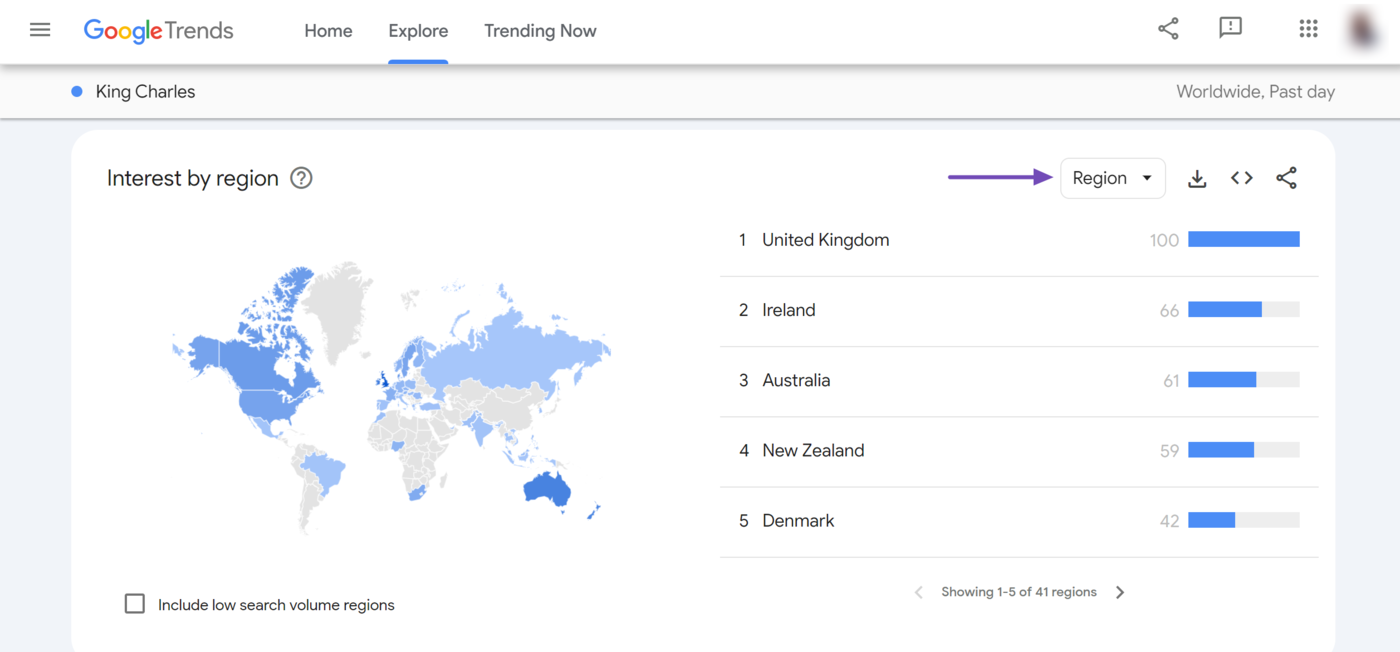
If the search data is set to “Worldwide,” you can select between the Region en City.
If the search data is set to a specific country, you can select one of Subregion, Metro, of City.
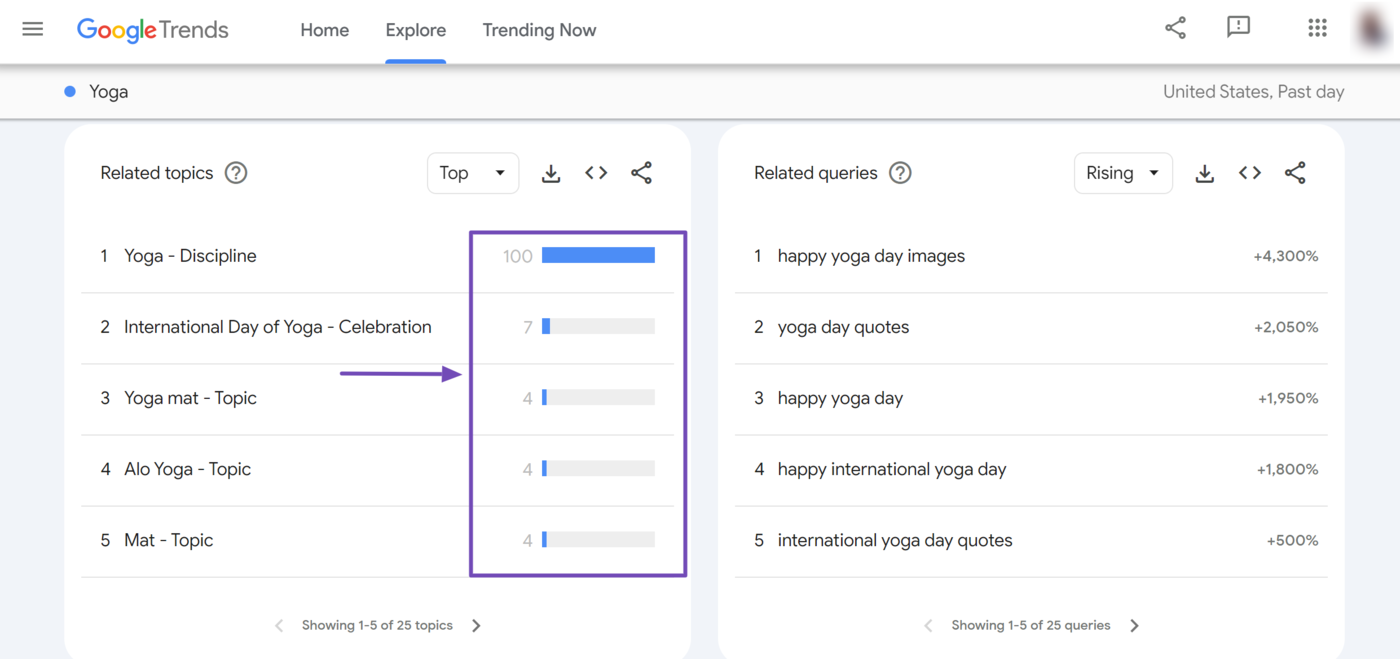
2 Related Topics
The Related topics section displays the search terms searchers also searched for while searching for the keyword you entered into Google Trends. At the top of the section is a dropdown menu that allows you to select between Rising en Top.
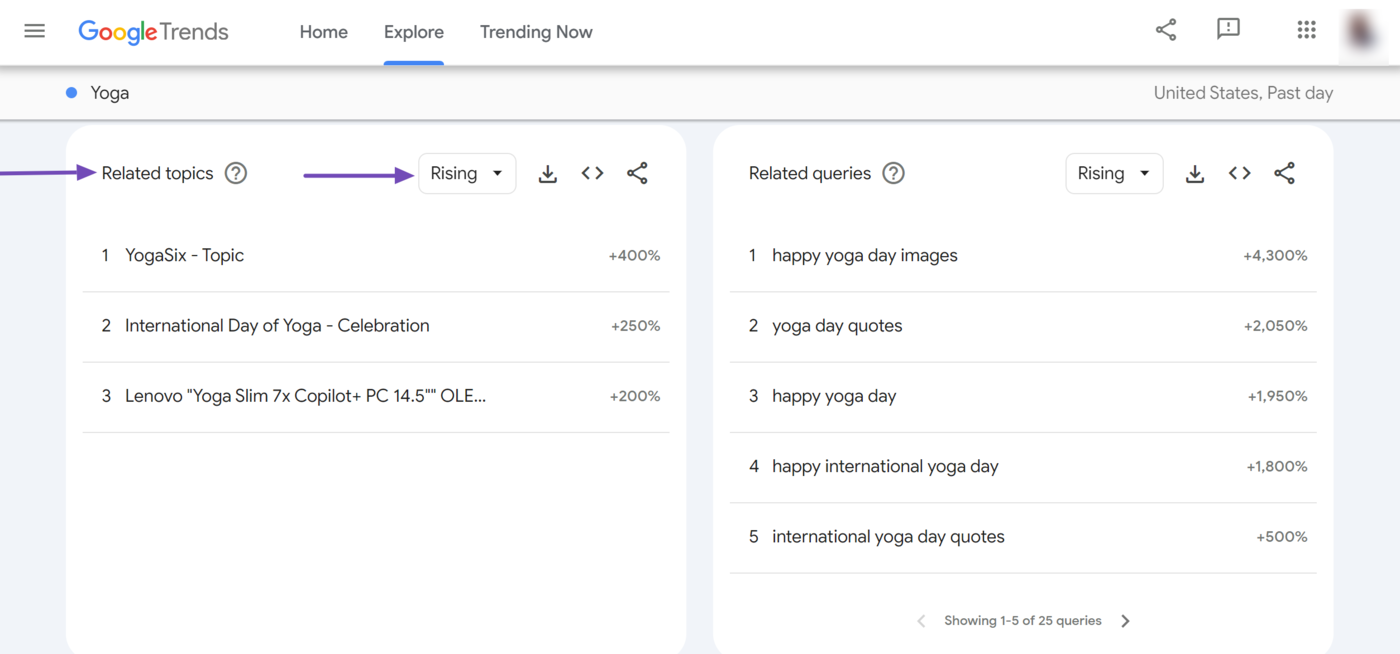
Rising – This indicates the search topics currently being searched for alongside the search term. These search terms display a percentage score, showing how frequently searchers search for both terms.
They may also display “Breakout,” indicating that they have a very high search frequency at the moment.
Top – Top shows you the most popular search topics over time. This data typically includes a relevance score that indicates how common it is for searchers to search for it alongside your keyword.
The higher the relevance score, the more common for searchers to search for it alongside your keyword.
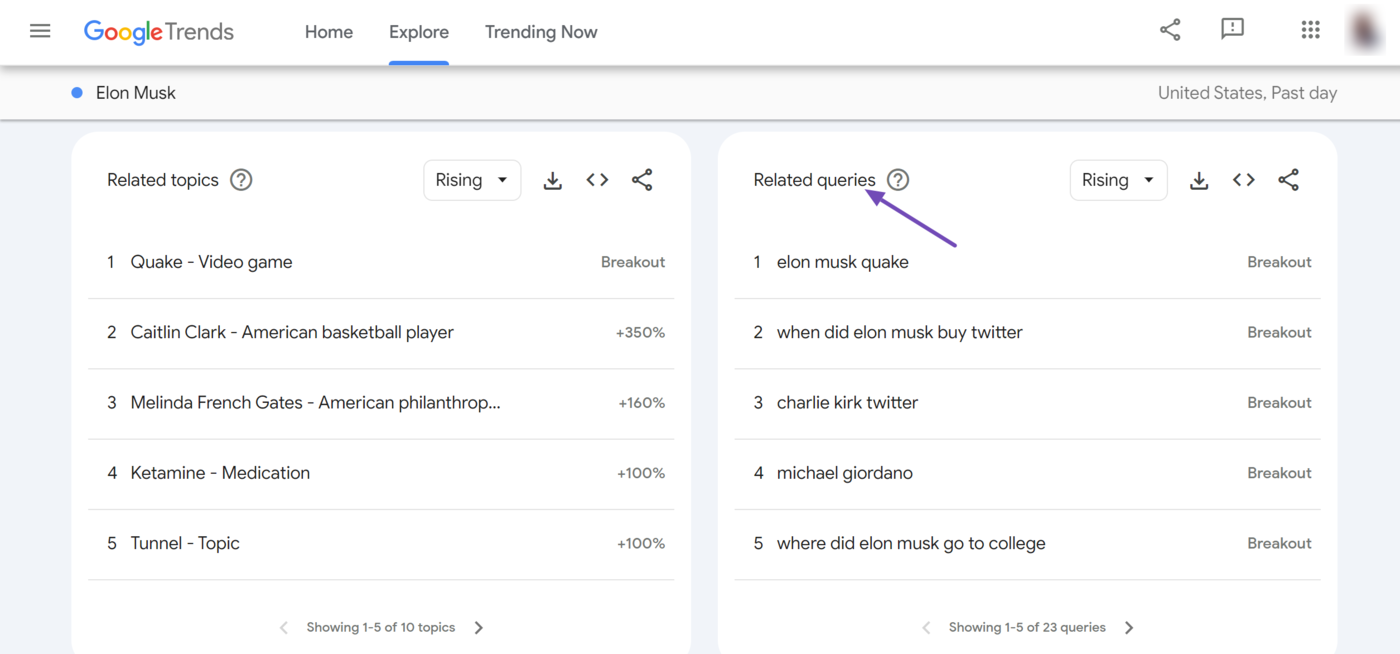
3 Related Queries
The Related Queries section displays search queries that searchers search for in addition to or in place of the search query. The section also has a dropdown menu containing two options: Rising en Top.
Comparing Multiple Terms
Google Trends allows you to compare multiple search terms. You can do that from the Trends homepage by separating your keywords with a comma.
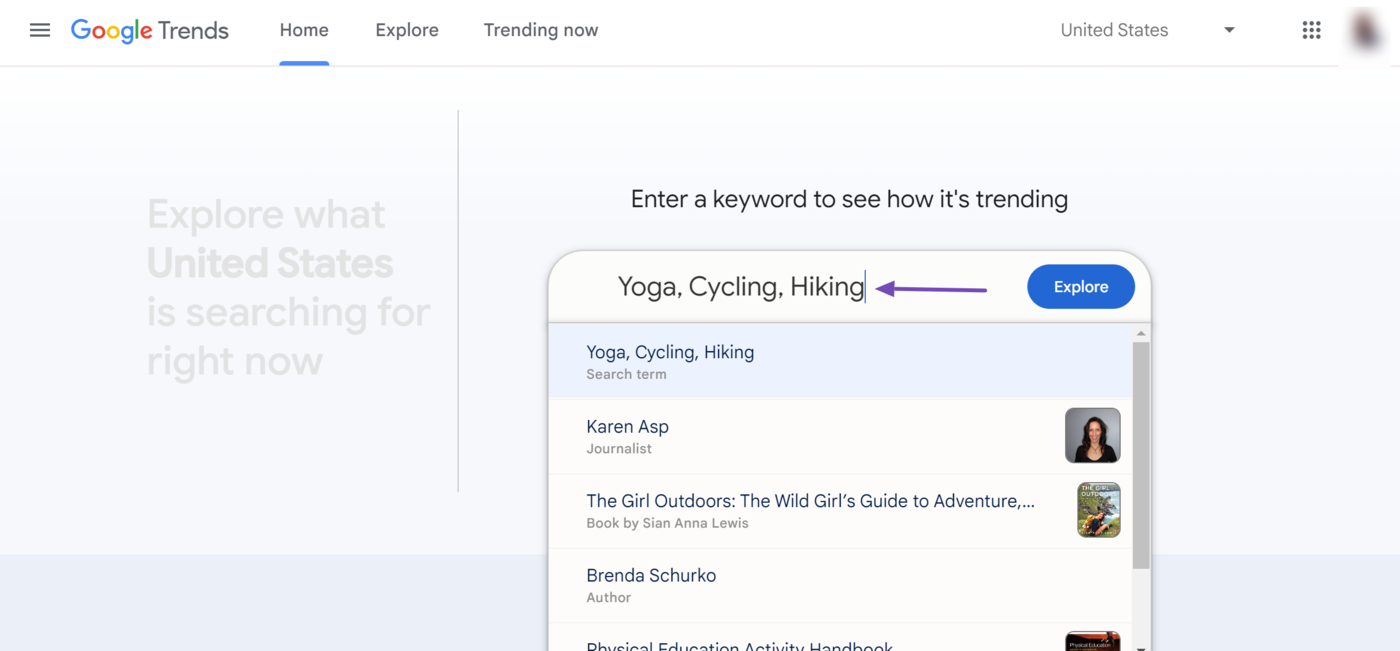
Once done, Google Trends will show you multiple color-coded graphs, depending on how many search terms you entered into the tool.
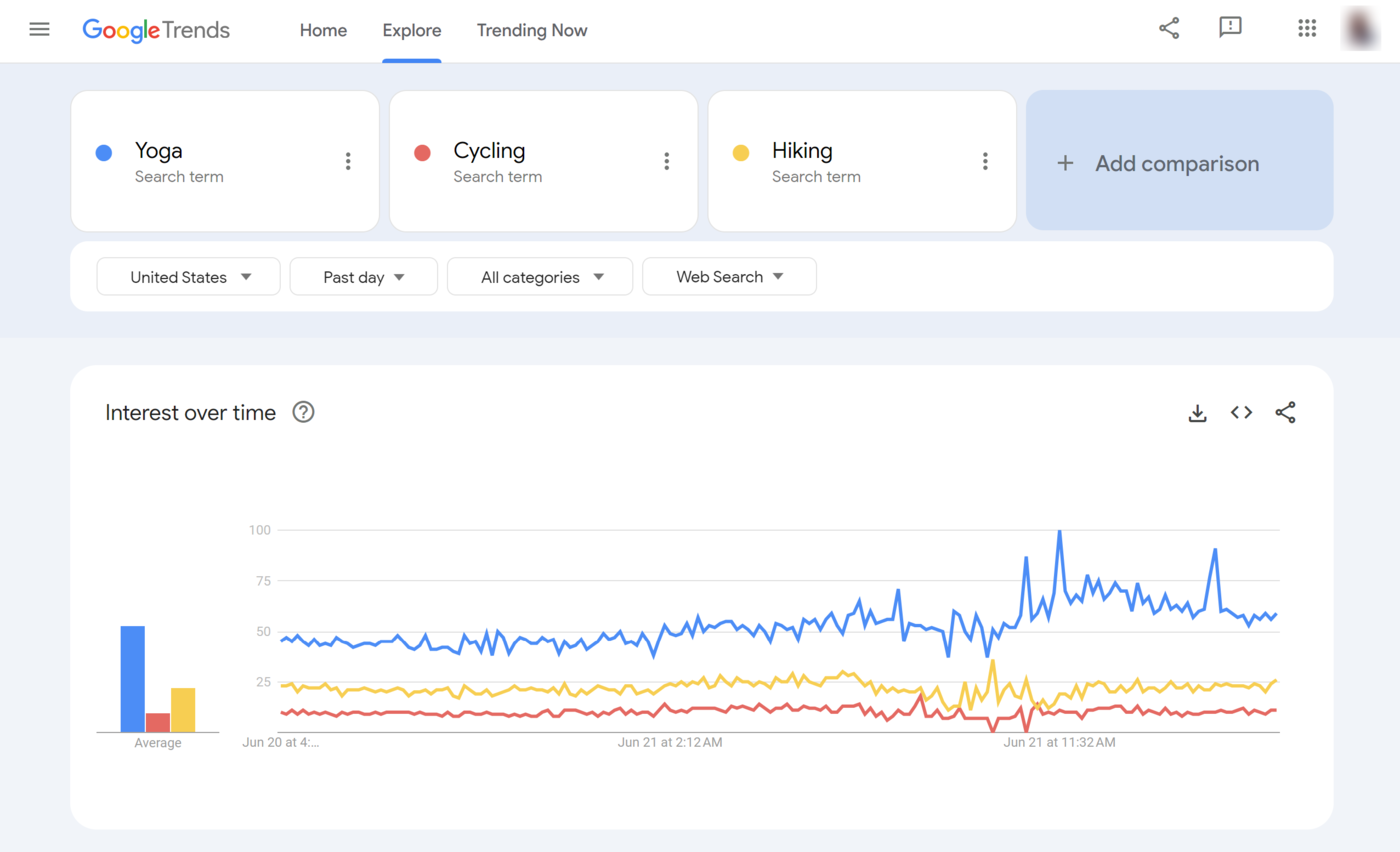
You can optionally enter more search queries by clicking the Vergelijken field and typing in the search query.
You can then proceed to compare your keywords. However, you may notice slight changes when comparing multiple search queries using the Trends tool.
For example, the Related Topics section will no longer be available. This is normal. Nevertheless, other options will be available and continue to function normally.
How to Use Google Trends for SEO
Google Trends is a valuable tool for SEO. SEOs, bloggers, and content creators use it for various purposes, including:
- Identifying valuable keywords
- Developing a local SEO strategy
- Leveraging seasonal trends
- Distinguishing between trends and fads
1 Identifying Valuable Keywords
SEOs use Google Trends to determine what keywords to rank for.
To do that, enter a keyword into Google Trends. Then, analyze its graphs for consistent interest or upward trends, which are two major indicators of a valuable and evergreen keyword.
As part of your keyword research, you will also review the related topics and queries sections:
- The related topics give you insights into the search intent of the keyword
- The related queries can be useful for identifying secondary keywords and subtopics to include in your content
2 Developing a Local SEO Strategy
Google Trends is helpful for SEOs looking to identify valuable local keywords to rank for. To get started, enter your keywords into Google Trends and set it to the region of your target audience.
Then, head to the “Interest by subregion” field to review which regions the keyword is most popular. You can further use the dropdown to view the keyword popularity by metro and city.
Once you have identified high-interest regions, create location-specific landing pages to target these areas.
3 Leveraging Seasonal Trends
Google Trends helps to identify seasonal search patterns. In this case, you will set the timeline to Past 5 years, 2004 – present, or a custom timeline covering a few years.
Now, review the data for rapid rises and drops, which are indicators of seasonal trends. For example, searches for “Christmas gifts” begin to peak in July and continue until reaching their peak in December. Then, they drop sharply in January.
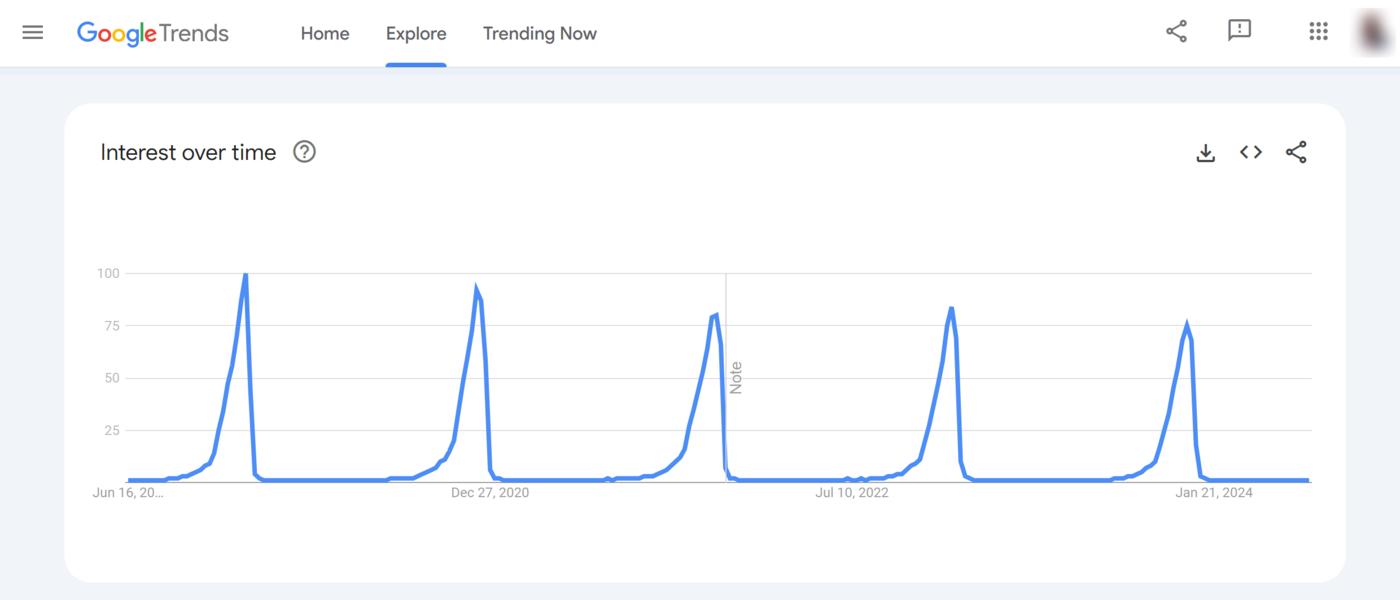
The seasonal trends allow SEOs to anticipate peak times for specific search terms and plan their content and marketing campaigns accordingly.
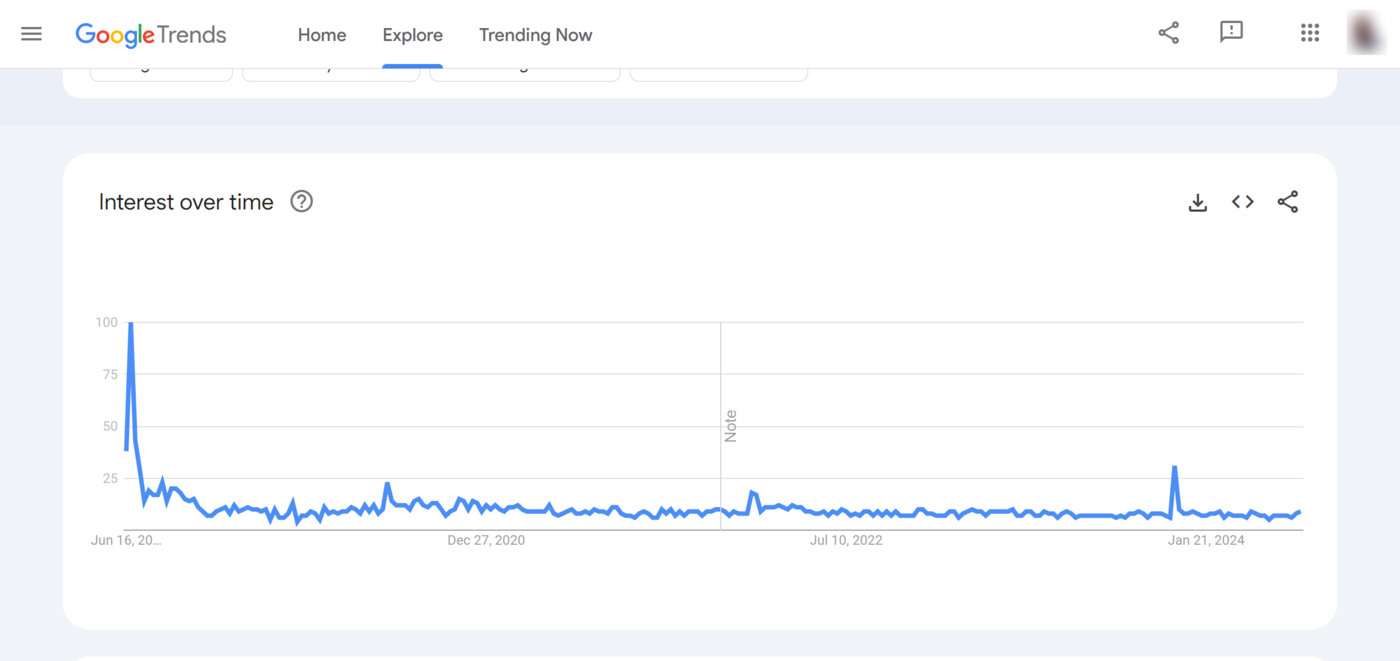
4 Distinguishing Between Trends and Fads
Google Trends helps determine whether a keyword is a trend or just another fad that will soon go away. This is useful to prevent you from investing time and effort into creating content with short life cycles.
In this case, you will enter the keyword into Google Trends and track its consistency over a few years. If a keyword shows sustained or growing interest over time, it’s likely a trend worth investing in.
However, if the interest spikes suddenly and then drops off, it is likely a fad.