What Is Average Position?
Average position is an SEO metric that shows the average ranking of your webpage for specific keywords on Google Search results pages. It helps you understand how high or low your webpages appear when users search for those terms.
A low average position (between 1 and 3) indicates your content ranks high on page one of Google. In contrast, a high average position, such as 20 or above, means your webpage appears much lower, often on the second or third page, or even beyond.
The average position metric is displayed in the Performance report of Console di ricerca di Google.
In questo articolo tratteremo:
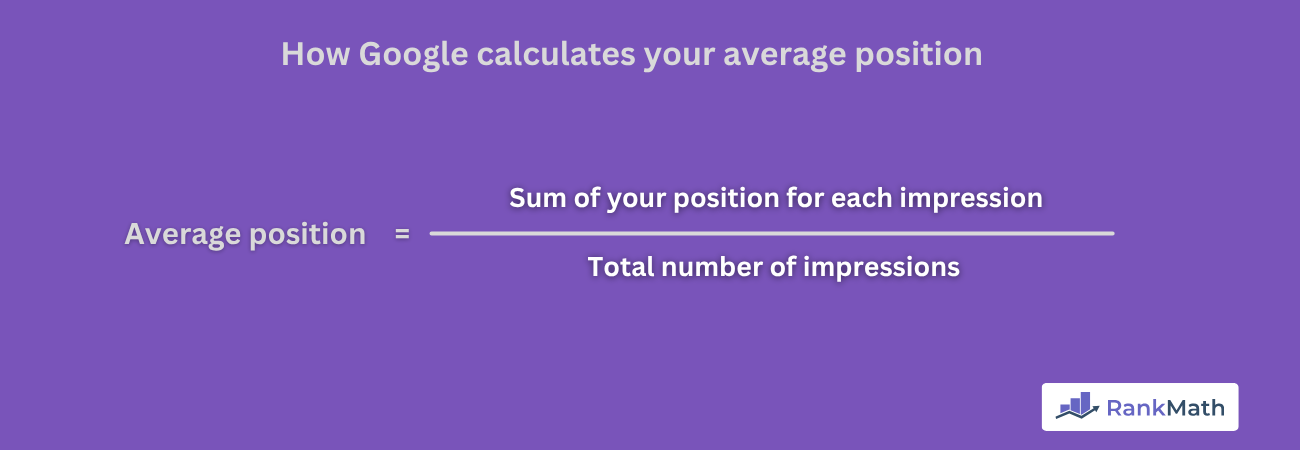
How Google Calculates the Average Position
Google calculates the average position by summing the position of your content for individual impressions in search results. It then divides this by the total impressions, which is to the number of times the content appeared on Google Search results pages.
This means Average position = Sum of your position for each impression / Total number of impressions.
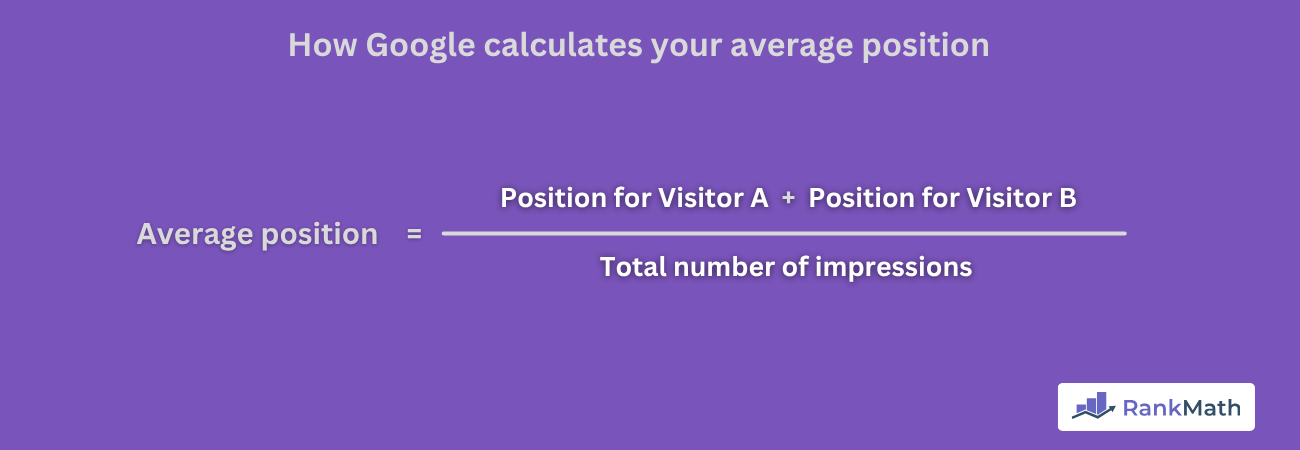
Per esempio, let us assume you have a content ranking for the keyword “Yoga.”
If two visitors searched for “Yoga” and your content showed up for both, your total impressions will be 2 (one for each visitor), while your average position will be (Position for visitor A + Position for visitor B) / Total impressions.
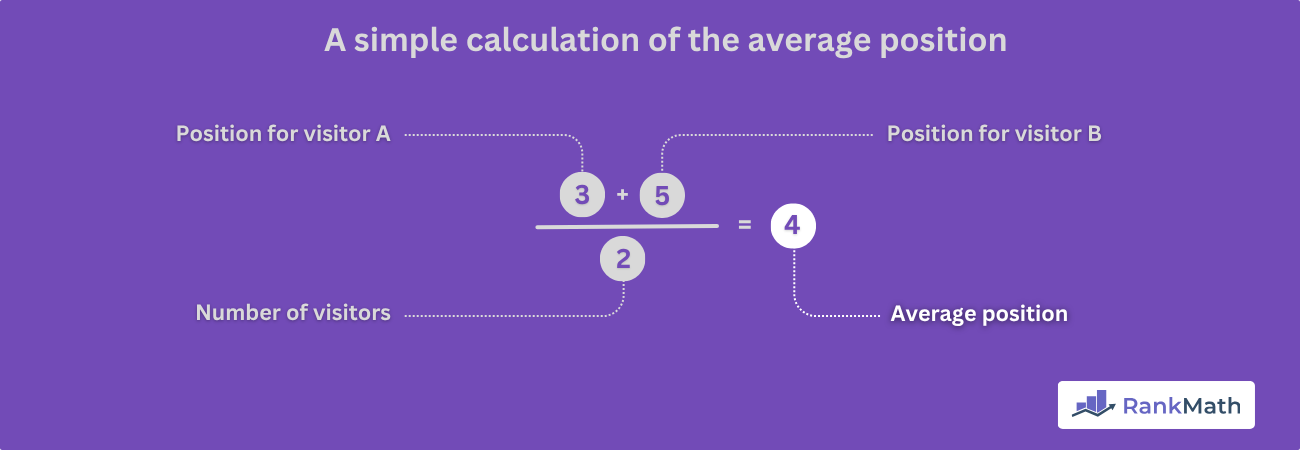
For instance, if your content appears in position 3 for Visitor A and 5 for Visitor B, your average position will be (3 + 5) / 2. That is 4.
Nota: A single visitor can perform multiple searches for the same keyword, and your webpage may appear at different positions for each search. In such cases, Google will use your topmost position as your position for that visitor.
For instance, if your content appears at position 3 for a visitor and then position 5 in a later search by the same visitor, your position for that visitor will be 3 since it is the topmost position.
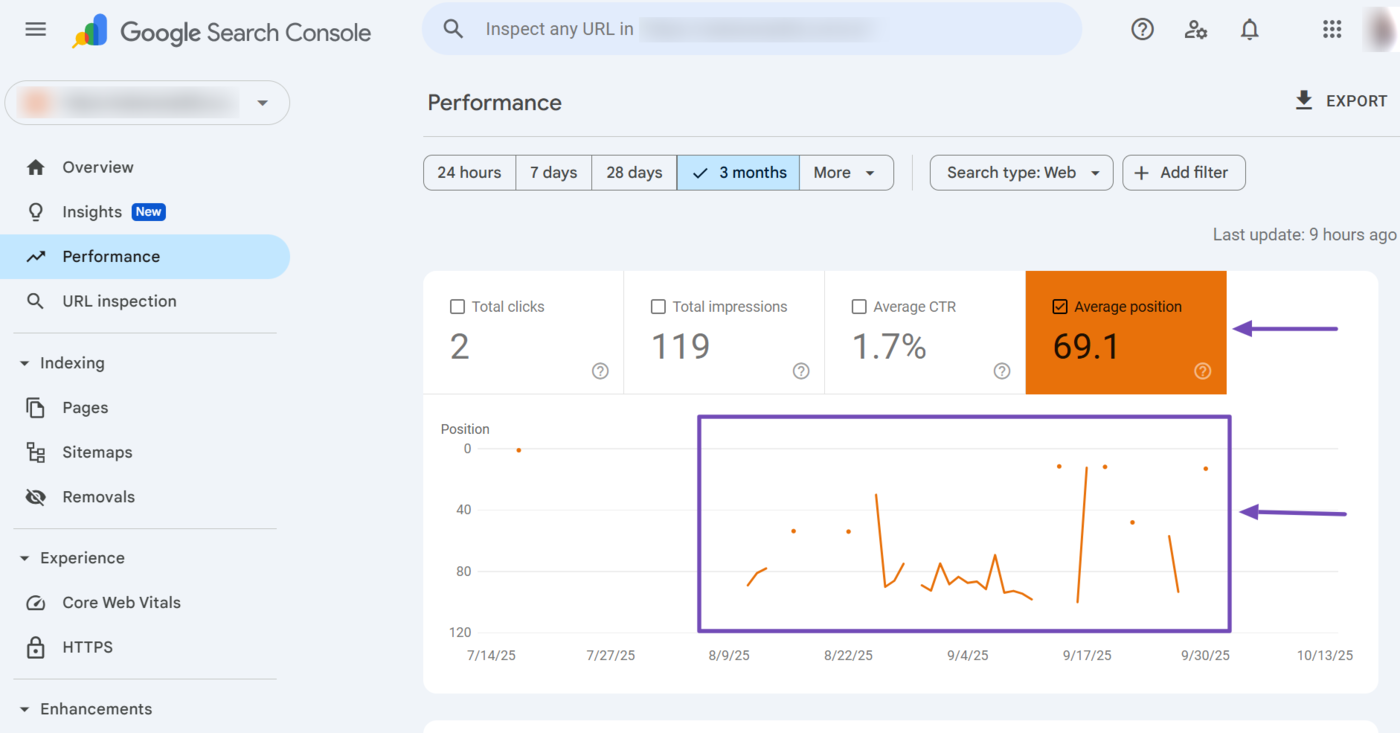
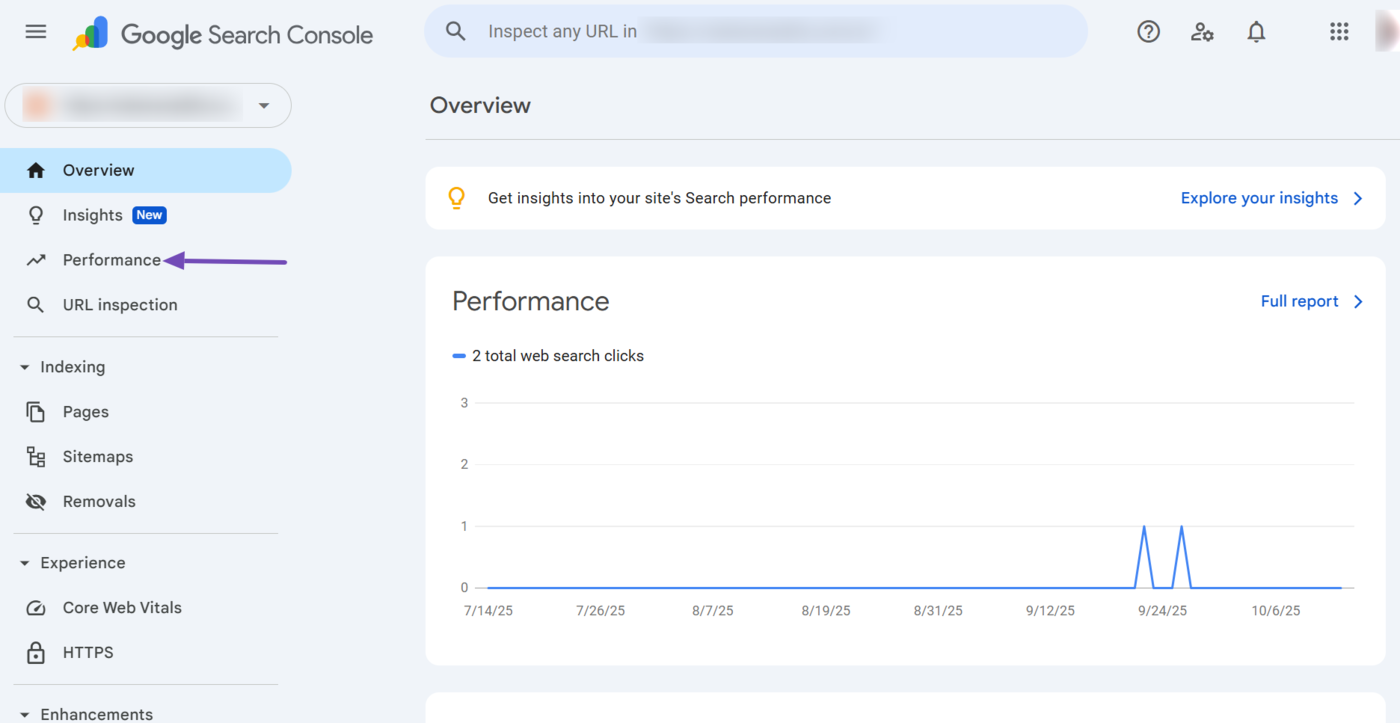
How to Locate the Average Position in Google Search Console
Head to your Google Search Console account and click Performance in the navigation menu.
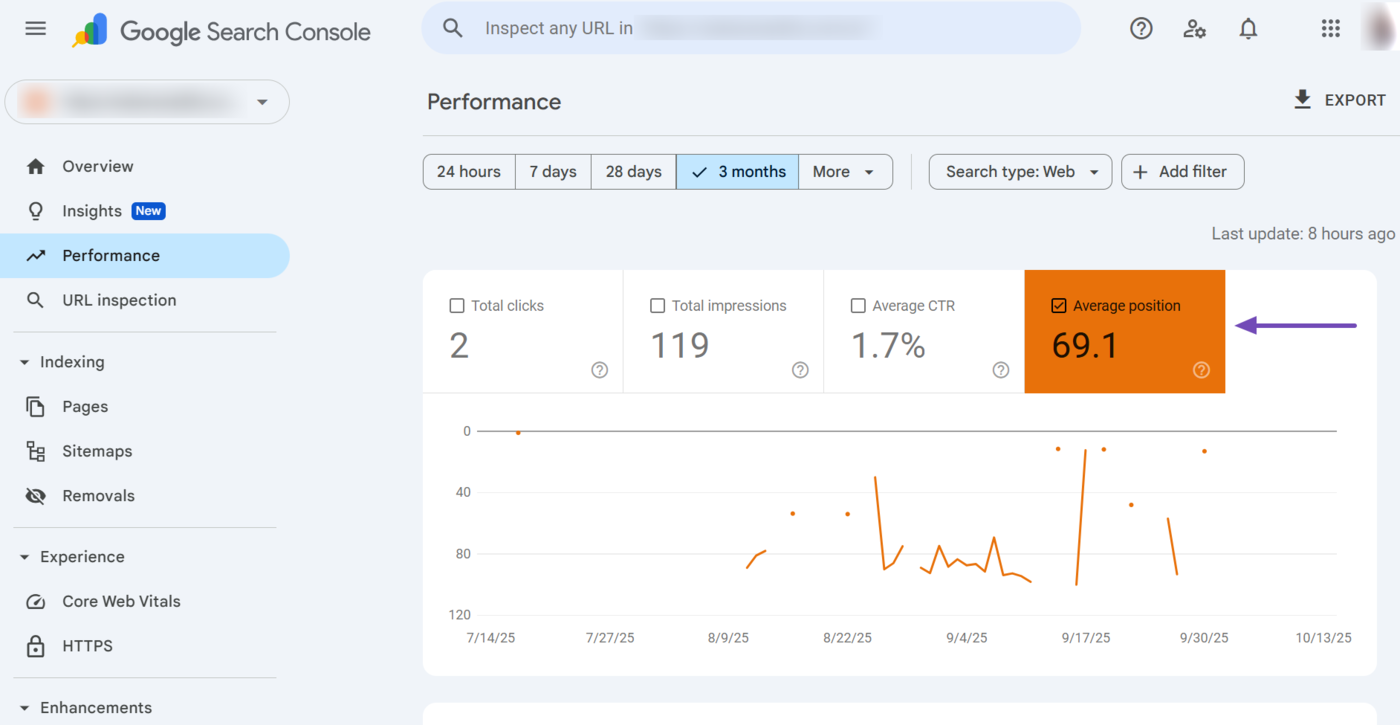
Next, enable the Posizione media metric.
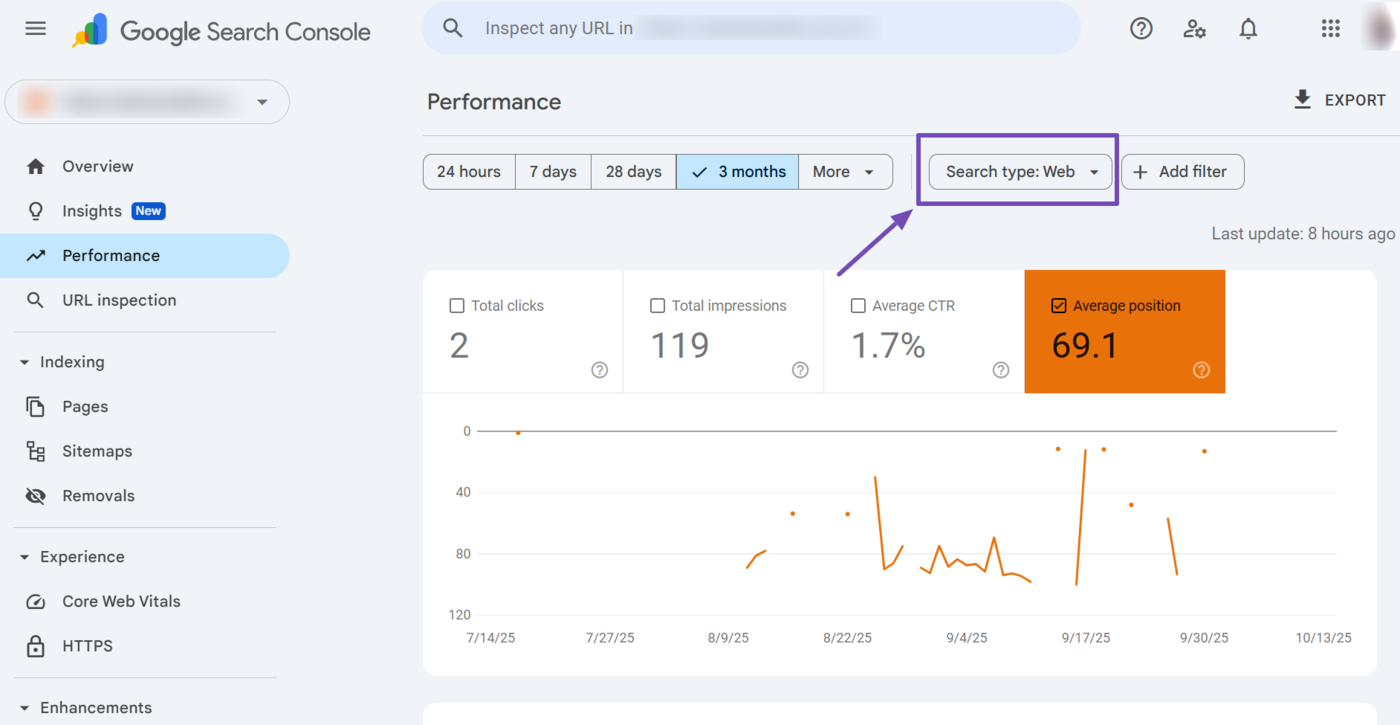
The average position metric will contain a check mark once it has been enabled. The metric’s label and graph line will also be color-coded, as shown below. In our example, it is orange.
Here is an overview of your average position report. You can see that the report contains multiple filters and dimension tabs, as shown below. You can use them to modify and uncover deeper insights into the average position report.
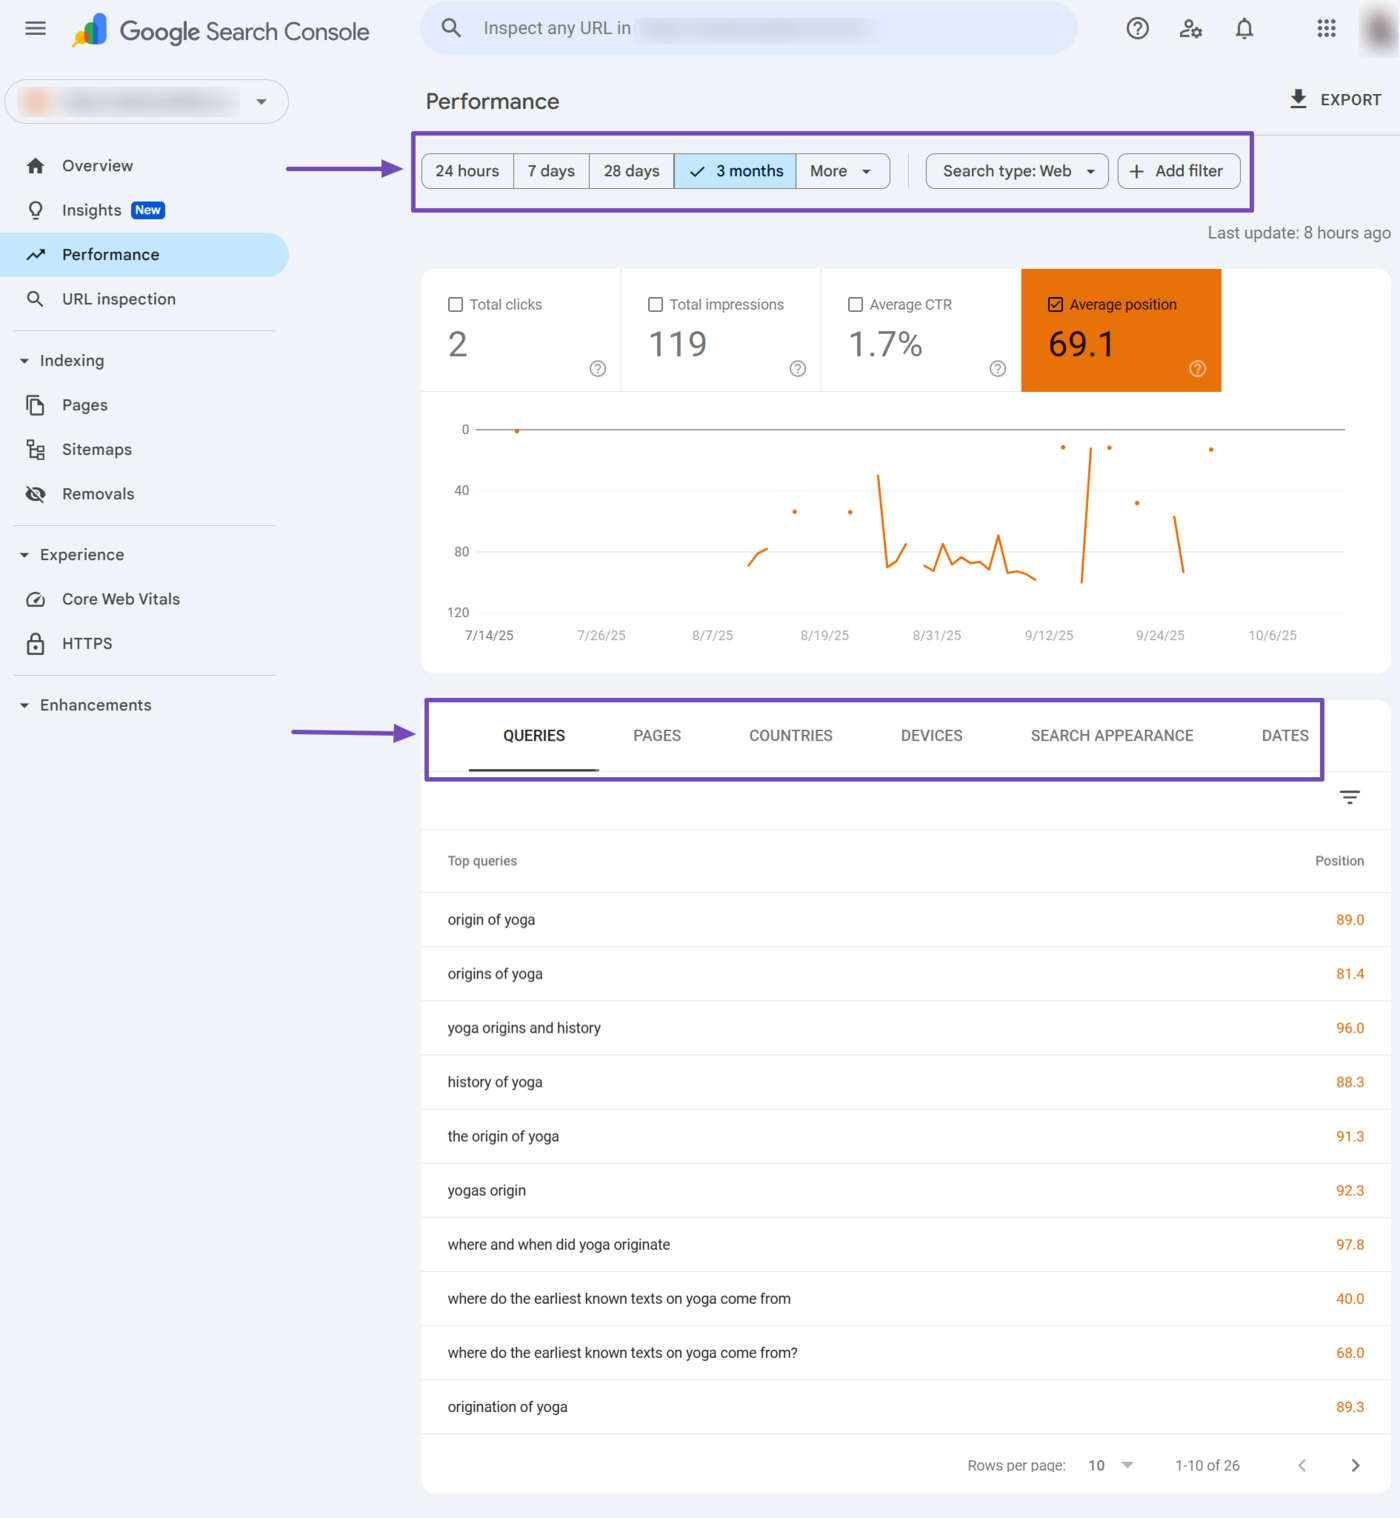
The available filters include:
- Date range
- Search type
- Query
- Page
- Country
- Device
Let us discuss them one after another.
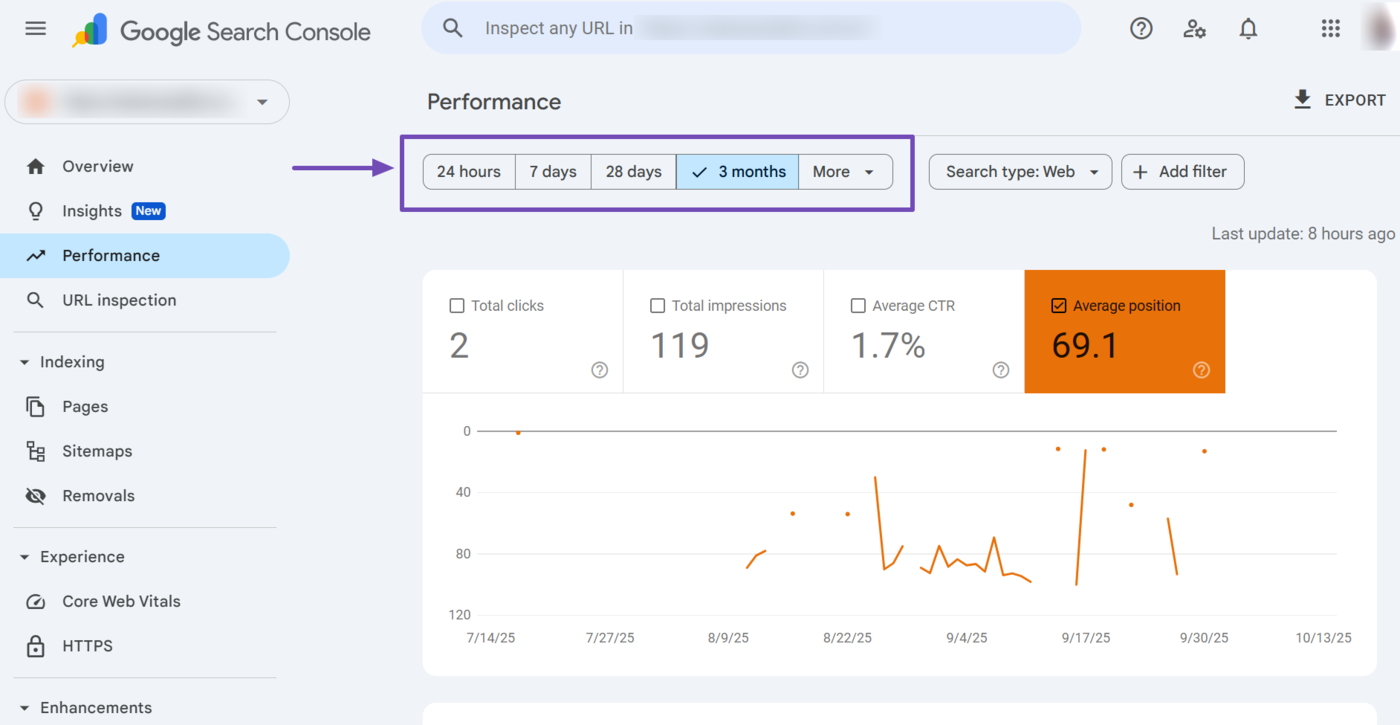
1 Date Range Filter
The date range filter is one important filter to focus on. You can select one of the following periods: 24 hours, 7 days, 28 days, or 3 months. You can also click Di più to set a longer or custom date range.
In most cases, you will be comparing your average position over the past month. So, you will want to select 28 days, which is approximately a month.
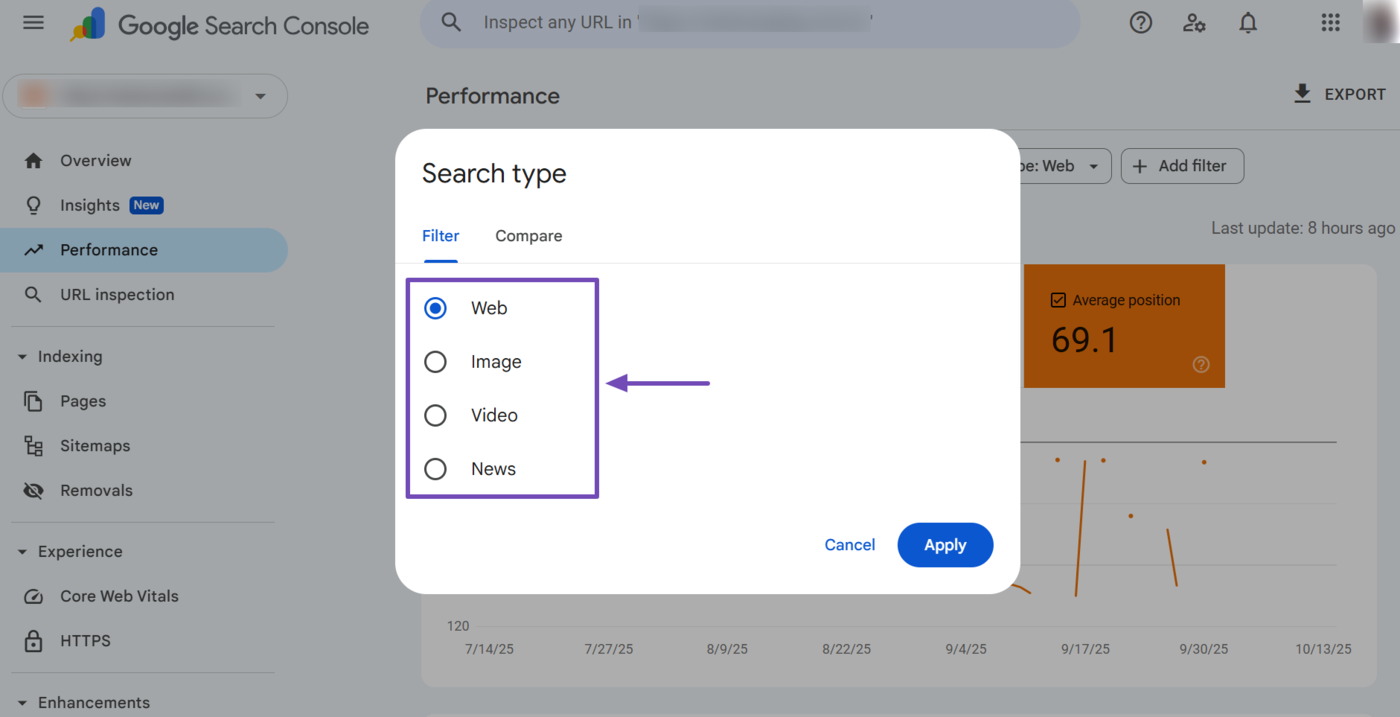
2 Search Type Filter
The search type filter allows you to view your site’s average position across different Google Search platforms.
The search type filter presents you with four secondary filters once clicked. They are Web, Image, Video, and News. Select a relevant one.
- Web: Shows your page’s average position on regular Google Search results pages
- Image: Shows your page’s average position when it appears in Google Images search results
- Video: Shows your page’s average position for video-related queries in Google Search or Google Videos
- Notizia: Shows your page’s average position when it appears in Google News or news-related search results
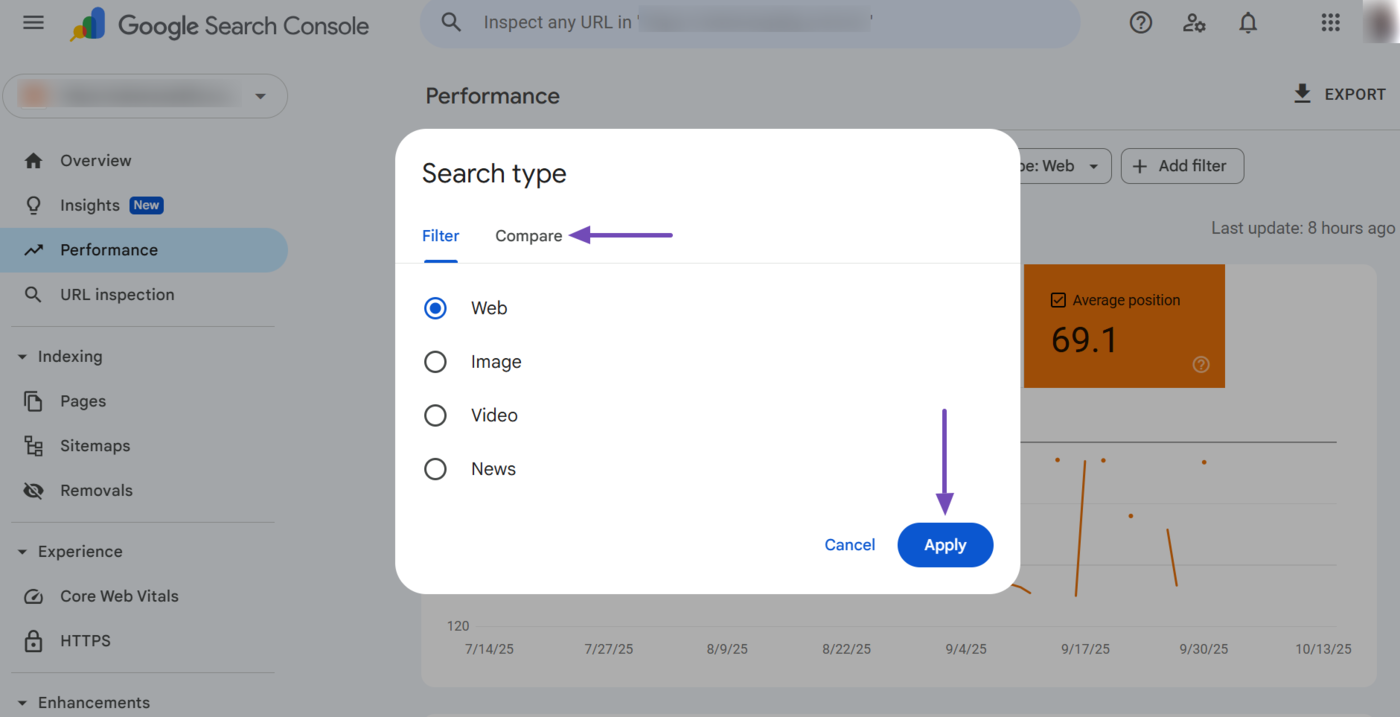
The search type filter also contains a Confrontare option. This allows you to compare your average position across multiple platforms. For example, you can compare your average position on Web and Image results.
Once done, click Apply.
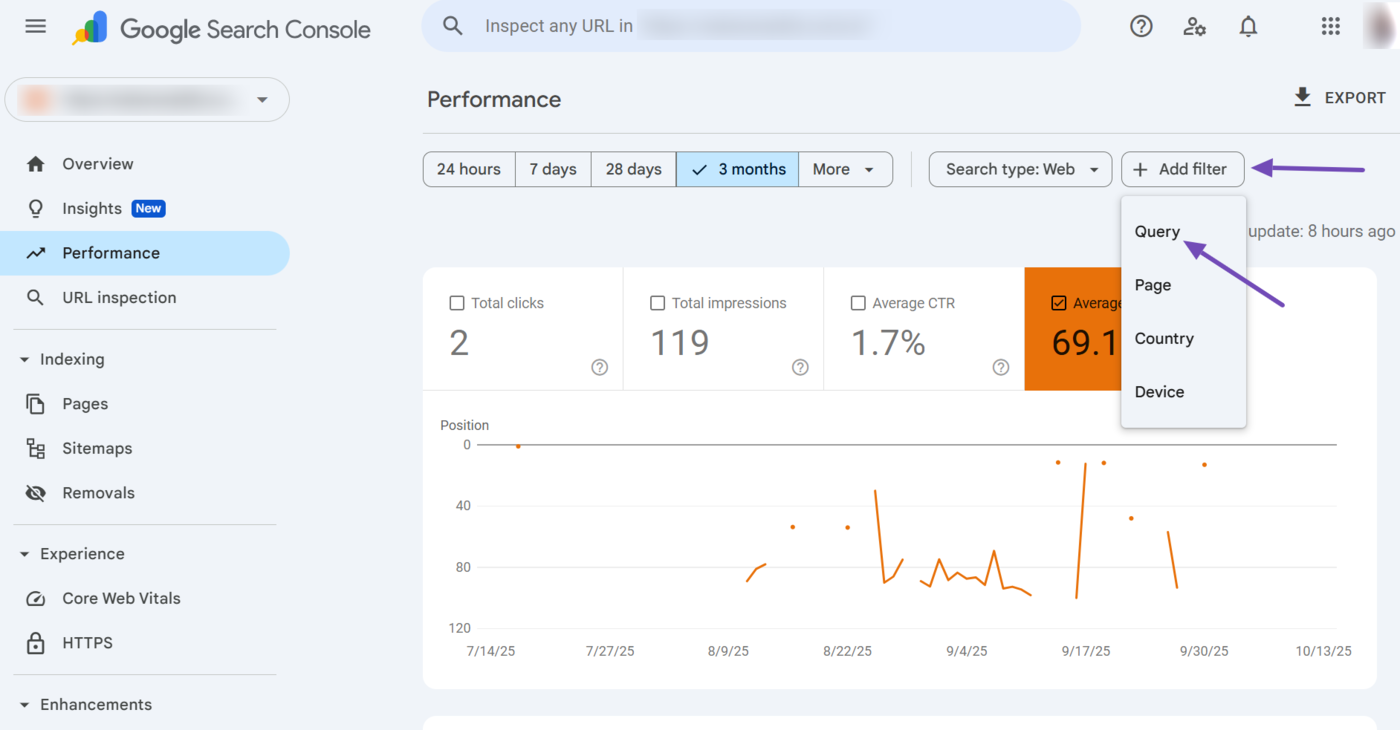
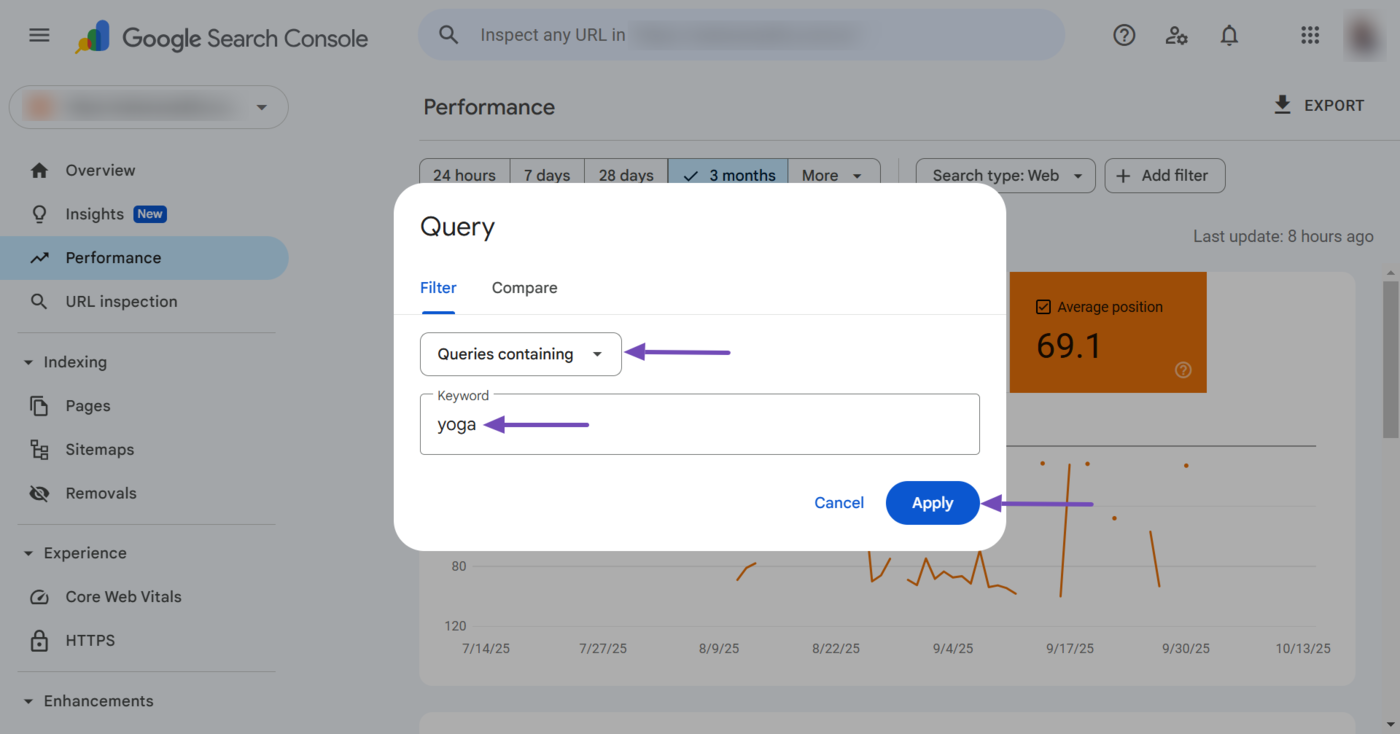
3 Query Filter
The query filter shows the average position of your page for a specific query di ricerca on Google. You can access it by clicking Add Filter → Query, as shown below.
Next, select the relevant secondary filter from the dropdown. The available ones include:
- Queries containing: Shows only search queries that include a specific word or phrase
- Queries not containing: Excludes search queries that contain a specific word or phrase
- Exact query: Shows results for the exact search query
- Custom (regex): Uses a regular expression to filter queries that match a defined pattern or rule
Nota: The regex option is for technical users. You can refer to this guide on using regex in Google Search Console.
Once done, you can enter the relevant parola chiave into the Keyword field. You can also compare multiple queries by clicking Confrontare. Once done, click Apply.
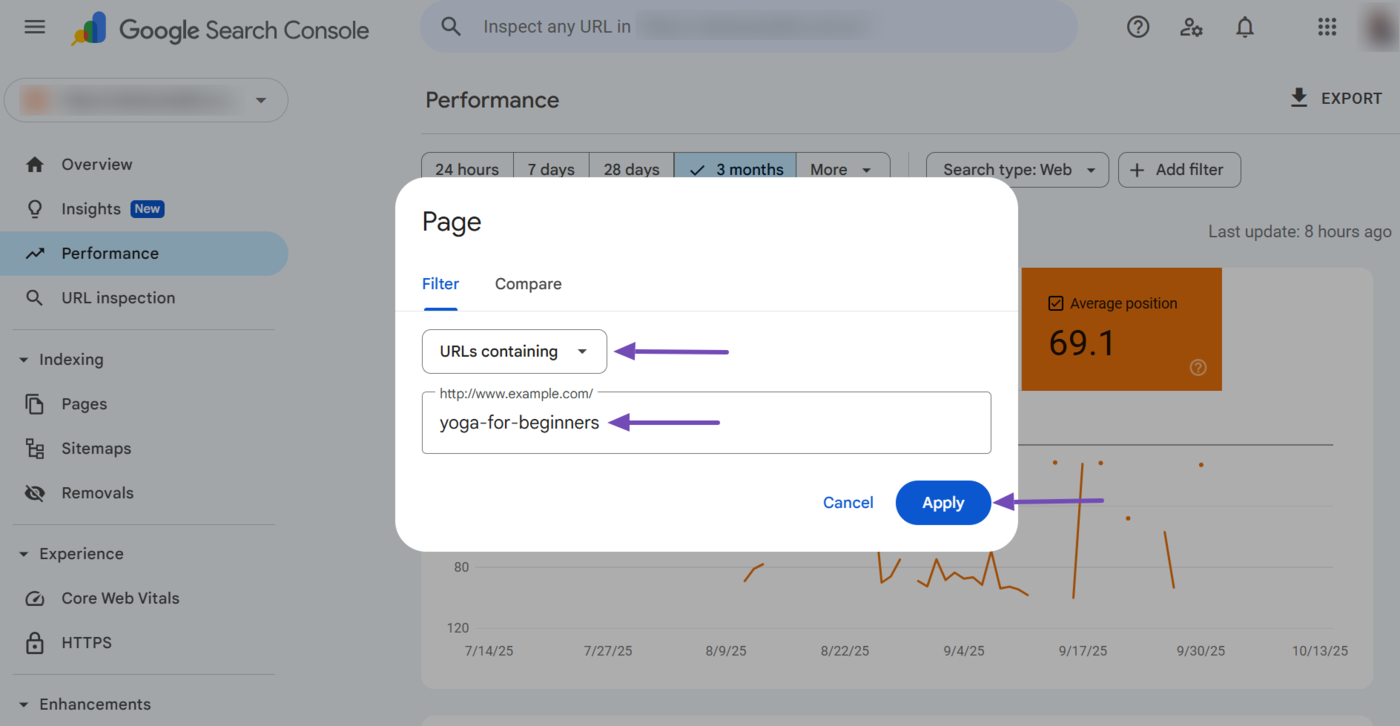
4 Page Filter
The page filter displays the average ranking position of a specific URL or webpage on Google. You can access it by clicking Add Filter → Page.
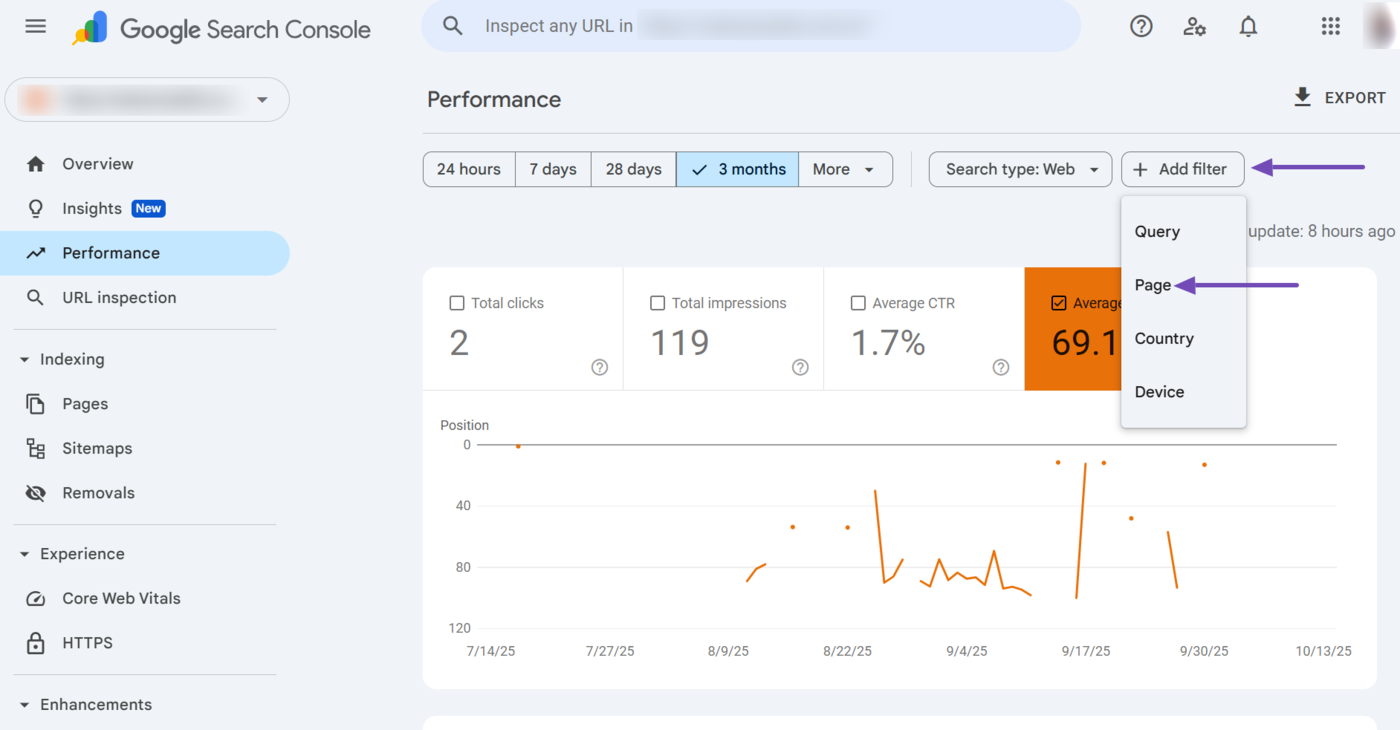
Next, select the relevant page filter option from the dropdown. The available options include:
- URLs containing: Shows the average position for pages with URLs that include a specific word or string
- URLs not containing: Excludes pages whose URLs contain a specific word or string
- Exact URL: Only shows data for the URL you specify
- Custom (regex): Uses a regular expression to match the URLs based on a defined pattern or rule
Once done, enter the URL, word, or string into the available field. You can also click Confrontare to compare multiple webpages, strings, or URLs. Once done, click Apply.
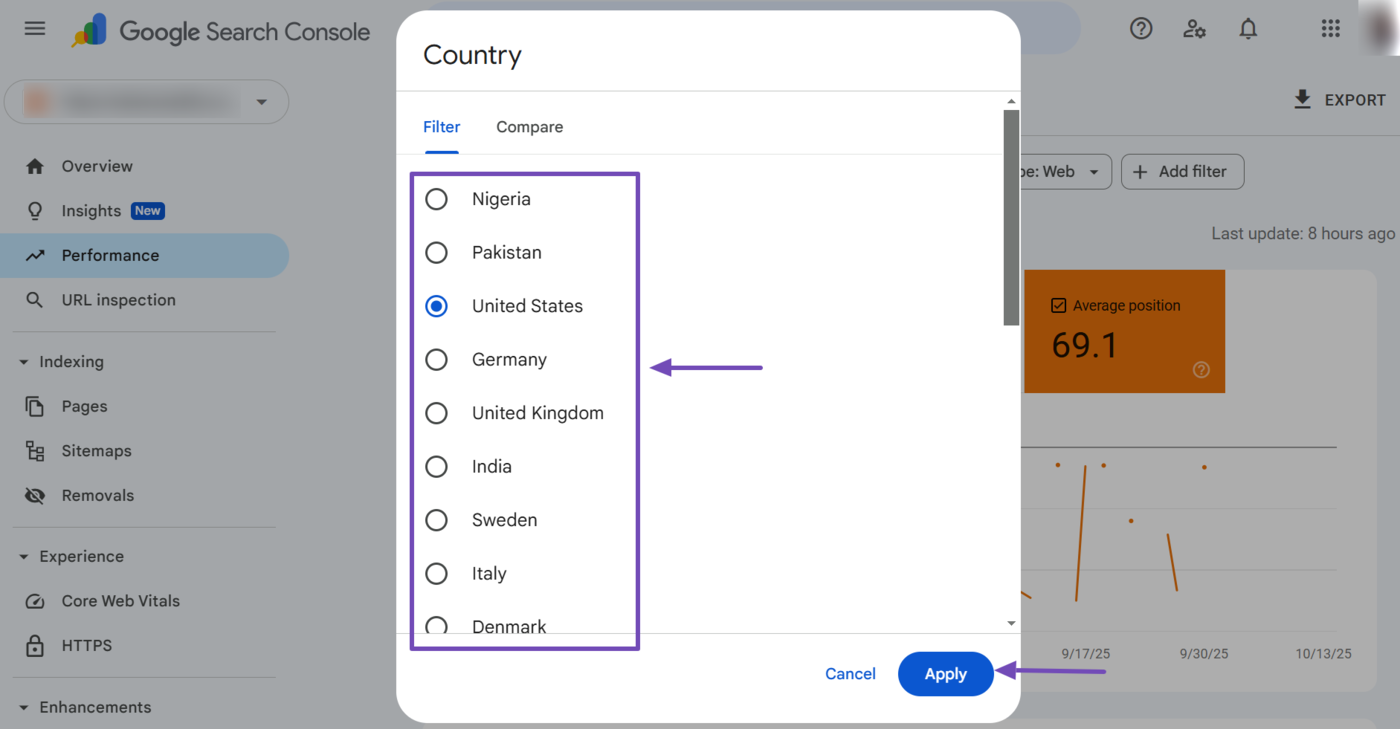
5 Country Filter
The country filter shows the average position of your webpages for searchers from a specific country. You can access it by clicking Add Filter → Country.
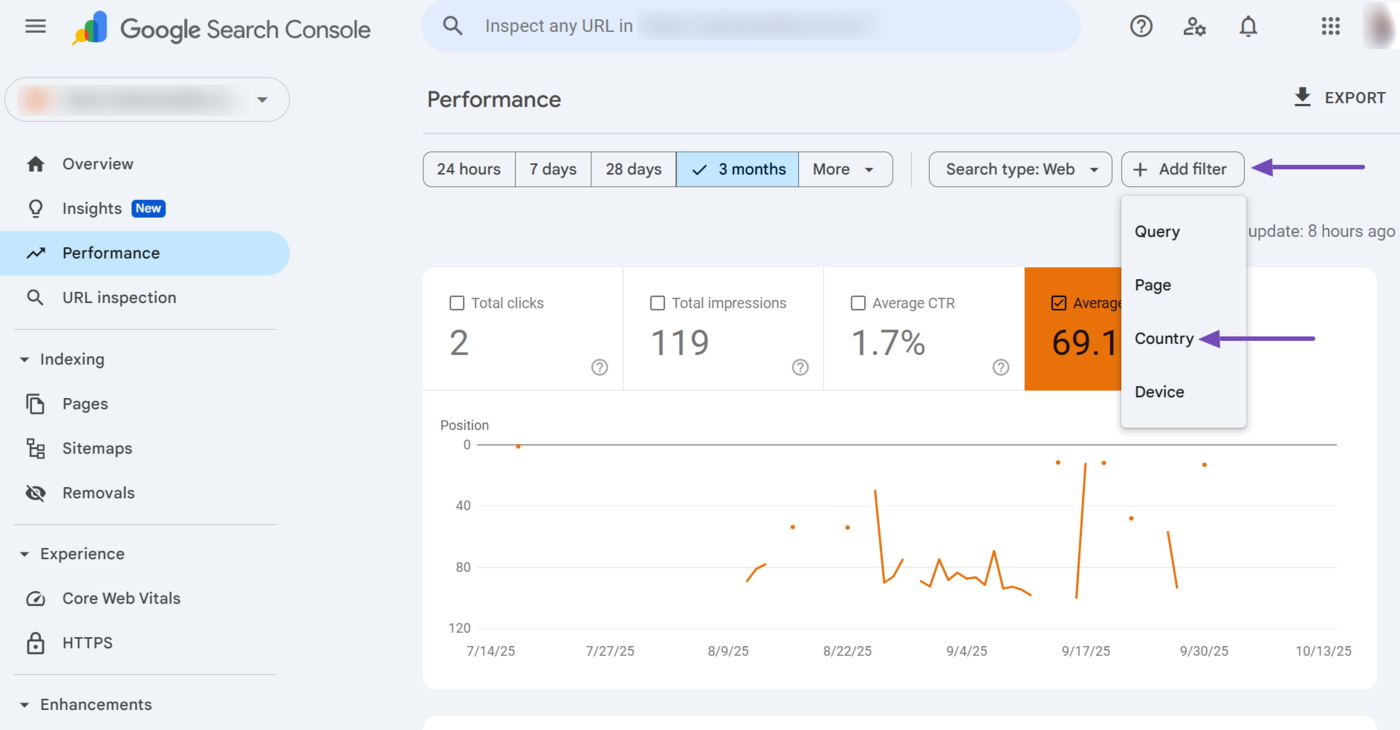
Once done, select the country. You can also click Confrontare to compare multiple countries. Once done, click Apply.
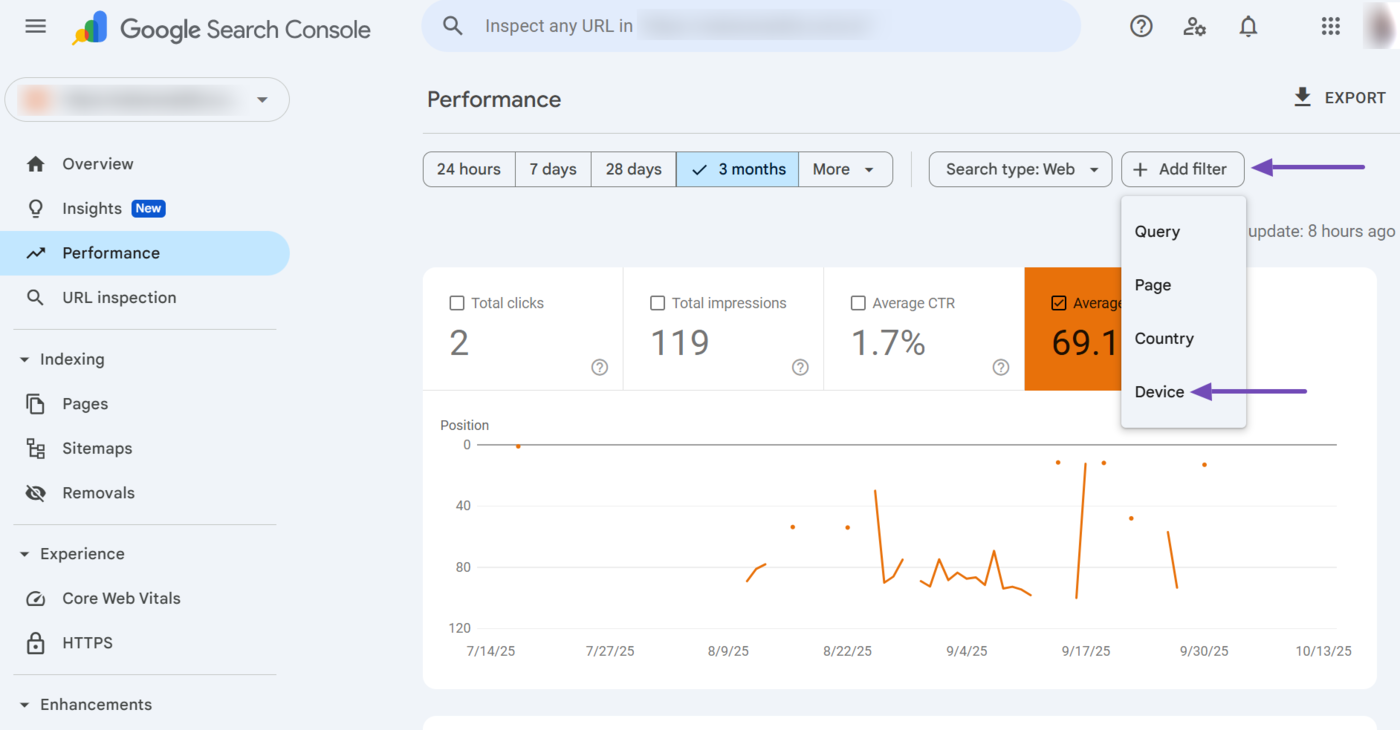
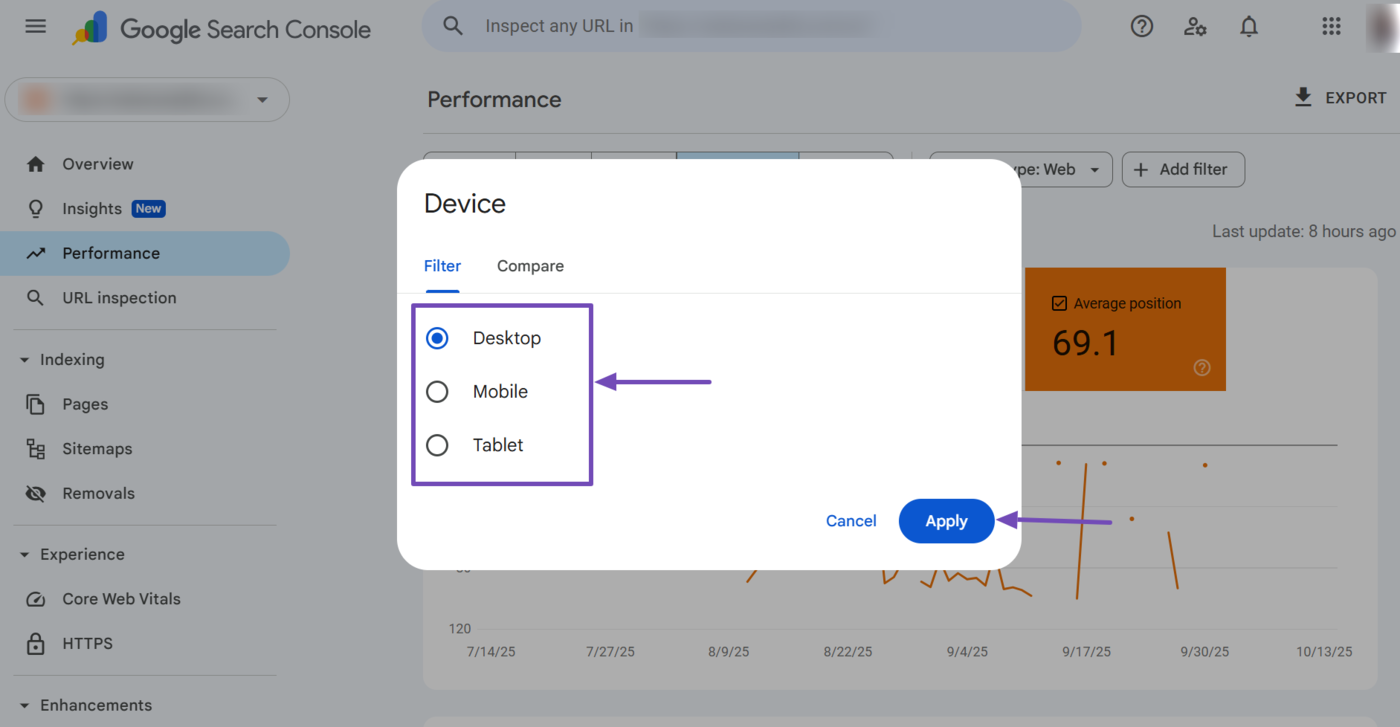
6 Device Filter
The device filter shows your page’s average ranking position based on the device used by the user. You can access it by clicking Add Filter → Device.
Then select the relevant device. The available options are desktop, mobile, and tablet. You can also click Confrontare to compare the average position on two different devices.
Once done, click Apply.
7 Dimension Tabs
When you scroll down the average position report, you will find the dimension tabs. These tabs are essentially shortcuts that allow you to filter the average position report.
The available dimension tabs include:
- Queries
- Pagine
- Paesi
- Devices
- Search appearance
- Dates
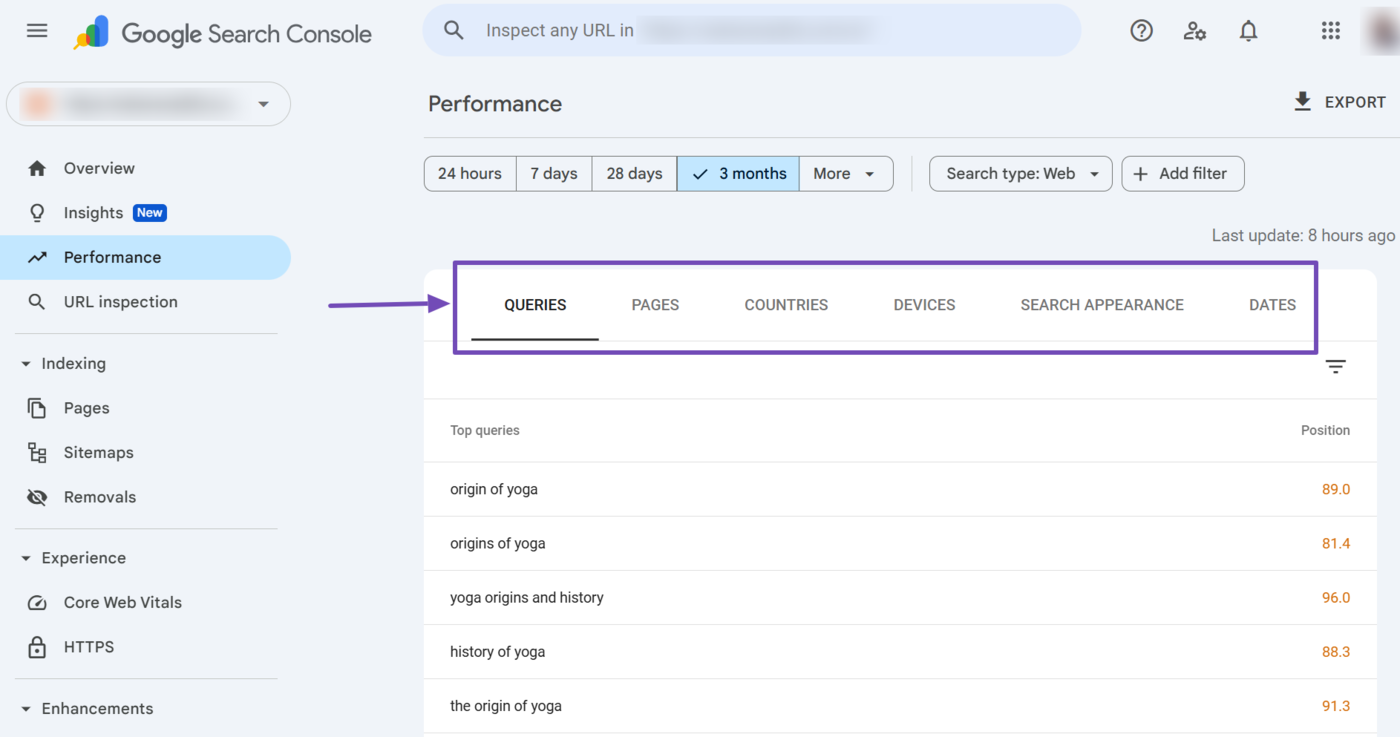
The dimension tabs are the same filters we already discussed. The average position for the respective dimensions is also provided in the Position column, as shown below.
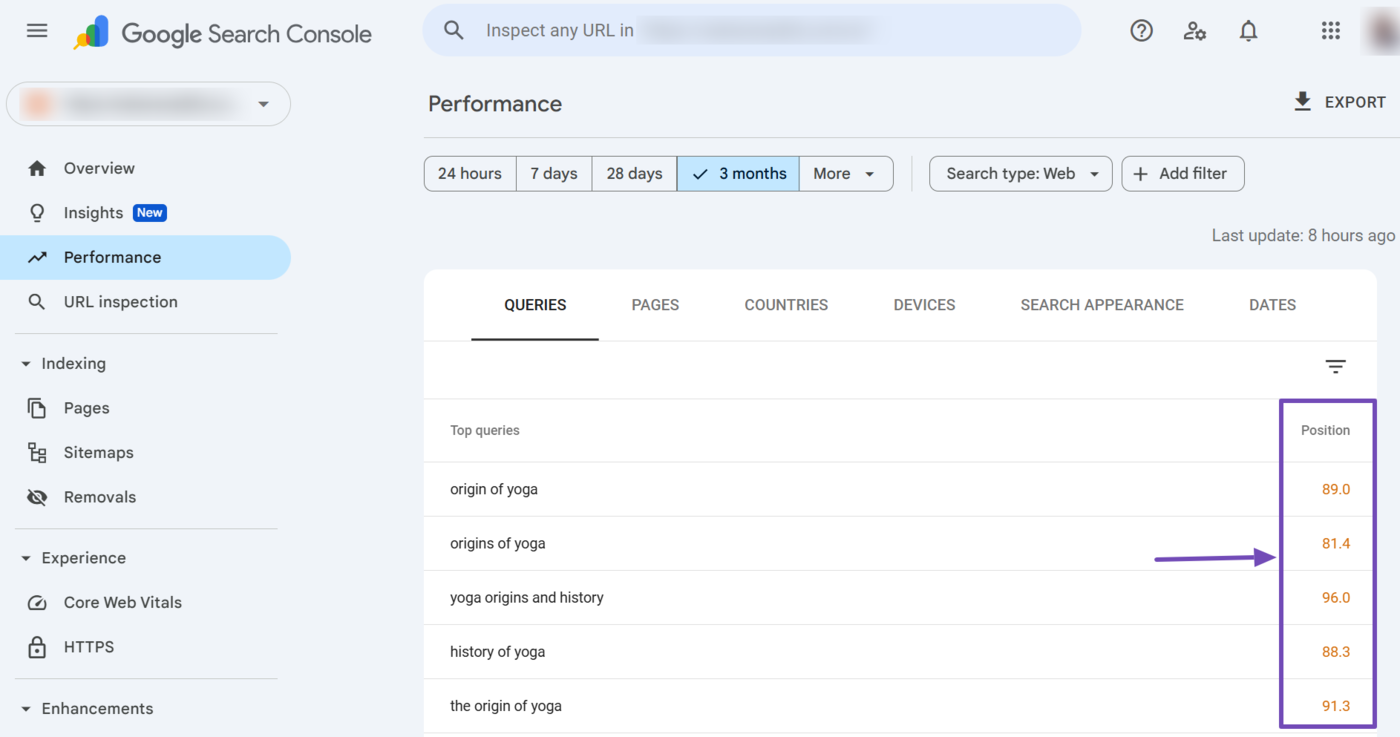
Clicking on any dimension within the dimension tab instantly applies the relevant filters to your average position report. Per esempio, one of our webpages ranks for the search query “Origin of yoga.”
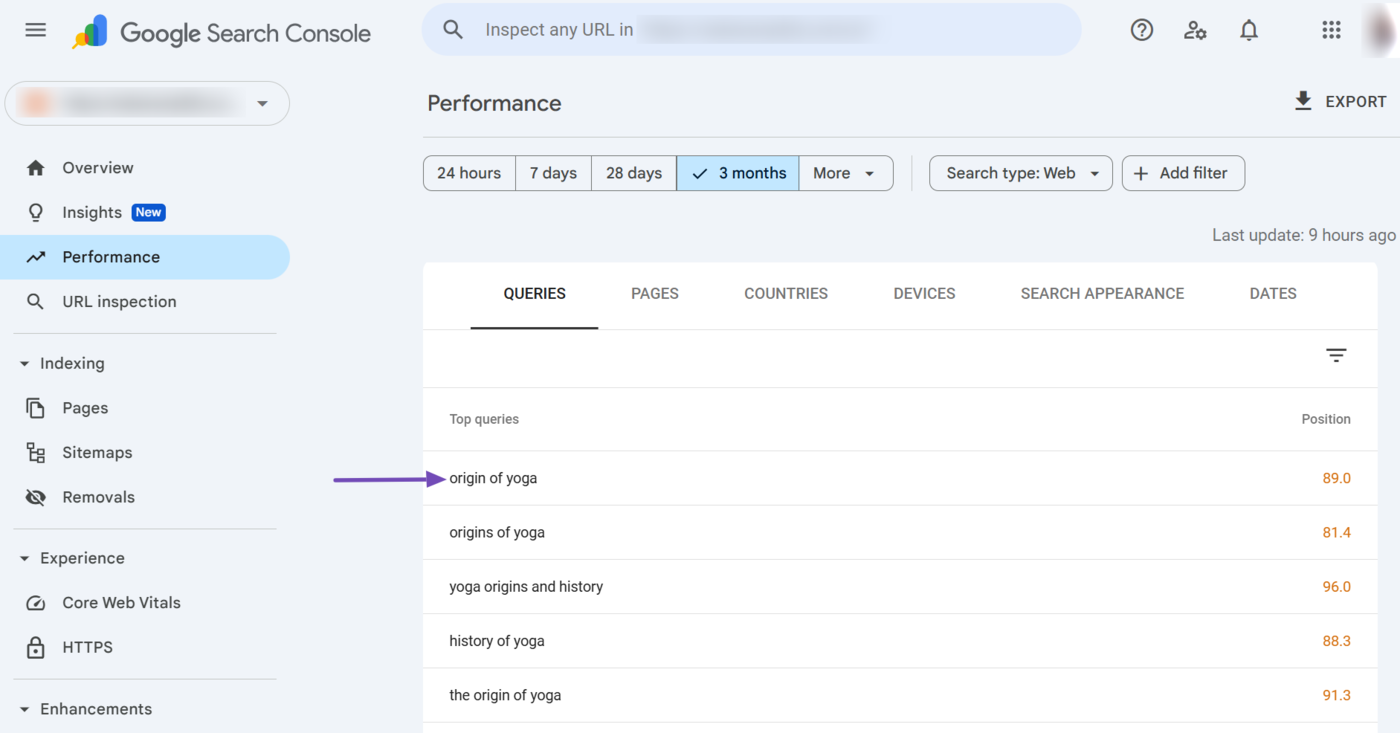
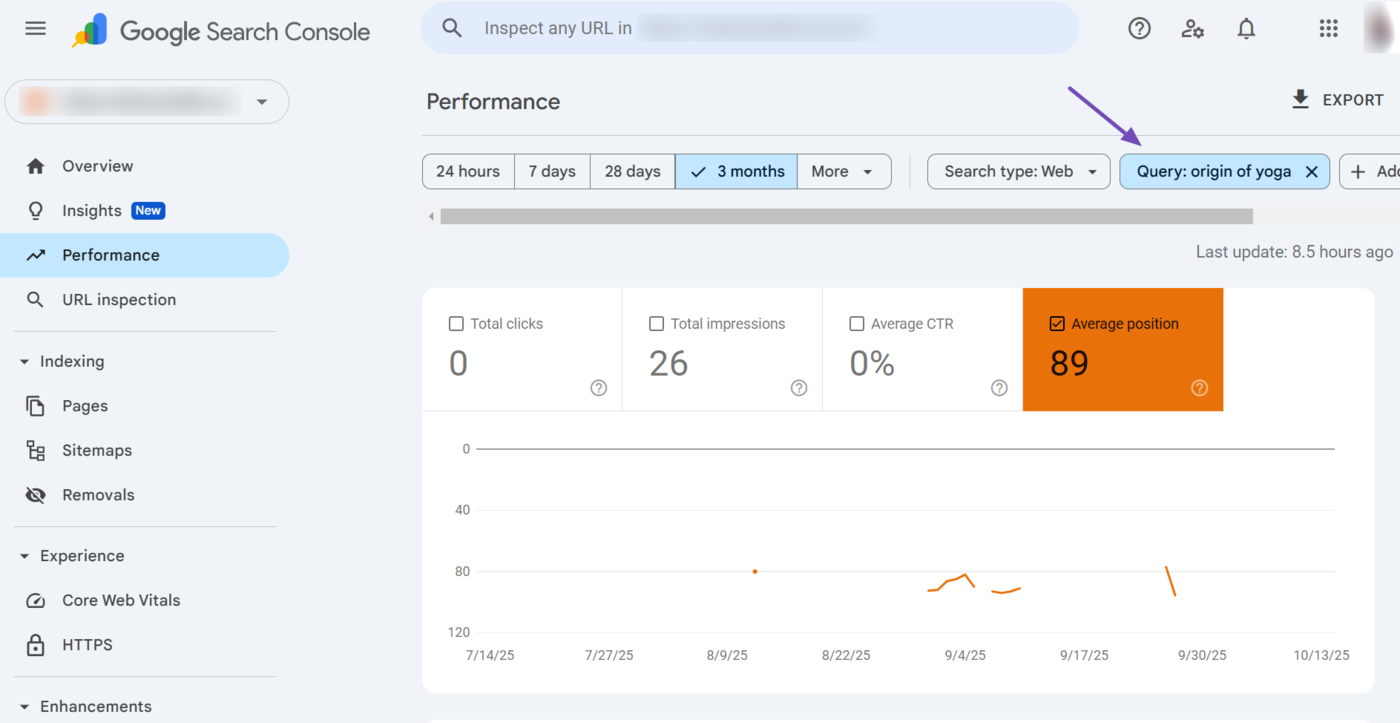
When we click on the “Origin of yoga” dimension in the Queries dimension tab, Google Search Console automatically adds a relevant query filter for the keyword to our average position report.
Average Position vs. Impressions, Clicks, and Click Through Rate
Bloggers typically evaluate the average position metric alongside other metrics. The specific metrics differ, depending on the particular insights they want to uncover. However, some common metrics include:
- Total clicks
- Total impressions
- Average click through rate (CTR)
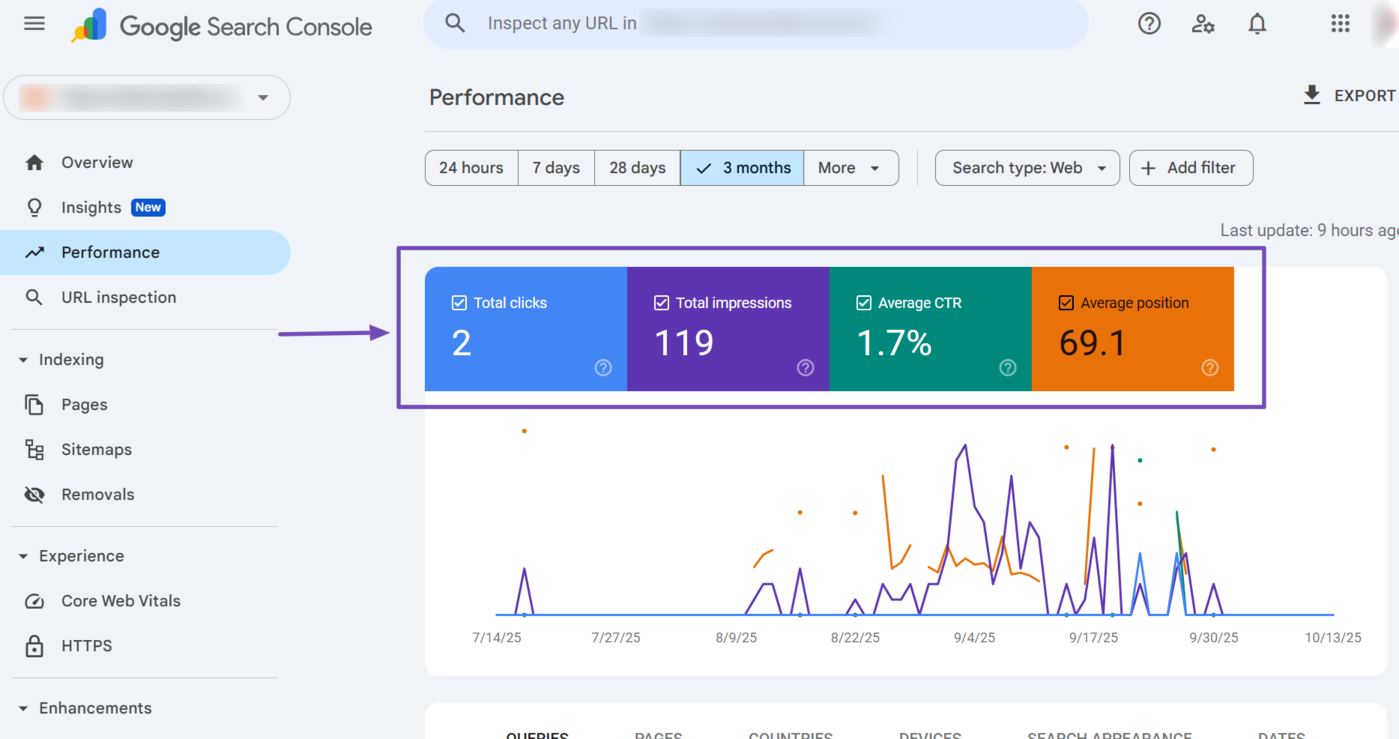
The Performance report in Google Search Console even contains all three metrics, along with the average position metric:
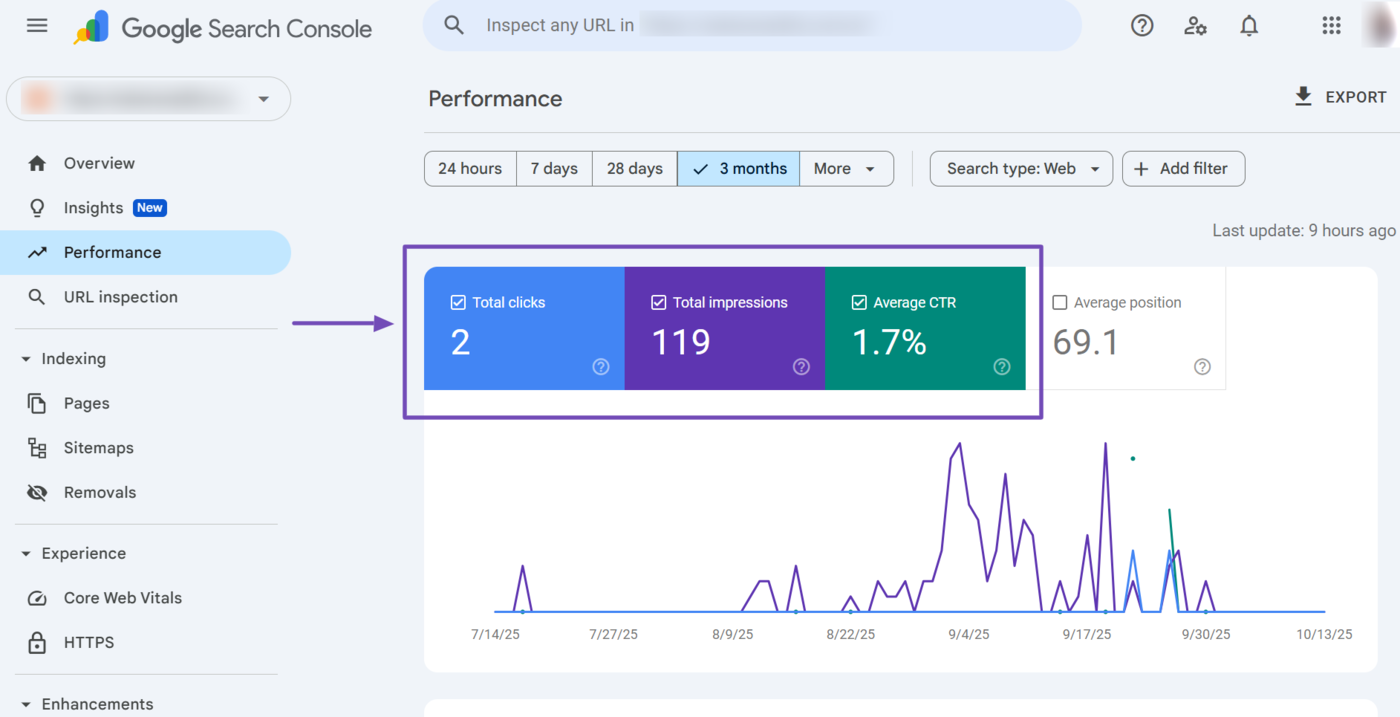
- Total impressions: Shows how many users saw your content on Google Search results pages
- Total clicks: Shows how many users clicked on your content on Google Search results pages
- Average click through rate (CTR): Shows the percentage of impressions that resulted in clicks
- Average position: Shows the average ranking of your content on Google Search results pages
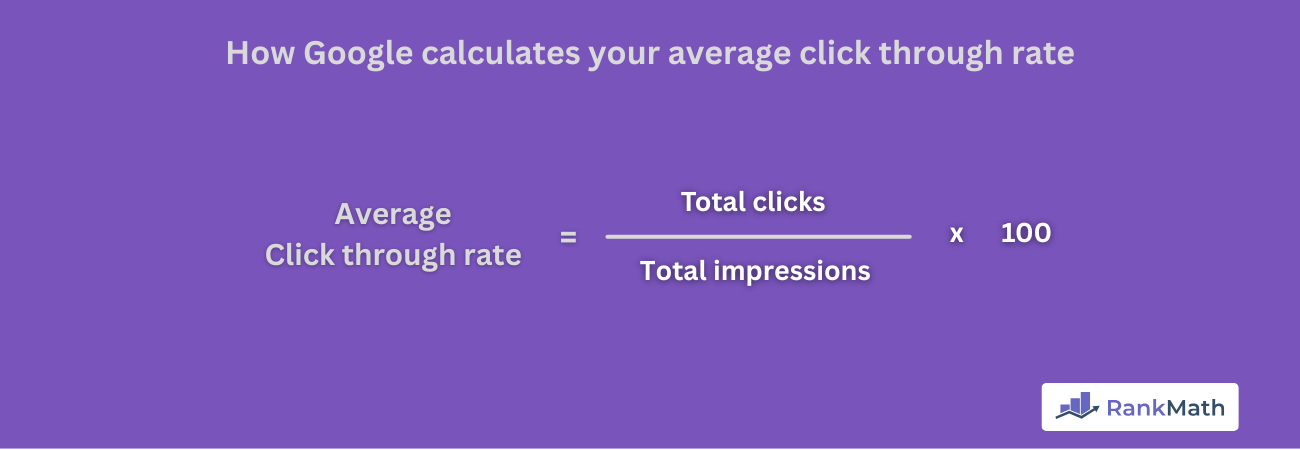
Nota: The average click through rate is calculated using (total clicks / total impressions) * 100 and is represented as a percentage.
Overall, you should assess your average position against these metrics as they give you a clearer picture of your visibility on search results and your target audience’s interest in your content.
This is crucial as a high position does not always translate into high engagement. In other words, even if your webpages rank well, they may still attract only a few clicks. Let us show you some use cases.
1 High Average Position + Low Impressions + Low Clicks
A high average position with low impressions and clicks suggests your page ranks well, but few people are searching for those keywords. This usually indicates that your keywords have a low search volume, which often happens when you target niche topics.
You can resolve this by optimizing the affected webpage for additional keywords, preferably those that have a higher search volume and are related to the current keyword.
2 High Average Position + High Impressions + Low CTR
A high average position and impressions with a low click through rate (CTR) indicate your content ranks well but is not attracting clicks. This can be due to a weak meta title, Meta Description, and a misaligned intento di ricerca.
You can improve this situation by improving the meta title and description of the content to ensure it grabs attention. You should also review the content to ensure it matches the searcher’s intent. You can refer to this guide on improving your meta title and description.
3 Low Average Position + High Clicks + High Impressions
A low average position with high impressions but low clicks indicates your content appears often, but ranks too low for most users to click. This suggests that your content is relevant, but there is more relevant content above yours.
You can improve this by improving your a pagina SEO e fuori pagina SEO. Optimize the content for stronger keywords and earn more backlink to the webpage. This will improve your position on search results pages.
How Bloggers Should Use the Average Position Metric
The average position metric can be easily misunderstood and misused, which can give you a wrong understanding of your content’s performance on search results pages. So, here are some tips on how to effectively use and get the most out of it.
1 Apply Relevant Filters
The average position score reported in Google Search Console is for your entire site. That is, it represents the average position of your entire content, including your best and worst-performing pages.
This clearly does not reflect the average position of your individual pages and can give you the wrong insights into your content’s performance on Google Search results pages.
For example, if a page ranks #1 for a keyword and another page ranks #49 for another keyword, you will end up with an average position of 25. This clearly does not reflect the position of either webpage.
To get more actionable insights, make sure to use the filters available in the performance report.

Specifically, you will want to focus on the page and query filters.
- Use the Page filter to identify your top-performing pages
- Use the Query filter to identify your best-performing keywords
You will also use other filters for deeper insights into the performance of your pages and keywords. For instance, the country filter can help you identify the location of your audience. You can then modify the content to appeal to a broader audience in that location.
2 Review the Average Position Alongside Other Metrics
Make sure to review the average position alongside other metrics, such as the total clicks, total impressions, and average click through rate (CTR).
You should also review the average position alongside other metrics such as the search volume. This is necessary as a higher average position does not always translate into more traffic. Instead, the amount of traffic you receive depends on the search volume.
A page can rank #1 for a keyword that only gets a few searches per month and still receive very little traffic, while another page ranking #8 for a high-volume keyword might get more visits.
In other words, the average position alone does not determine traffic. You must consider it alongside the search volume, which shows you how many people actually search for those terms.
3 Identify High-Performing Content
The average position report shows you content that ranks well on Google. Make sure to identify such content, especially the ones with great total impressions, total clicks, and an excellent click through rate.
You can then frequently monitor these pages to ensure they maintain their rankings. You should also review them to identify the strategies that make them successful. You can then apply these same techniques to other pages or even new content.
4 Identify Pages That Rank on Page Two
Content ranking on page two is close to reaching page one. This gives such pages a lot of potential and makes them highly valuable. In many cases, they only require small improvements to push them into the first page.
Therefore, make sure to identify such webpages, specifically those with average positions of between 8 and 12. Once done, review them to understand why they ranked well and how you can further optimize them to improve their rankings.
5 Monitor the Effects of SEO Updates
Google regularly releases updates to its ranking system. These updates can have a light or significant impact on your rankings and traffic, depending on their scope.
It is important to monitor your average position and other related metrics during these SEO updates. A noticeable improvement may indicate that your optimization efforts are working, while a drop in rankings could signal the need to adjust your SEO strategy.