Qu'est-ce que l'indice de vitesse ?
L'indice de vitesse est un indicateur qui mesure la rapidité avec laquelle le contenu visuel d'une page web s'affiche pendant le chargement de la page. Plus le score est bas, plus la vitesse de la page est élevée et meilleure est l'expérience de l'utilisateur.
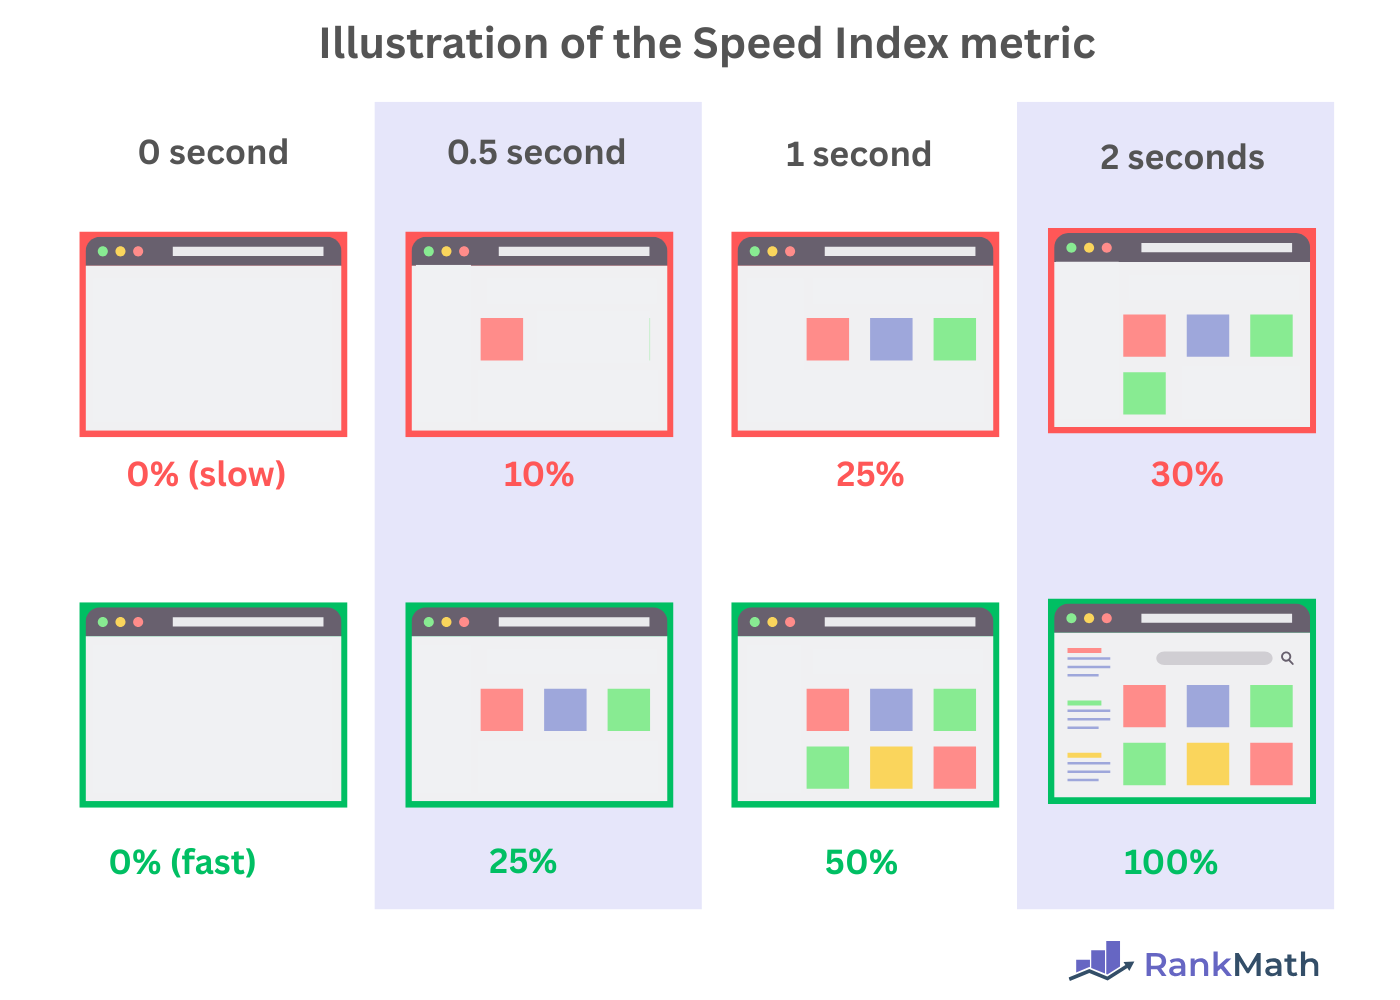
Par exemple, l'image ci-dessous évalue l'indice de vitesse de deux pages web. La page web lente a chargé 30% de son contenu en 2 secondes, tandis que la page rapide a chargé l'intégralité de son contenu en 2 secondes.
Étant donné que la page rapide affiche le contenu visuel plus tôt, elle obtient un score d'indice de vitesse inférieur et meilleur.
L'indice de vitesse est évalué en analysant la progression visuelle d'une page pendant son chargement et en déterminant la rapidité avec laquelle le contenu visible apparaît dans la fenêtre de visualisation. Toutefois, il donne la priorité au contenu important qui apparaît plus tôt dans le processus de chargement de la page.
Cela signifie qu'un site aura un bon indice de vitesse s'il se charge de manière vitale au-dessus du pli tels que le Balise d'en-tête h1 et l'image du héros, suffisamment tôt, même s'il charge d'autres contenus, tels que des publicités ou des sous le pli images, plus tard.
Dans cet article, nous aborderons les sujets suivants
L'indice de vitesse est-il un facteur de classement ?
L'indice de vitesse n'est pas un facteur de classement et il est utilisé pour évaluer d'autres facteurs. vitesse des pages des mesures telles que la première peinture de contenu (FCP) et le la peinture la plus volumineuse (LCP).
Importance de l'indice de vitesse
L'indice de vitesse est un indicateur important car il mesure la rapidité de chargement du contenu visible d'une page web. Il est donc utile pour évaluer la manière dont les visiteurs perçoivent la vitesse de chargement de la page.
Par exemple, la peinture la plus volumineuse évalue le temps de chargement de l'élément le plus volumineux de la page web, tandis que la première peinture évalue le temps de chargement du premier élément de la page.
En revanche, l'indice de vitesse n'évalue pas le moment où un élément spécifique se charge. Il mesure plutôt la rapidité avec laquelle le contenu visuel apparaît à l'écran lors du chargement de la page.
Dans l'ensemble, l'indice de vitesse est idéal pour évaluer les performances générales de chargement des pages plutôt que des éléments individuels. Un indice de vitesse plus court signifie que les utilisateurs voient le contenu significatif plus tôt, ce qui réduit la frustration et améliore l'engagement, les taux de conversion et les performances globales de la page. expérience utilisateur.
Comment mesurer votre indice de vitesse
Vous pouvez mesurer votre indice de vitesse à l'aide de l'outil PageSpeed Insights de Google. L'outil affichera le score de votre indice de vitesse et fournira des suggestions pour vous aider à l'améliorer.
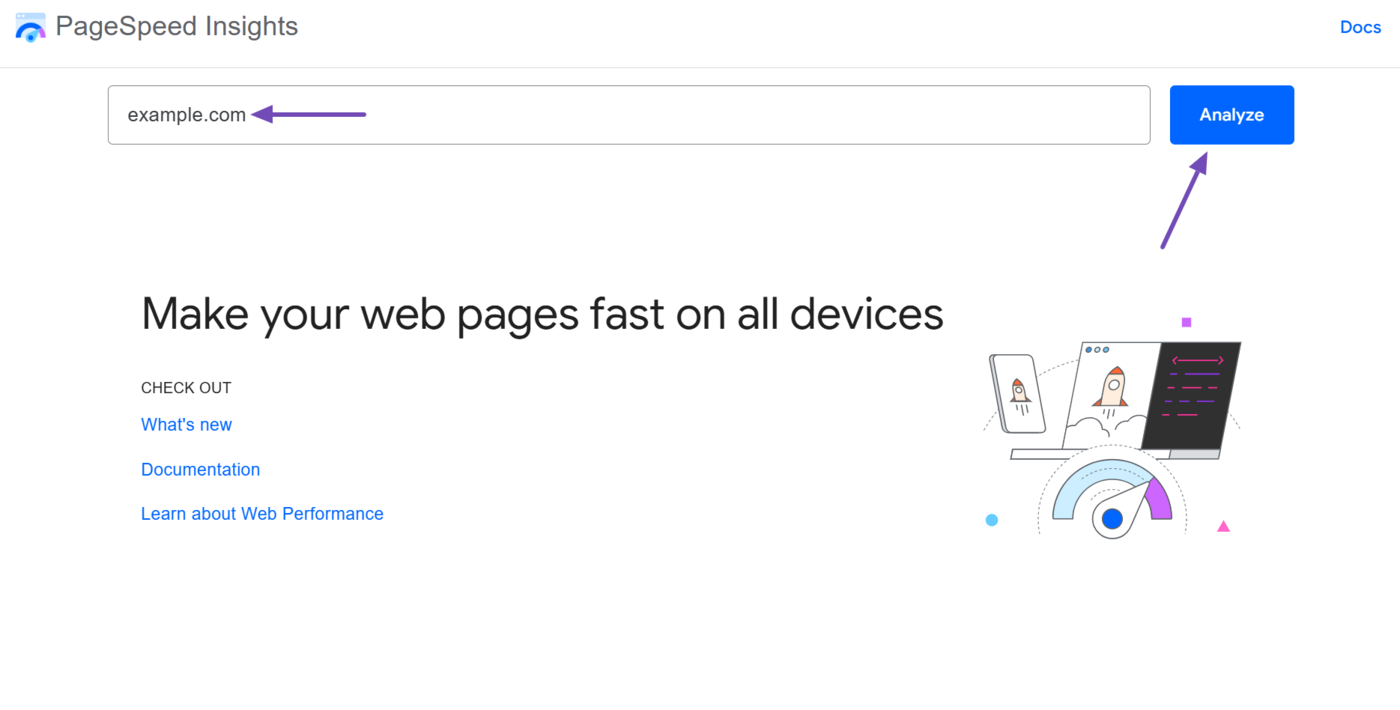
Pour commencer, rendez-vous sur le site Outil PageSpeed Insights et saisissez l'URL que vous souhaitez inspecter dans le champ disponible. Une fois que vous avez terminé, cliquez sur Analyser.
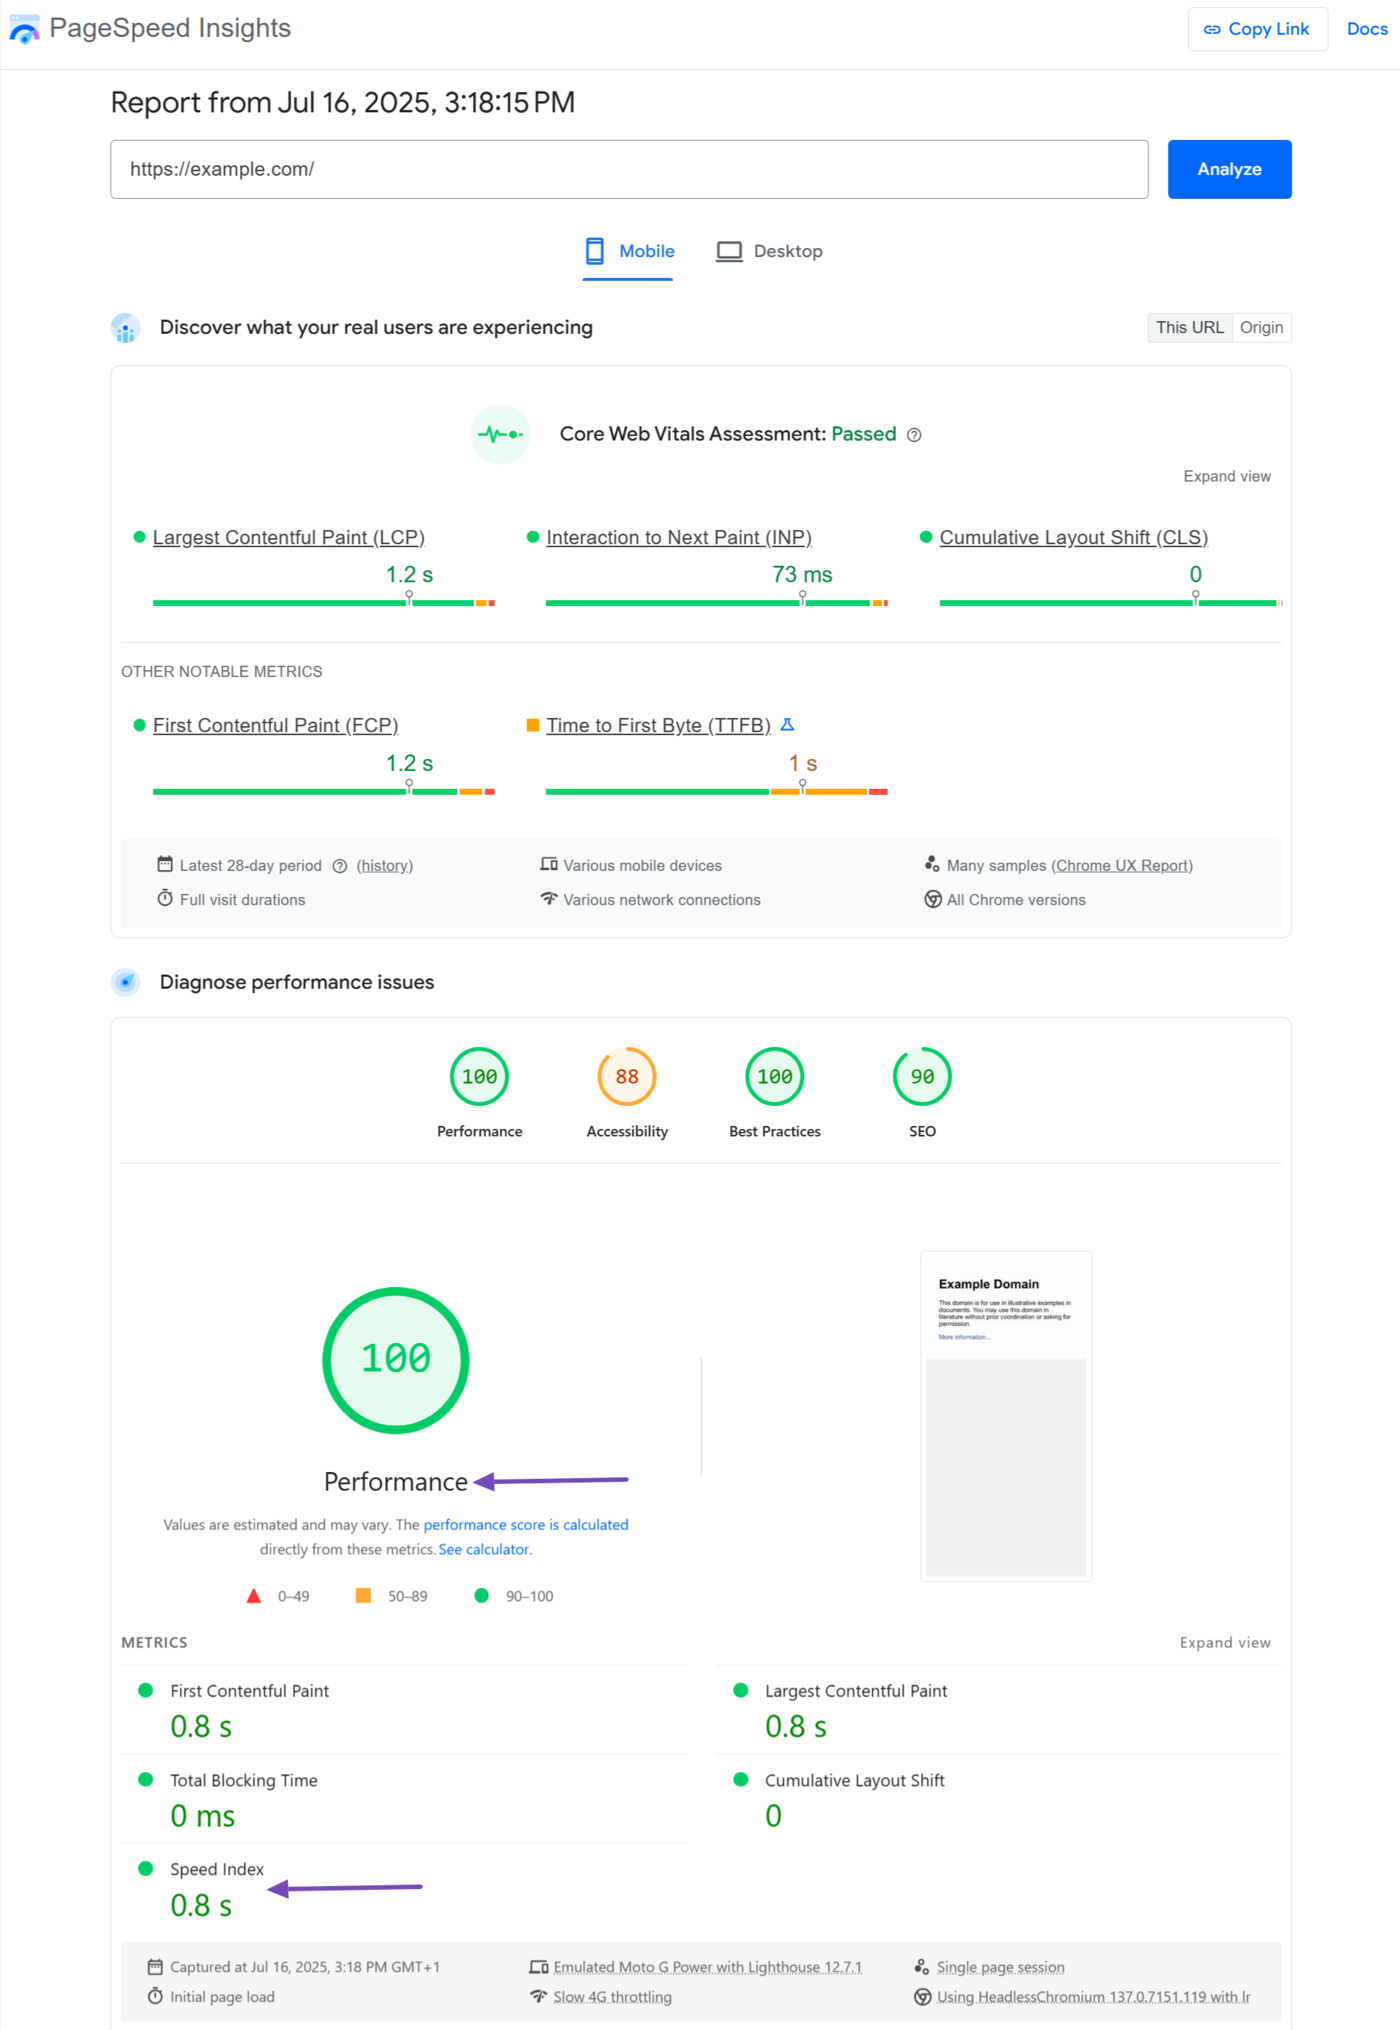
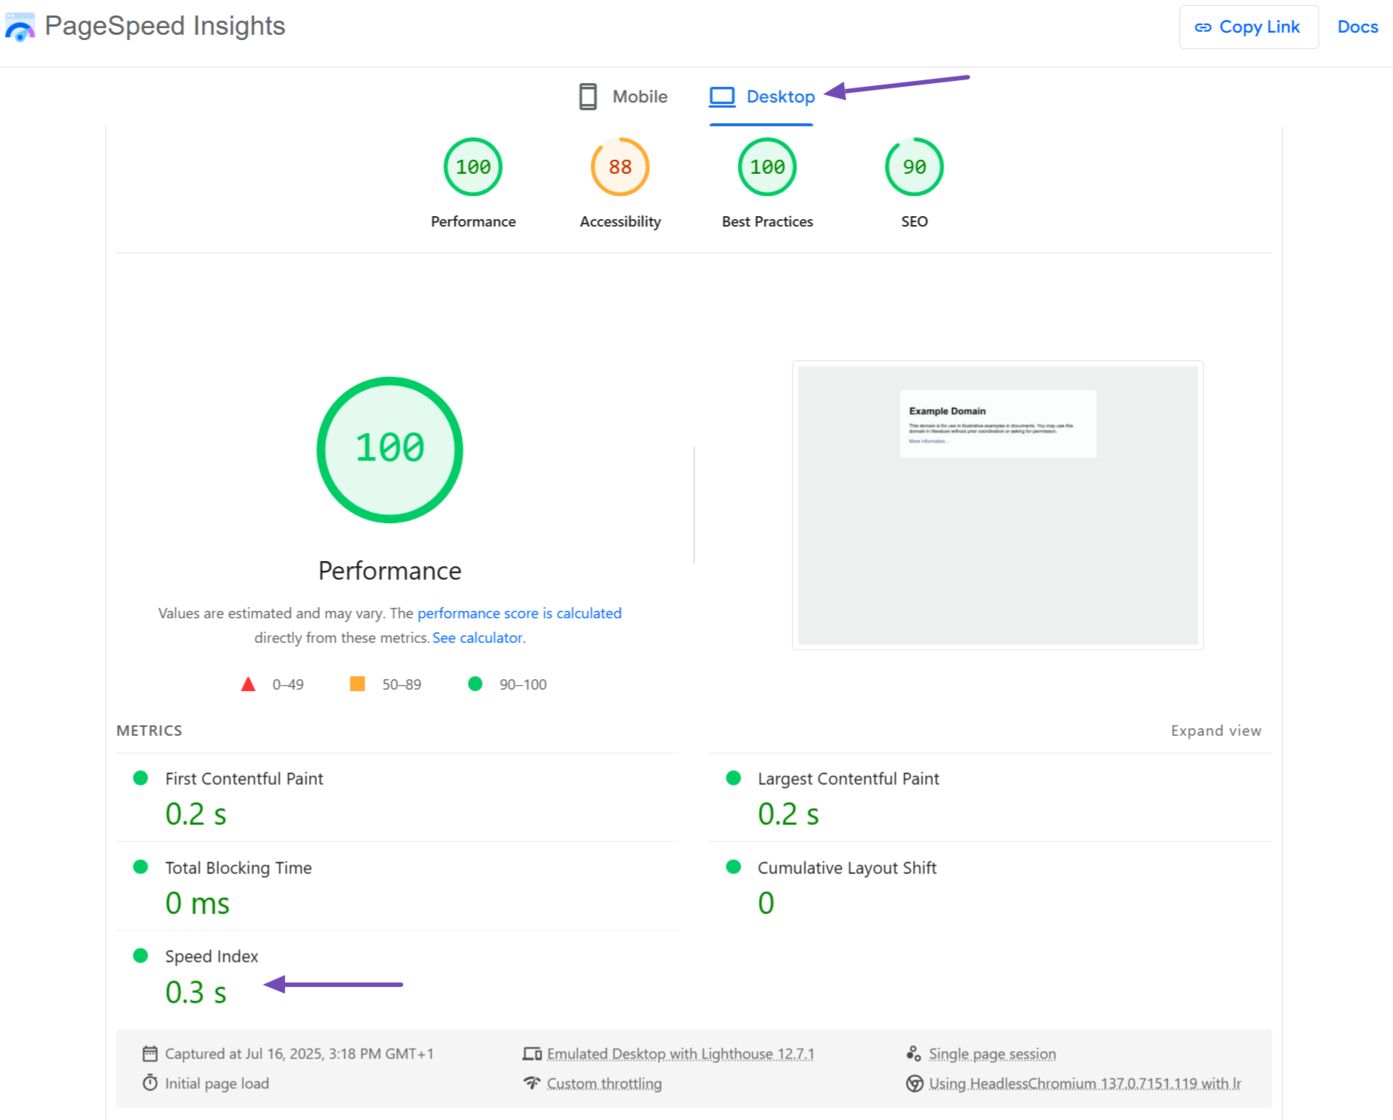
Ensuite, faites défiler l'écran jusqu'au champ Performance. Vous y trouverez l'indice de vitesse, comme indiqué ci-dessous. Notez que cet indice de vitesse concerne la version mobile de l'URL et qu'il est codé par couleur, en fonction du score :
- Vert : 0 - 3,4 secondes (Votre site est rapide)
- Orange : 3,4 - 5,8 secondes (votre vitesse est modérée)
- Rouge : 5,8 secondes et plus (Votre vitesse est faible et doit être améliorée)
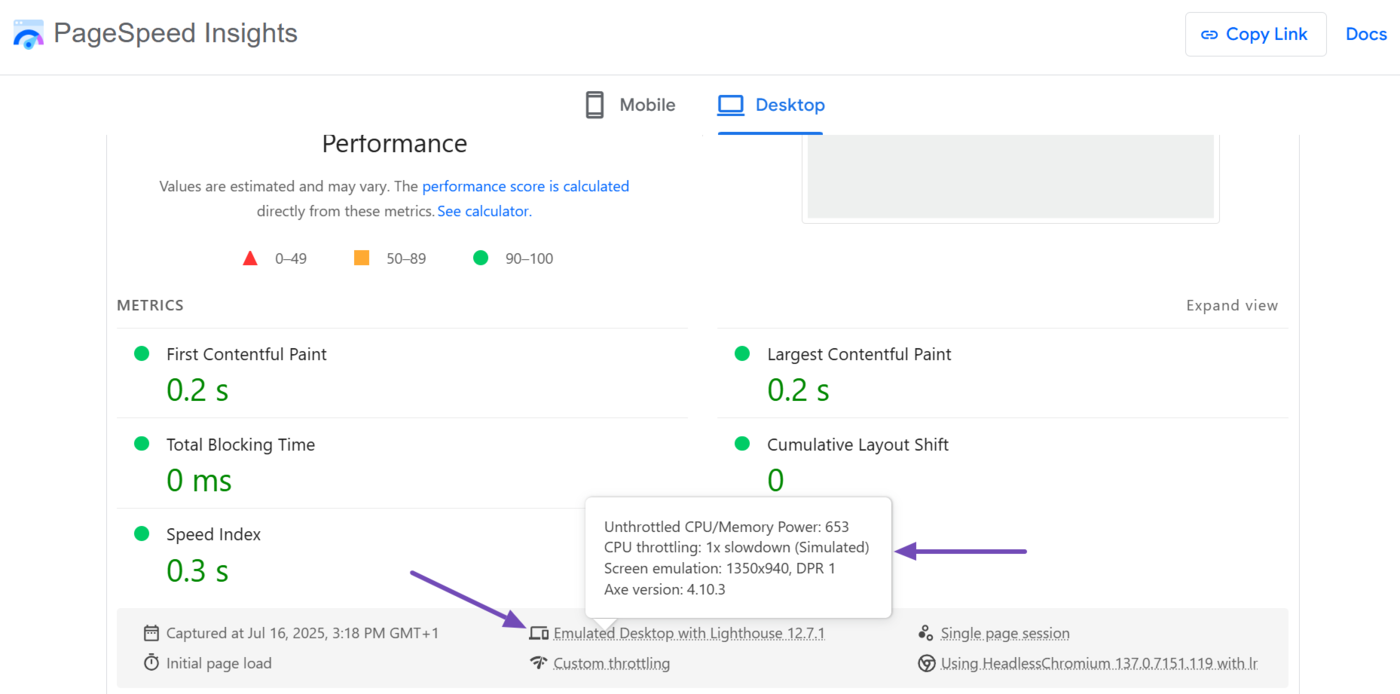
Vous pouvez cliquer sur Bureau pour vérifier l'indice de vitesse de la version de bureau de l'URL. Ce score est également codé par couleur :
- Vert : 0 - 1,3 secondes (votre site est rapide)
- Orange : 1,3 - 2,3 secondes (votre vitesse est modérée)
- Rouge : 2,3 secondes et plus (Votre vitesse est faible et doit être améliorée)
Notez que PageSpeed Insights rapporte l'indice de vitesse à l'aide de l'outil d'audit web Lighthouse. Lighthouse n'évalue pas l'indice de vitesse en temps réel. Il n'indique donc pas l'indice de vitesse pour les utilisateurs en temps réel.
En revanche, il évalue l'indice de vitesse à l'aide d'une simulation de chargement de page dans un environnement contrôlé. L'appareil et le système utilisés pour l'évaluation sont affichés sous l'indice de vitesse. Vous pouvez les survoler pour obtenir des informations supplémentaires.
Comment améliorer votre indice de vitesse
L'indice de vitesse est étroitement lié à d'autres paramètres de chargement des pages, tels que le premier tableau de contenu (FCP) et le plus grand tableau de contenu (LCP). Ces mesures ont un impact plus important sur l'expérience de la page et leur amélioration permet généralement d'améliorer l'indice de vitesse.
Il est donc préférable de se concentrer sur leur amélioration en même temps que sur d'autres mesures de vitesse de page et d'expérience plutôt que de se concentrer explicitement sur l'indice de vitesse lui-même.
1 Utiliser une police de secours
Examinez le champ Performance de l'outil PageSpeed Insights pour détecter le problème : "S'assurer que le texte reste visible pendant le chargement de la police". S'il existe, vous devez le résoudre en priorité.
Ce problème indique que votre page affiche un texte vide pendant le chargement des polices externes. Ce phénomène est connu sous le nom de "flash de texte invisible" (FOIT) et se produit lorsque vous ne spécifiez pas de police de secours pour la page à utiliser pendant le chargement de la police souhaitée.
Vous pouvez facilement remédier à ce problème en ajoutant font-display : swap ; à la police personnalisée @font-face dans votre code CSS. Cela permet au navigateur d'utiliser une police de remplacement jusqu'à ce que la police souhaitée soit chargée.
2 Optimisez votre code JavaScript
JavaScript peut bloquer votre fil d'exécution principal, ce qui peut empêcher le navigateur de rendre le contenu ou de répondre aux entrées de l'utilisateur, telles que les pressions sur l'écran, les clics de souris et les clics de clavier. Cela peut avoir un effet important sur votre première peinture de contenu, votre plus grande peinture de contenu et votre indice de vitesse.
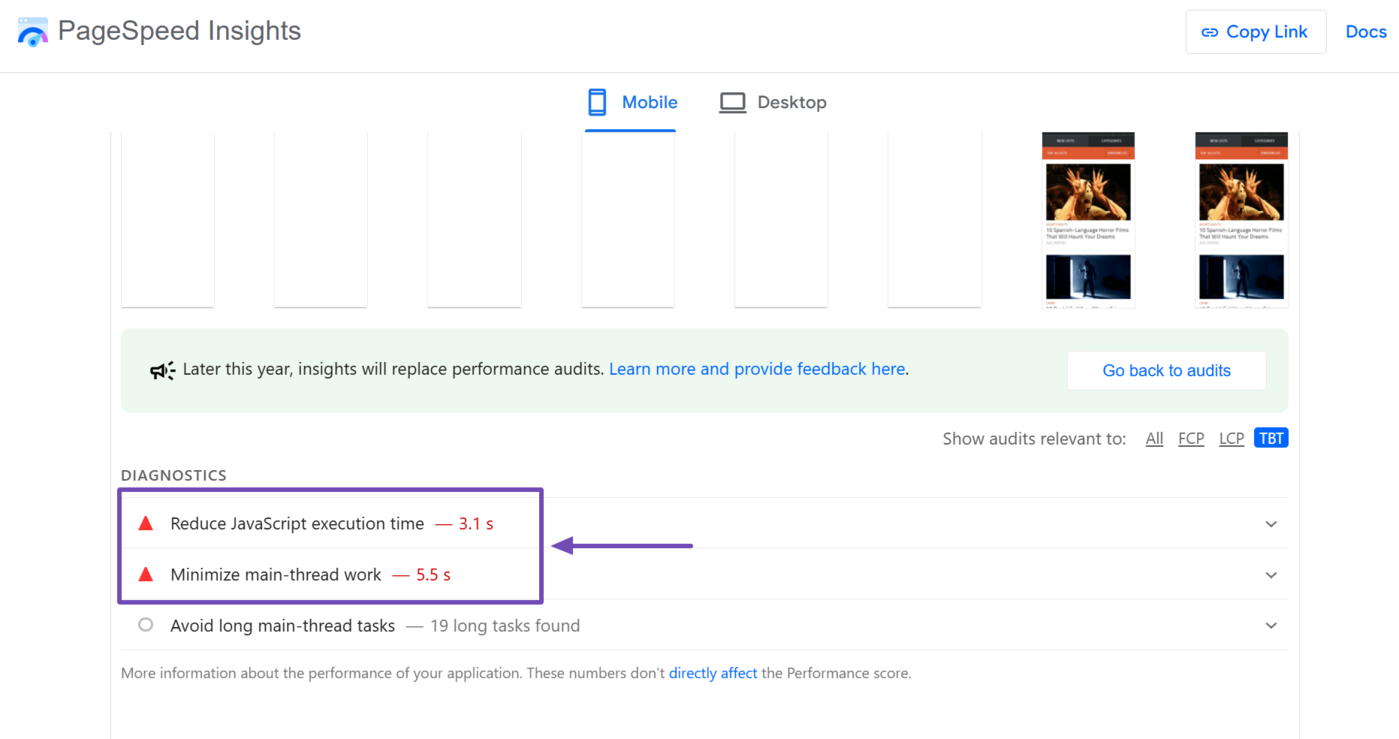
Pour commencer, examinez les informations et les diagnostics de l'outil PageSpeed Insights à la recherche des problèmes suivants et les corriger en priorité :
- Réduire le temps d'exécution de JavaScript
- Minimiser le travail du fil principal
Vous pouvez résoudre ces problèmes en optimisant votre code JavaScript :
- Supprimer le code JavaScript inutile
- Décomposer les gros fichiers JavaScript en fichiers plus petits
- Différer l'exécution du code JavaScript non critique
Il convient de différer la exécution de code JavaScript non critique à l'aide d'importations dynamiques import() ou le reporter ou asynchrone les attributs HTML. Cela retarde l'exécution du code à un stade ultérieur du processus de chargement de la page.
Dans l'ensemble, vous devez vous efforcer de conserver les tâches principales inférieur à 50 millisecondes dans la mesure du possible.
3 Améliorez votre premier et plus grand tableau de contenu
L'indice de vitesse est étroitement lié à d'autres paramètres de chargement des pages, tels que le premier tableau de contenu (FCP) et le plus grand tableau de contenu (LCP). Ces mesures ont un impact plus important sur l'expérience de la page et leur amélioration permet généralement d'améliorer l'indice de vitesse.
Pour commencer, revenez à la section Performance du rapport PageSpeed Insights. Vous y trouverez des actions à entreprendre pour améliorer les mesures de vitesse de votre page.
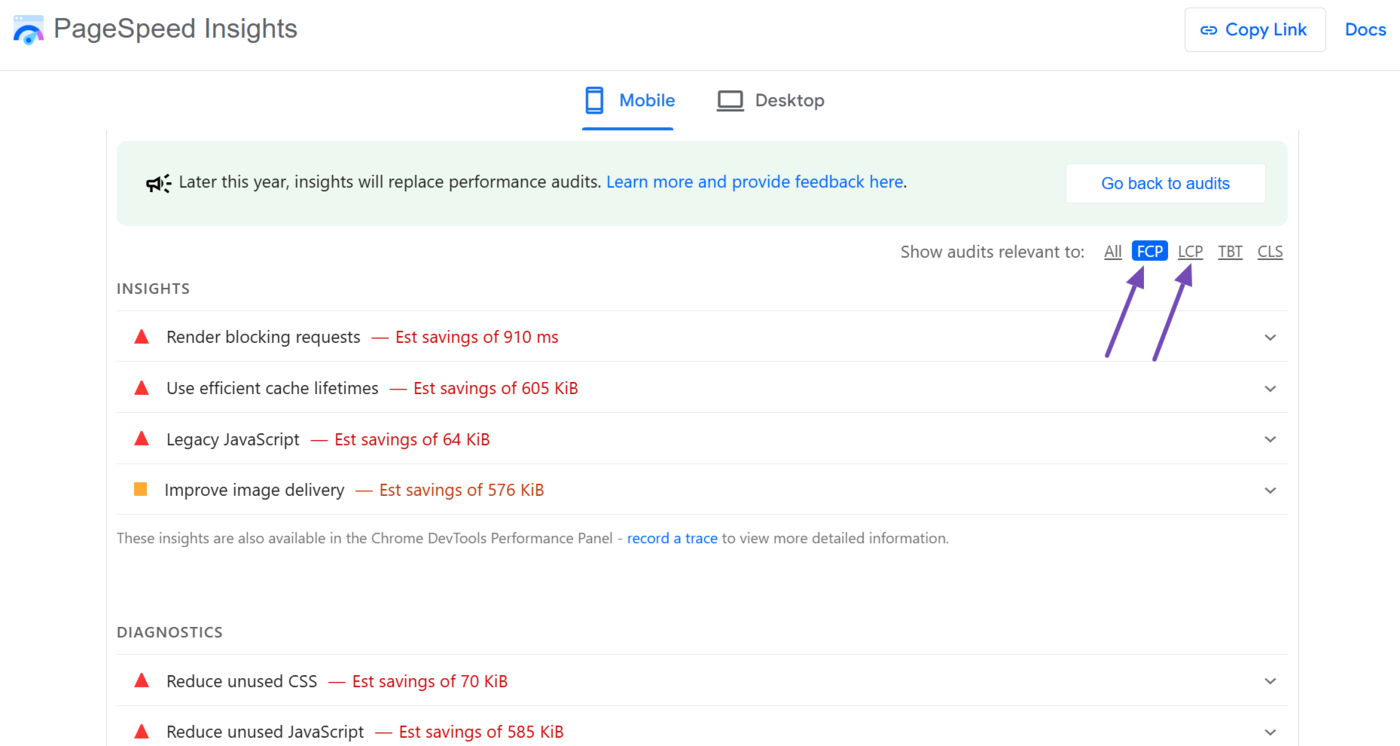
Ces actions sont répertoriées dans les champs "Insights" et "Diagnostic", parfois en même temps que le gain de temps potentiel.
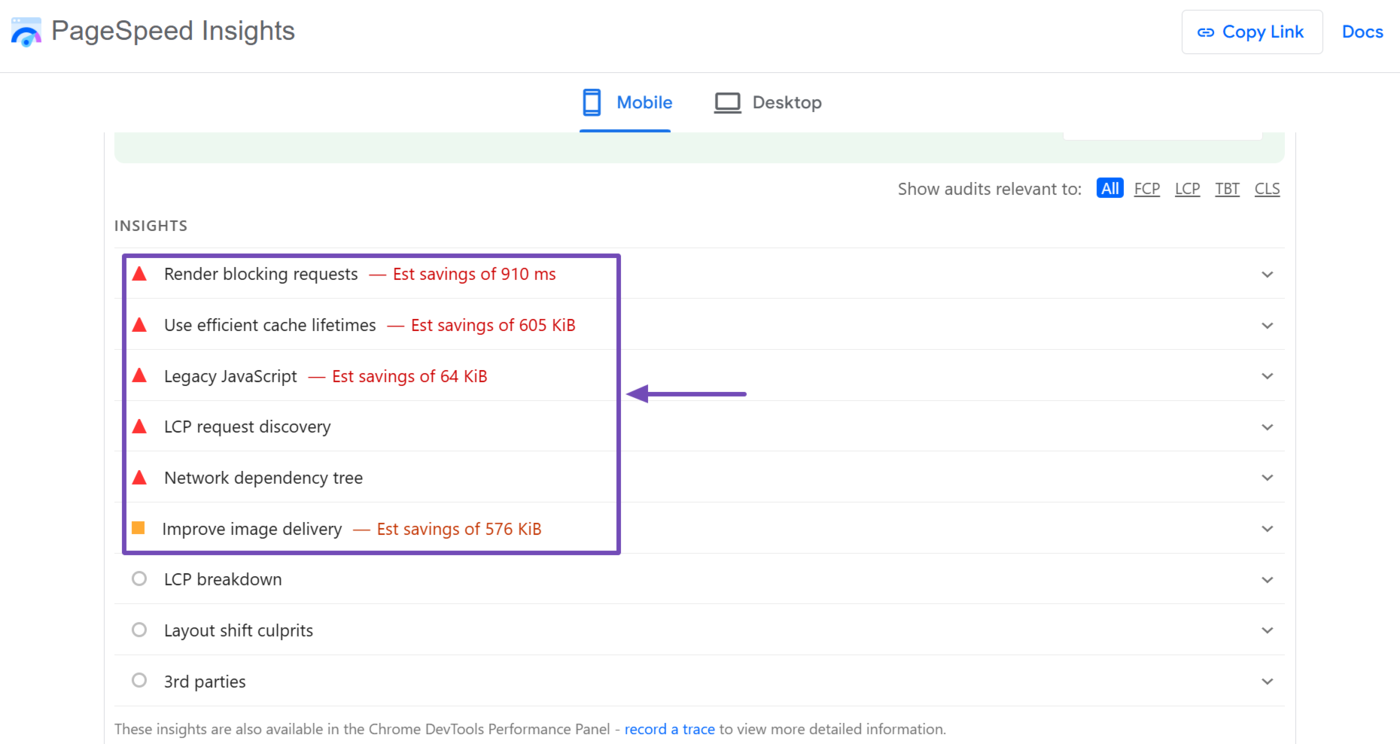
Cliquez sur PCF et LCP de se concentrer exclusivement sur les connaissances et les diagnostics exclusifs à la première peinture à contenu et à la plus grande peinture à contenu.
Veillez à passer en revue ces informations et diagnostics, en donnant la priorité à ceux qui permettent de gagner le plus de temps, car ils auront un impact plus important sur la vitesse de votre page.