What is Looker Studio?
Looker Studio, formerly Google Data Studio, is Google-owned data visualization software for converting data into easy-to-read reports, graphs, and dashboards.
 For example, suppose you run a business and want to compare how many sales you generate a month. It is as easy as connecting Looker Studio to the application you use for tracking sales. In return, Looker Studio will provide a dashboard showing your sales records. Then, you can proceed to compare your sales.
Looker Studio is owned by Google and is free to use. However, a paid version, Looker Studio Pro, has enhanced enterprise capabilities.
Overview of the Looker Studio
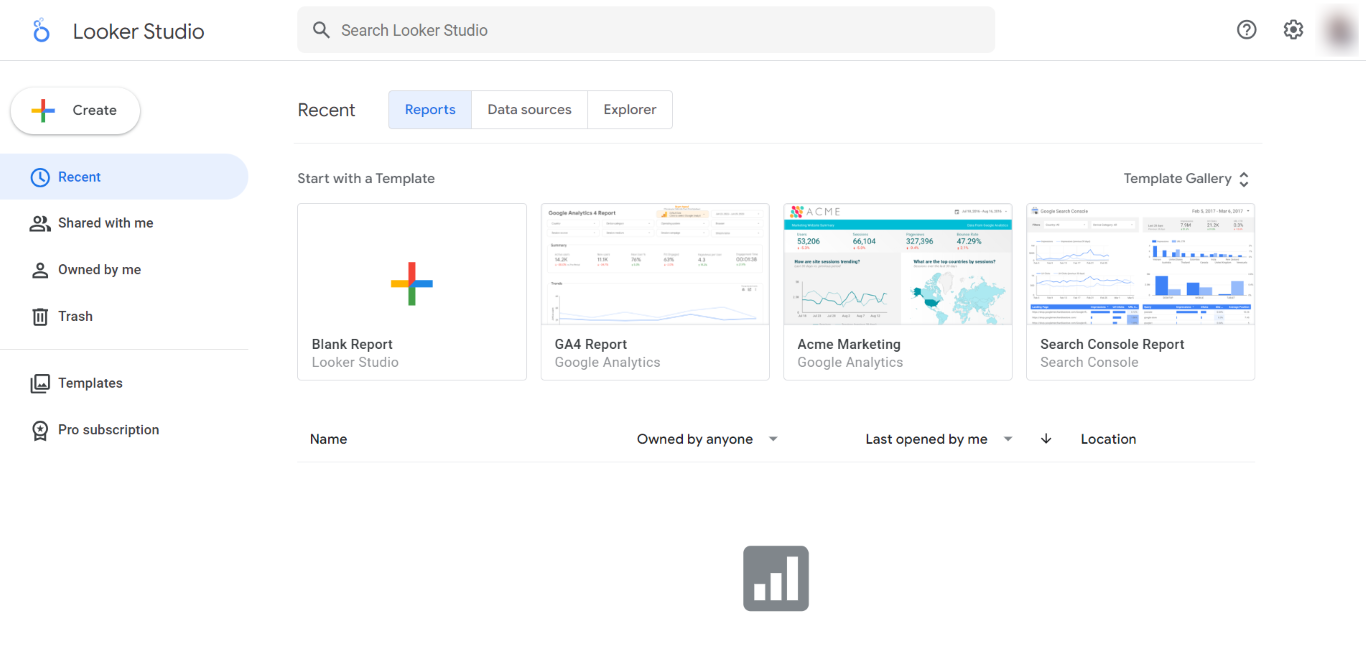
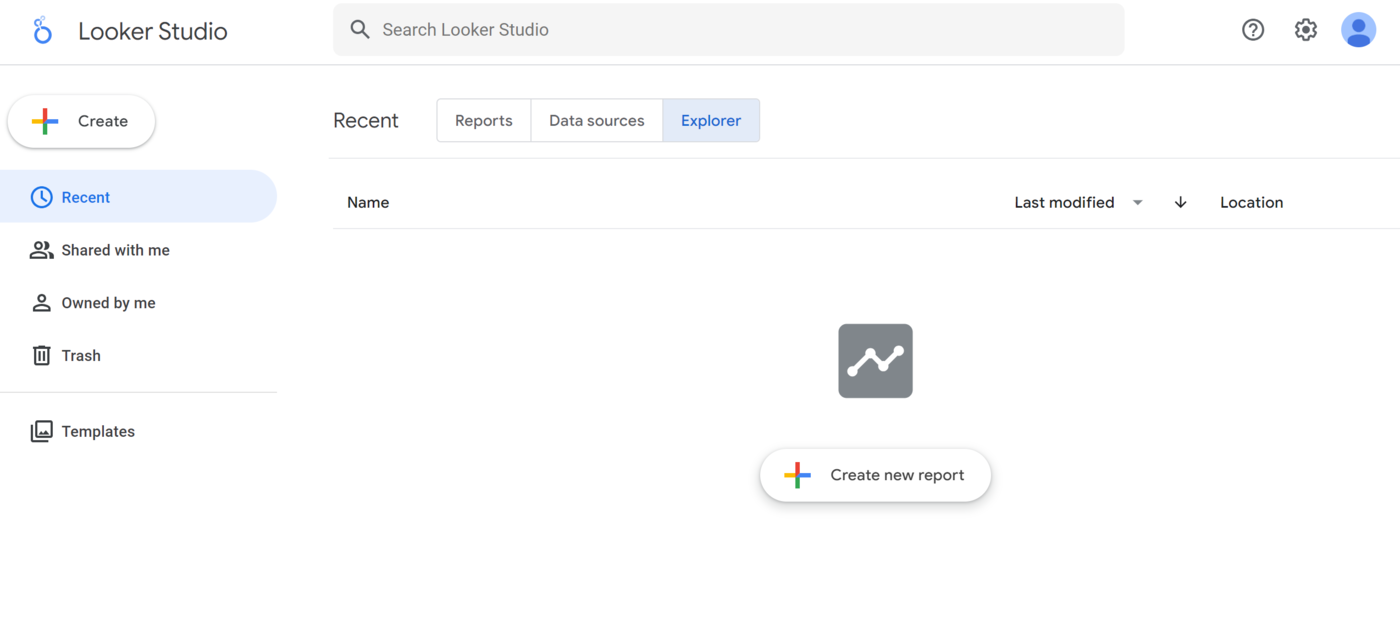
To get started with Looker Studio, head to the Google Looker Studio login page and log in using your Google account. Once done, Looker Studio presents you with a simple dashboard. At the top are three options: Reports, Data Sources, and Explorer.
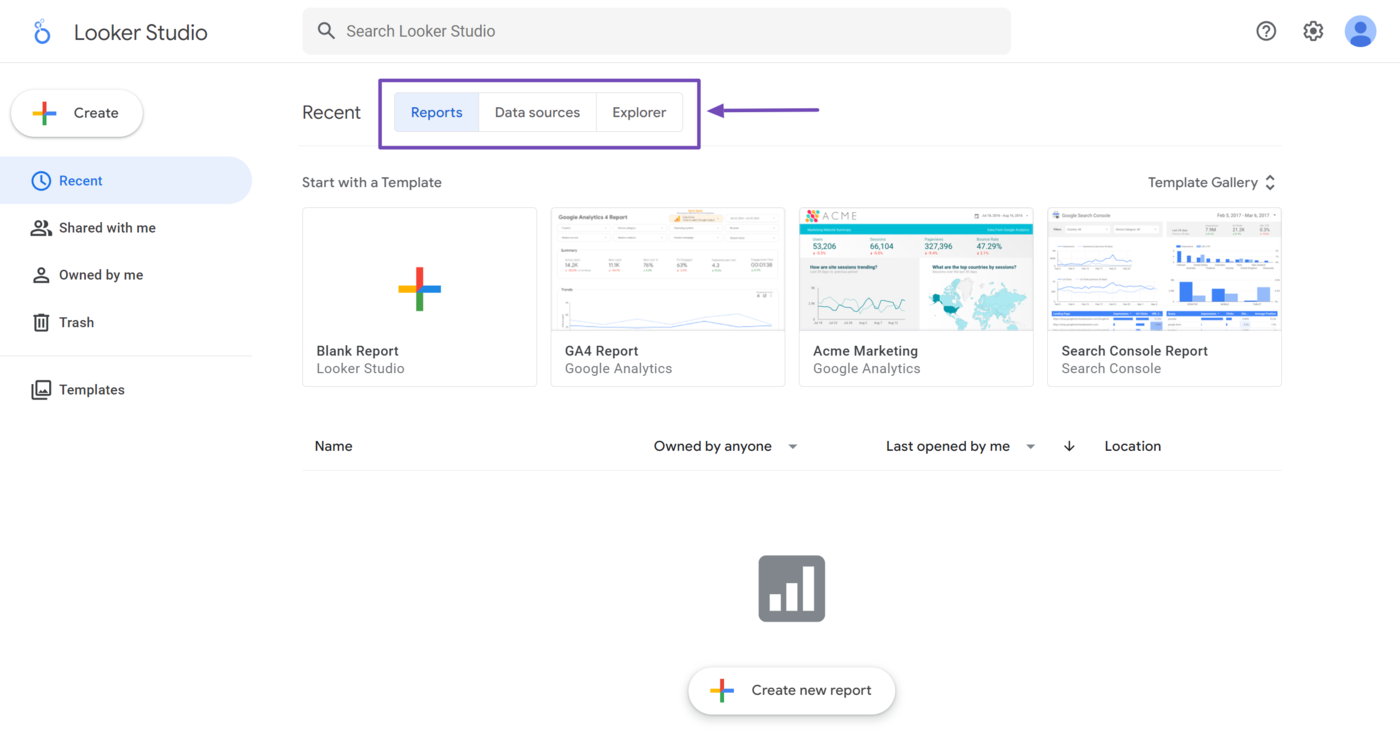
These options are crucial for creating and analyzing data using the Looker Studio. We will now provide an overview of those options below.
1 Reports
Looker Studio shows the Reports page by default. For a new user, this page will be pretty blank. However, if you have previously created some reports, they will be displayed here, as shown below.
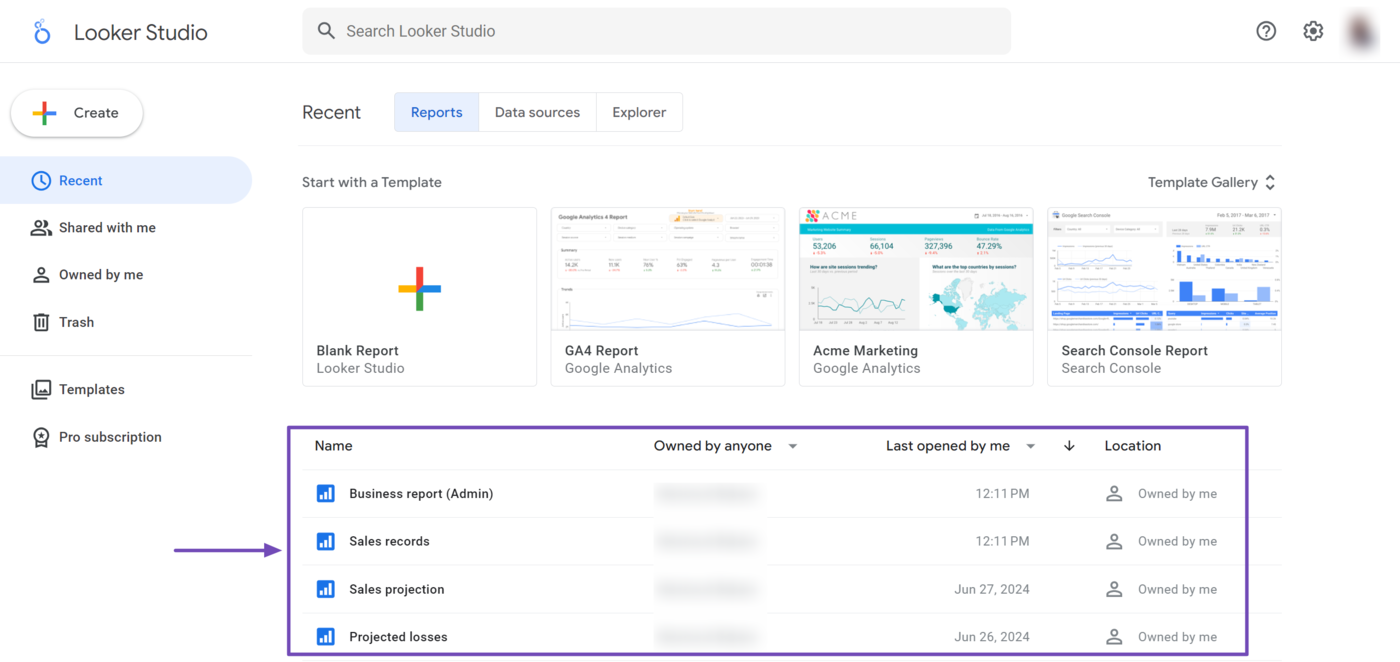
The Reports page is where Google Looker users transform raw data into organized and presentable formats. Here, you can create customized reports by selecting specific data fields, applying filters, and defining the desired visualizations.
The Reports page provides comprehensive insights into your data, making it easier to analyze trends, identify patterns, and communicate findings effectively.
2 Data Sources
The Data sources page allows you to select the data you want to analyze in Looker Studio. If you have previously connected to some data sources, they will be displayed on the page.
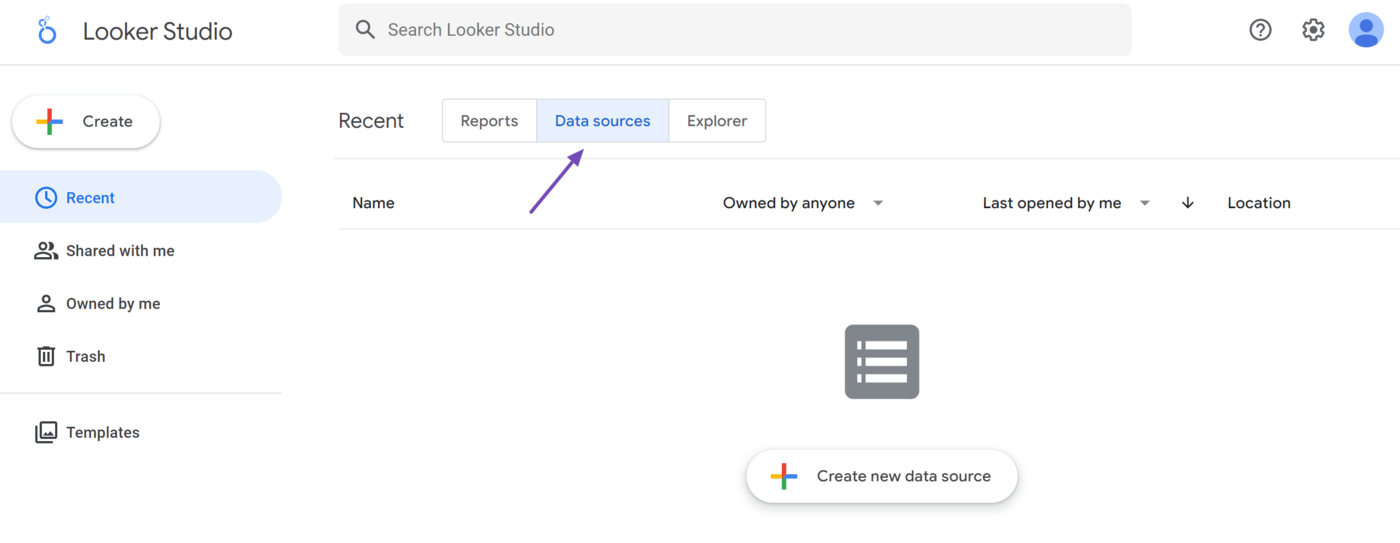
The Data Sources page allows you to access supported databases, spreadsheets, and cloud storage containing your data. This allows users to access and query data from different sources simultaneously, making the data analysis and decision-making process smoother.
3 Explorer
The Explorer page provides an intuitive and user-friendly interface for exploring and manipulating data.
The Explorer page allows users to drill down into specific dimensions and metrics, apply filters, and visualize the data in real time. This helps to uncover insights and understand the underlying trends and correlations.
How to Create a Report in the Looker Studio
There are multiple methods of creating reports in the Looker Studio. However, to avoid getting overwhelmed, a first-time user should follow the two-step process below.
- Select a template
- Link the template to a data source
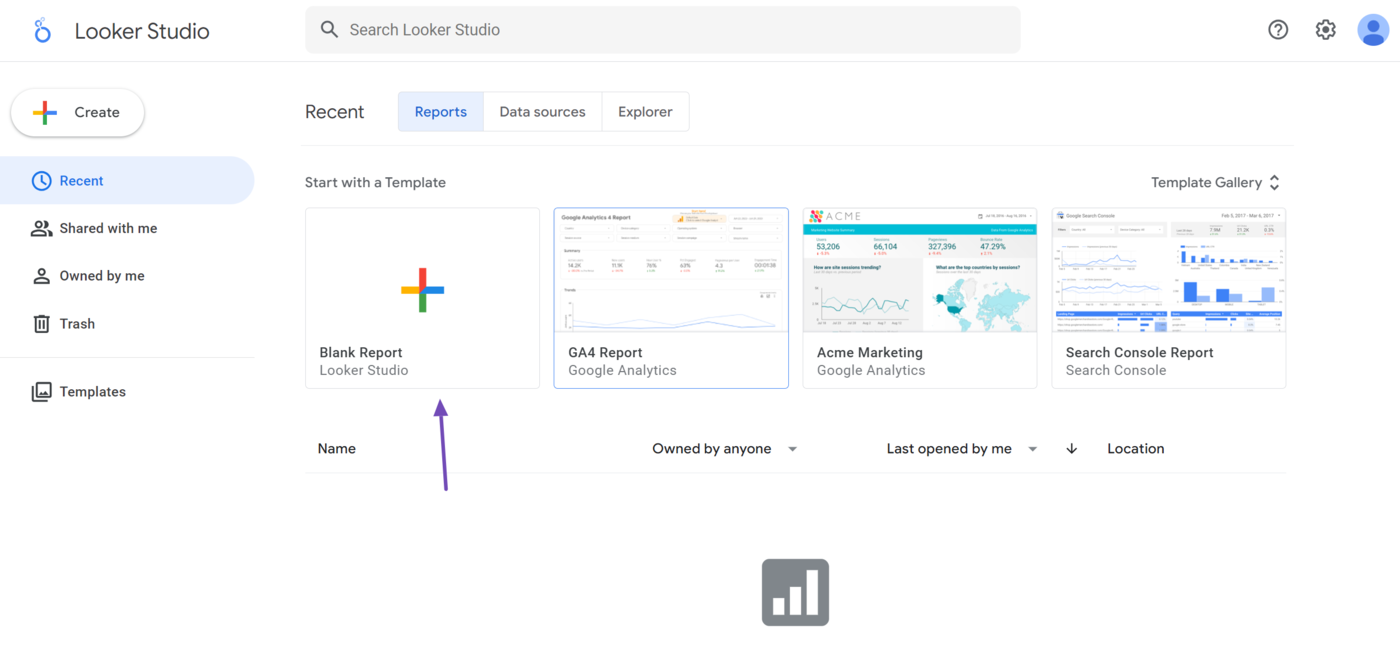
1 Select a Template
The first step is to select a template. You can create your own template or select from one of the premade templates already available in Looker Studio.
However, it is recommended that you select a template unless you already have experience creating data reports using Looker Studio or similar software.
That said, to create a template, select Blank Reports, as shown below.
Optionally, click Template Gallery to select from any of the premade templates.
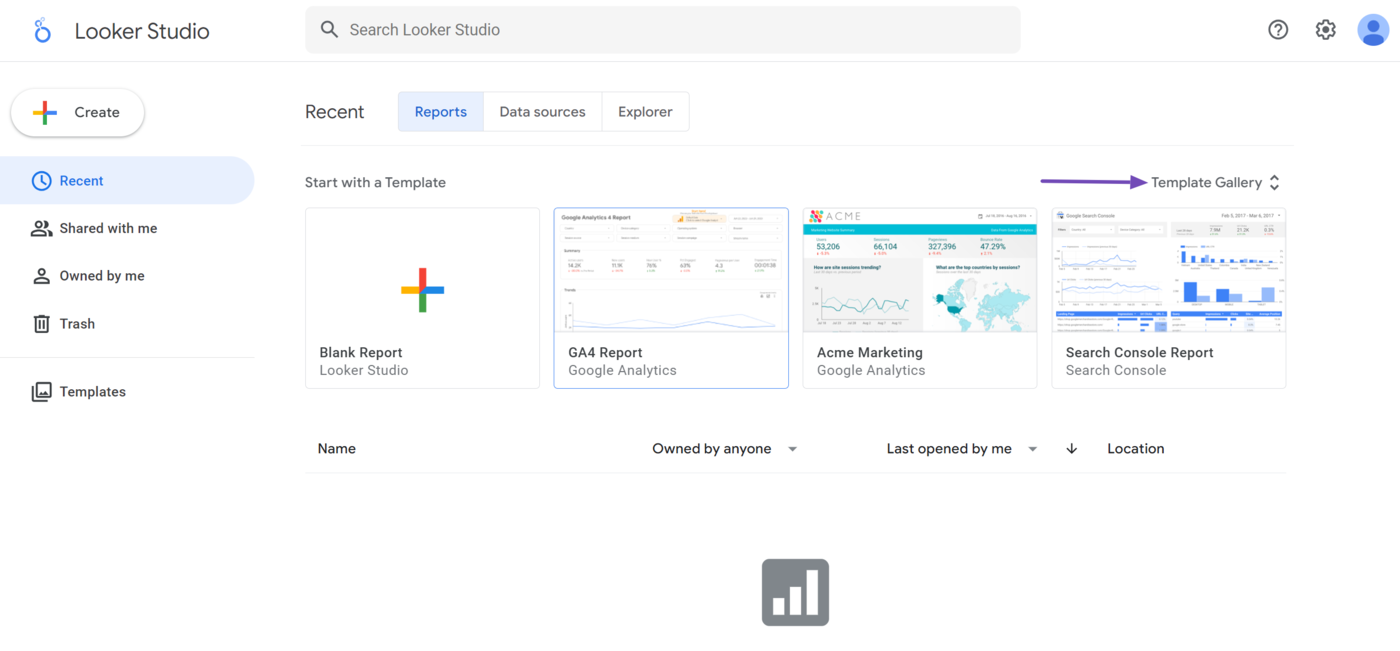
You will observe that the templates in the gallery have been separated into categories depending on the application they are intended to be used with.
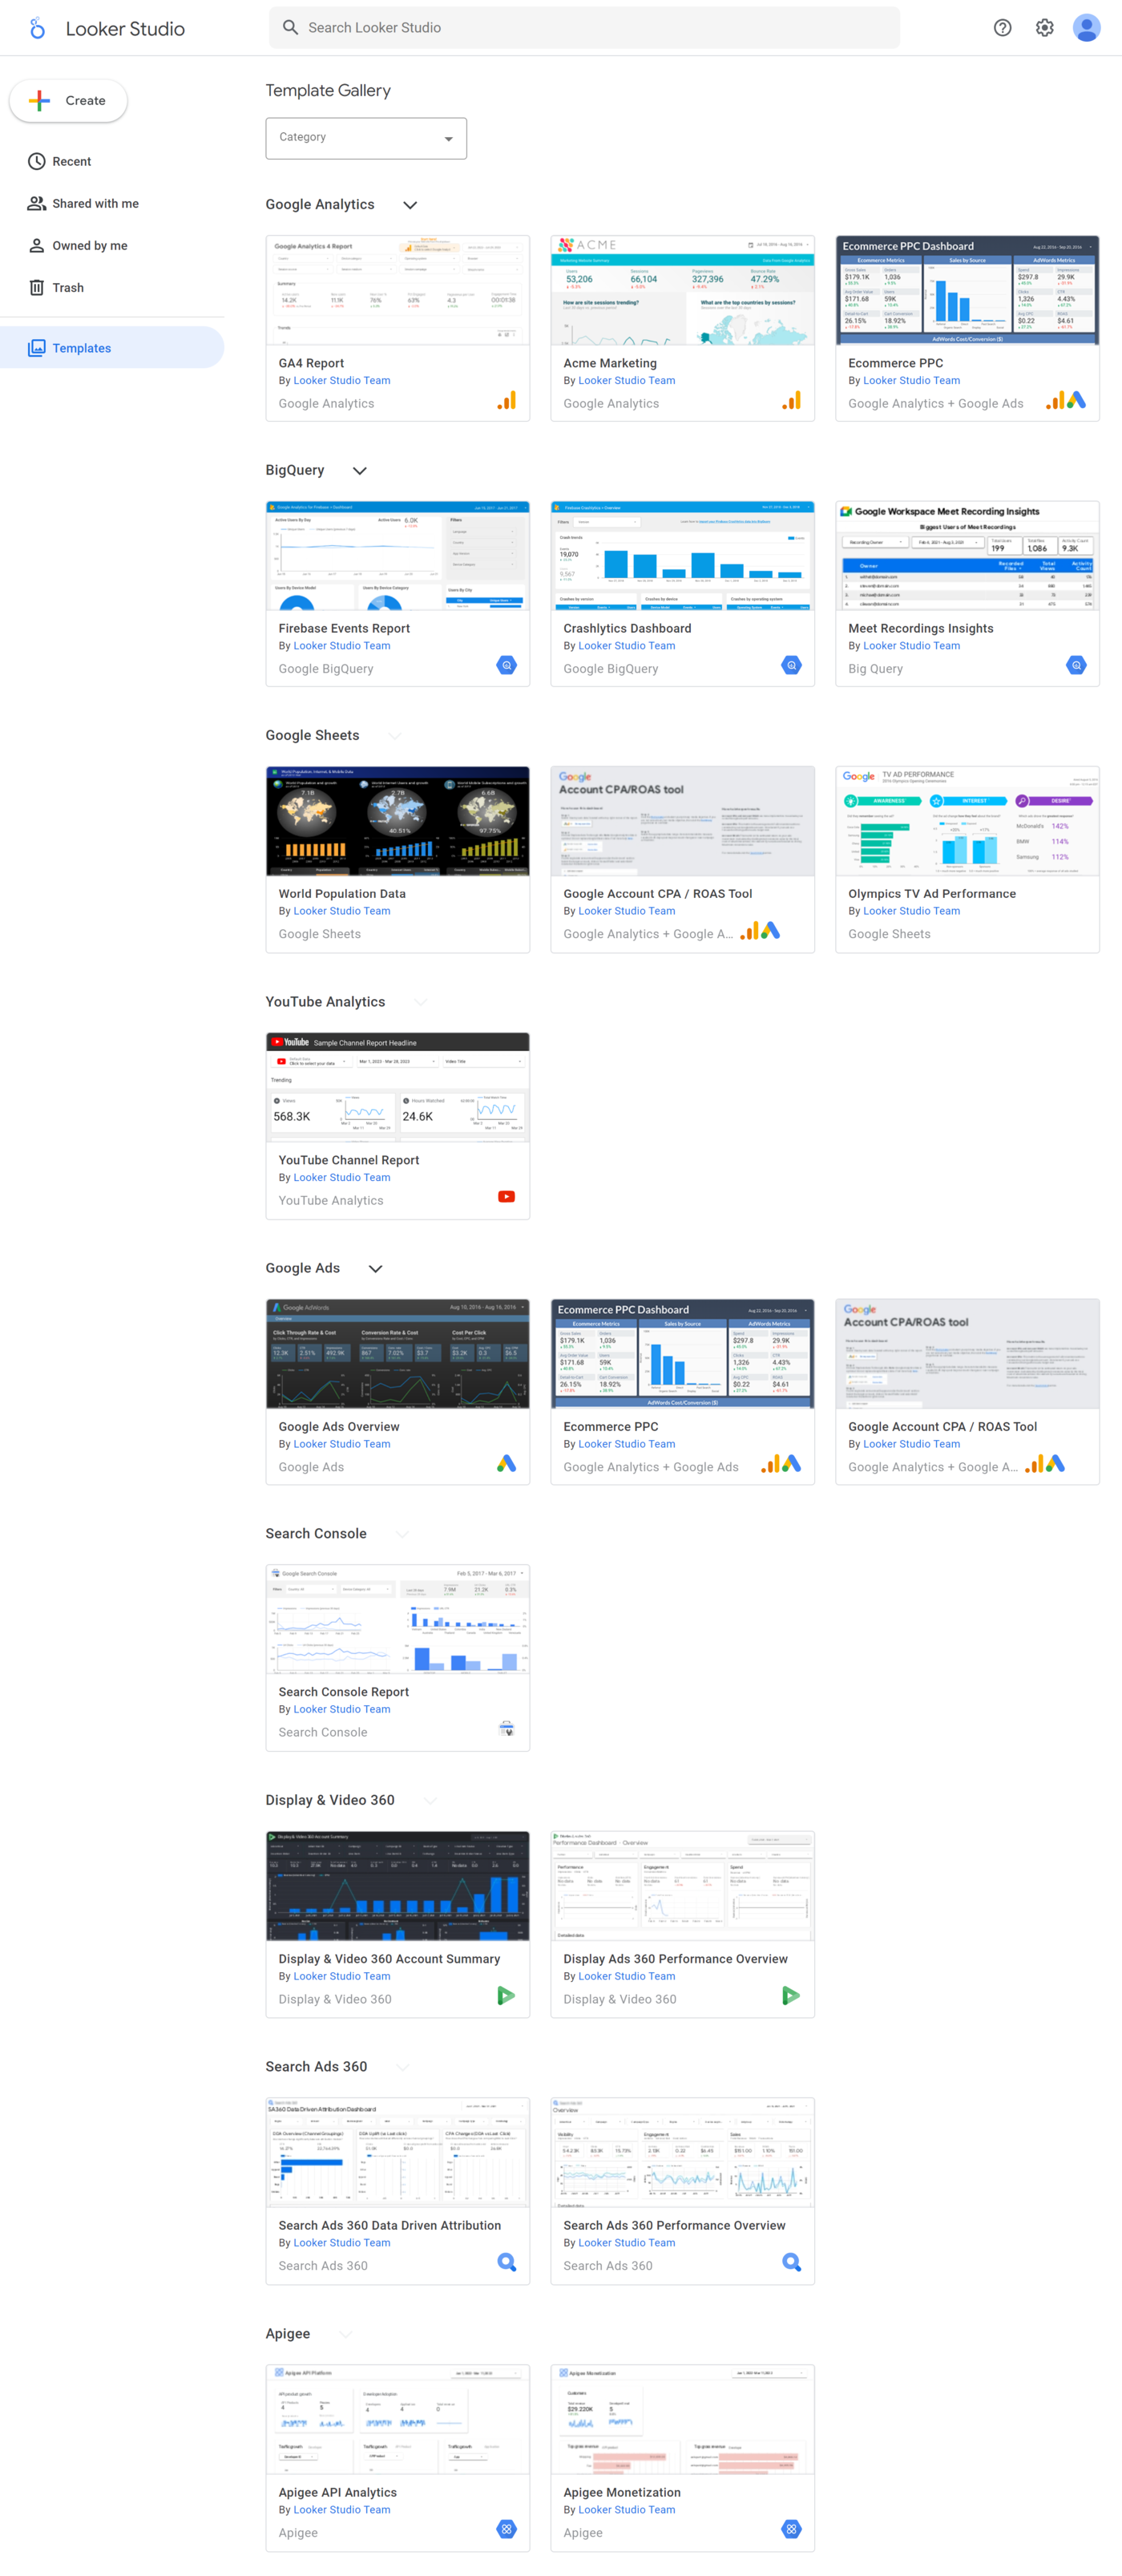
In this case, navigate to the section of the application you want to connect to and select from the available templates. Once you have done so, connect your data to the template.
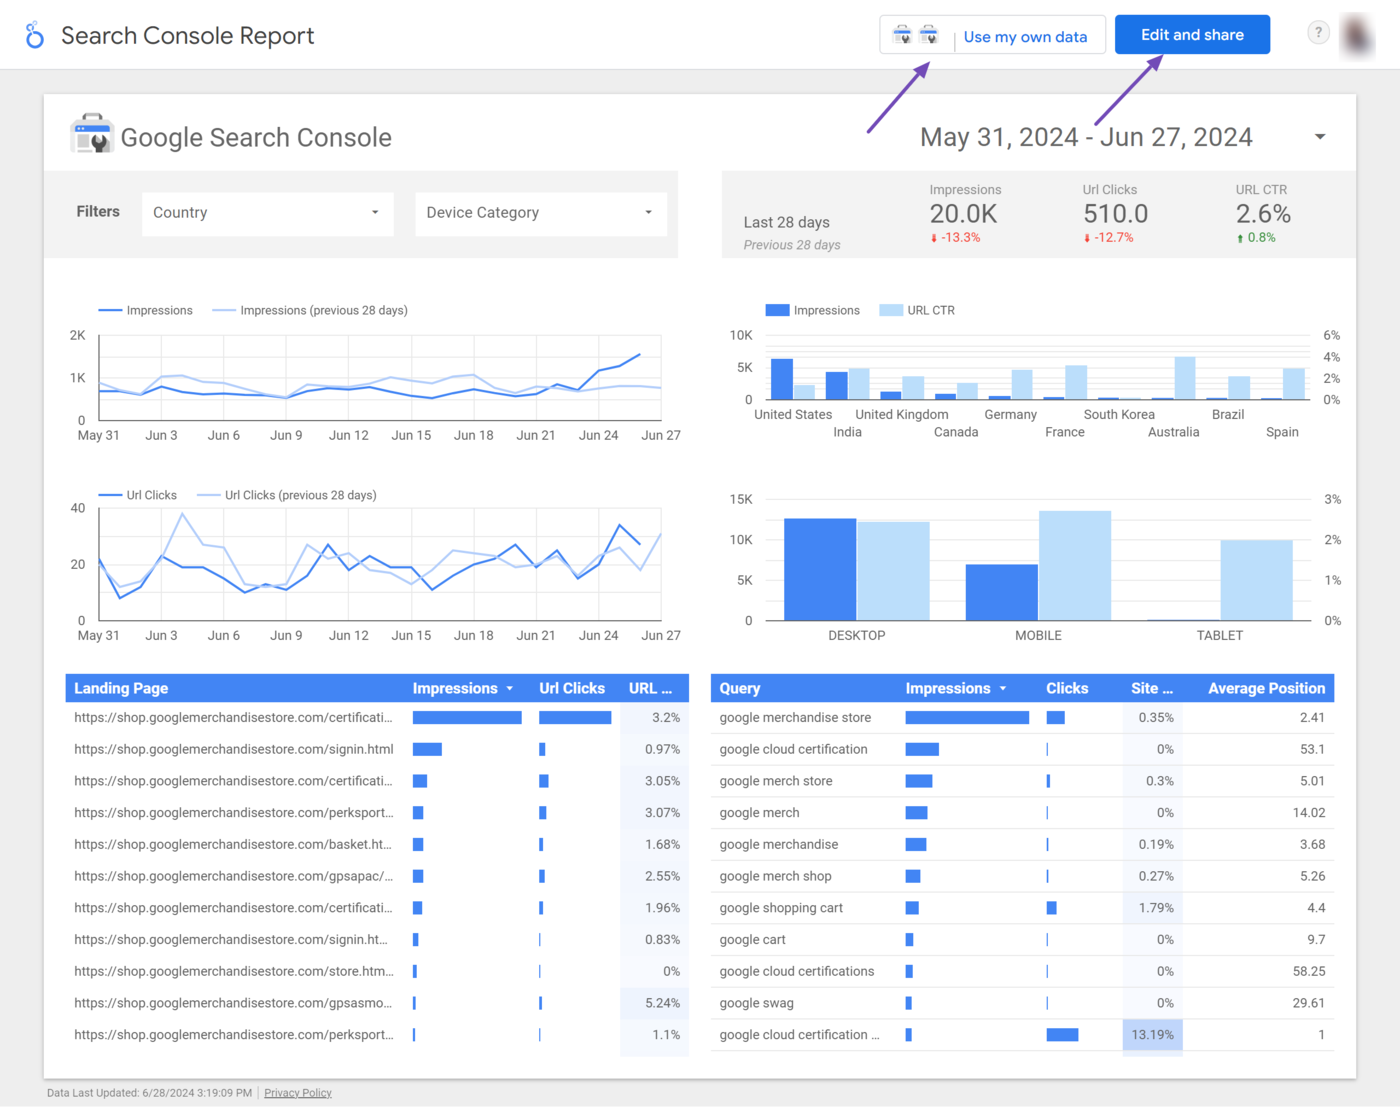
After connecting your data to the template, you will be presented with two options: Use my own data o Edit and Condividere.
- Use my own data – Replace the sample data displayed with your own data
- Edit and share – Customize the dashboard so you can add your data sources later
2 Link the Template to a Data Source
The next step is to link your template to a data source.
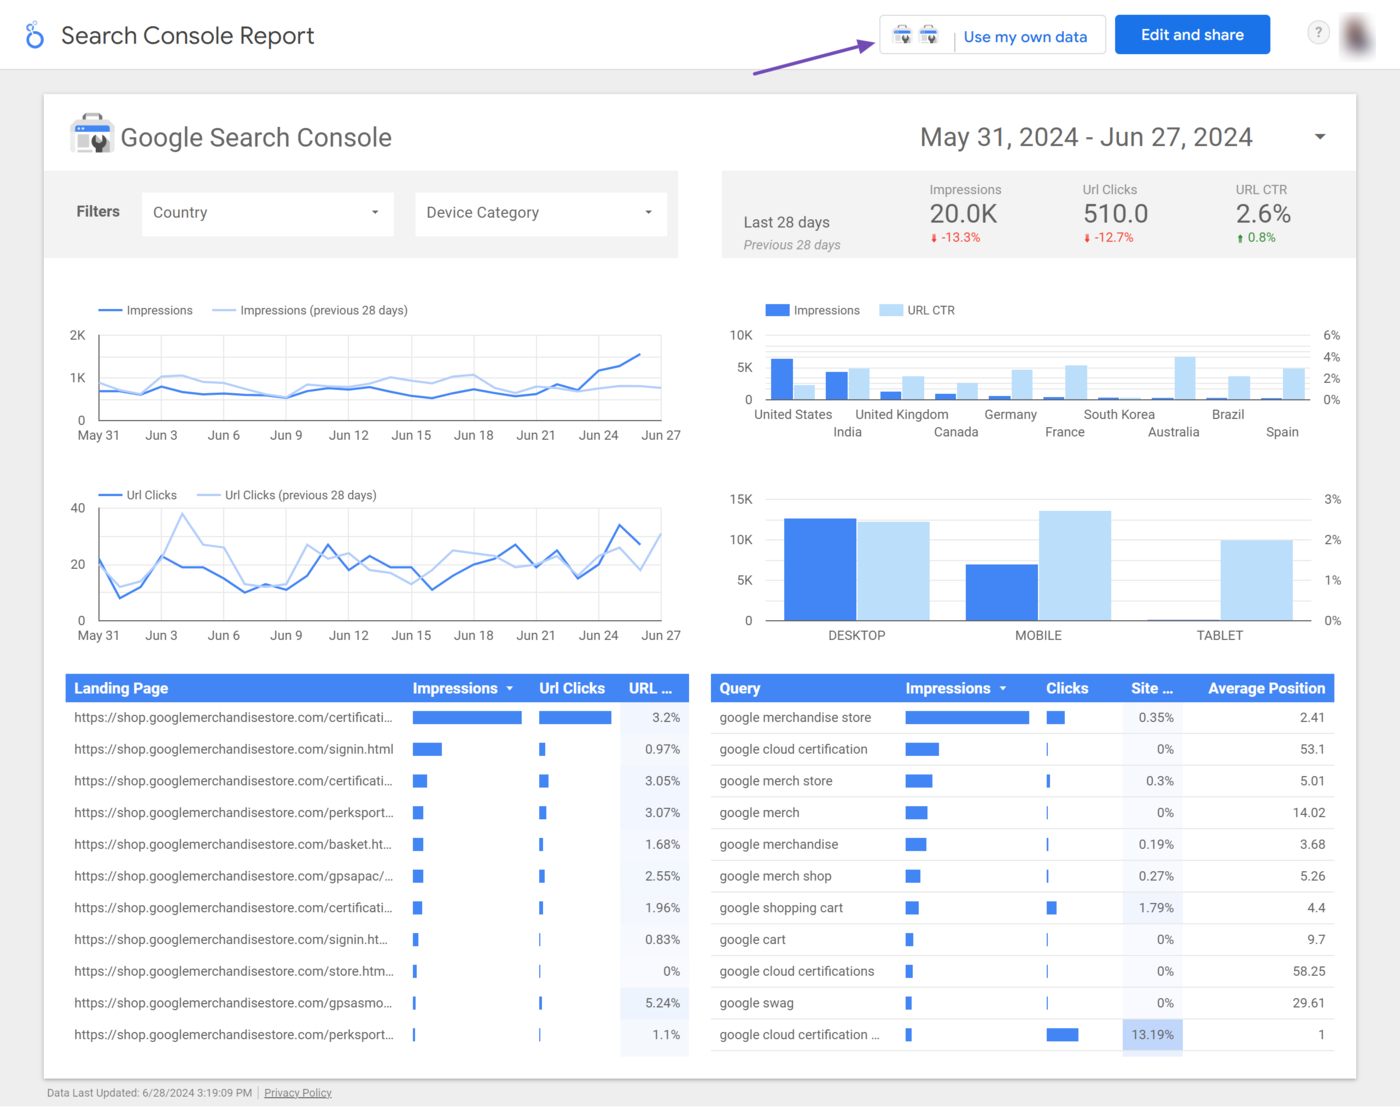
If you selected a premade template, click Use my own data to connect to the service or program of the template you selected.
If you selected Blank Reports, you will link Looker Studio to a connector. Connectors are tools that allow Looker Studio to connect to other apps and databases.
In this case, the connectors are already available on the template screen. So, scroll down to select the appropriate connector.
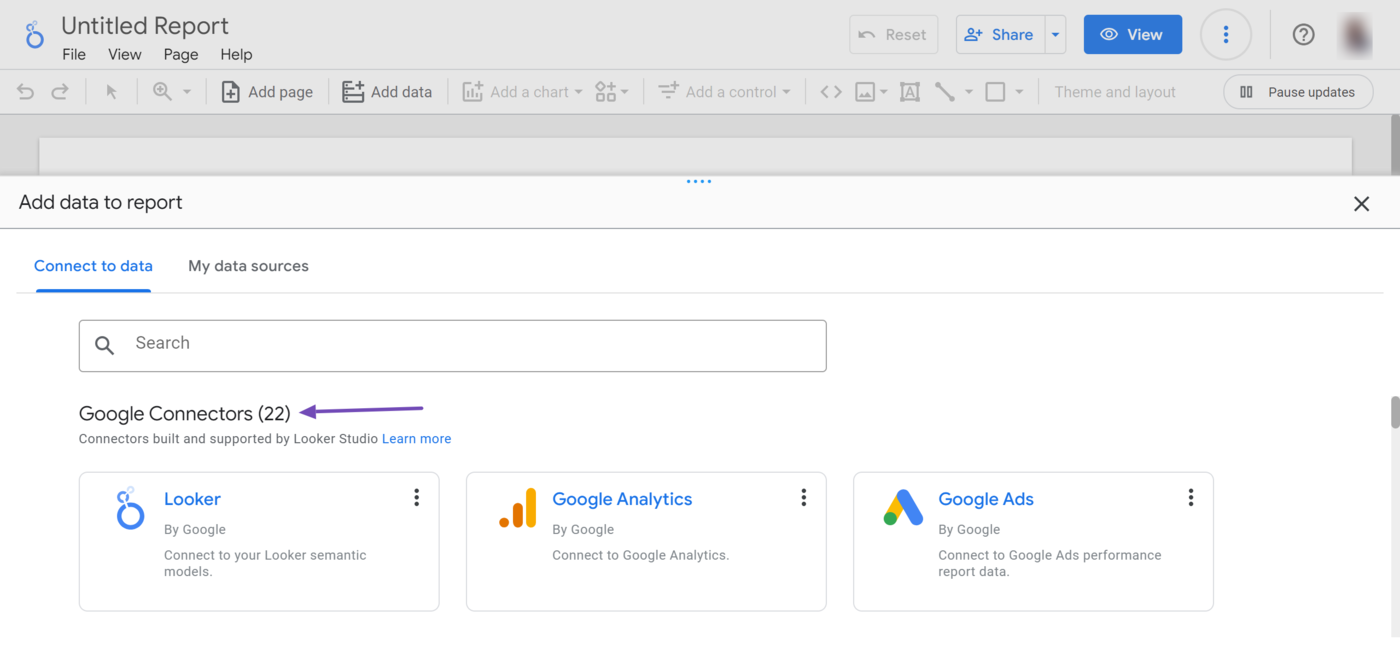
The templates are split into Google connectors and partner connectors.
- Google connectors – These allow you to connect to Google’s app and services or upload data from your device
- Partner connectors – These allow you to connect to data from third-party apps and services or your own custom connector
Once done, you can now proceed to modify your data to suit your intent. However, it is always a great idea to only display the essential metrics. Data can quickly become overwhelming and confusing to a viewer, so you should only show data that matters.