What Are Core Web Vitals?
Core Web Vitals are a set of metrics that Google uses to determine how user-friendly a webpage is. Specifically, the metrics allow Google to determine the responsiveness, page speed, and visual stability of a webpage.
Google measures three metrics as part of the Kern-Web-Vitals. They include:
- Größte zufriedene Farbe (LCP) — load speed
- Kumulative Layoutverschiebung (CLS) — visual stability
- Interaktion mit Next Paint (INP) — responsiveness
Google used to measure the Erste Eingangsverzögerung (FID) as part of the Core Web Vitals. However, the First Input Delay ceased to be a Core Web Vitals metric when it was replaced by the Interaction to Next Paint (INP) in March 2024.
Several tools that report on the Core Web Vitals sometimes include some other metrics as part of the report. These supporting metrics are not included in the Core Web Vitals because they are not user-centric or cannot be measured in real-time. They include:
- Zeit bis zum ersten Byte (TTFB) — load speed
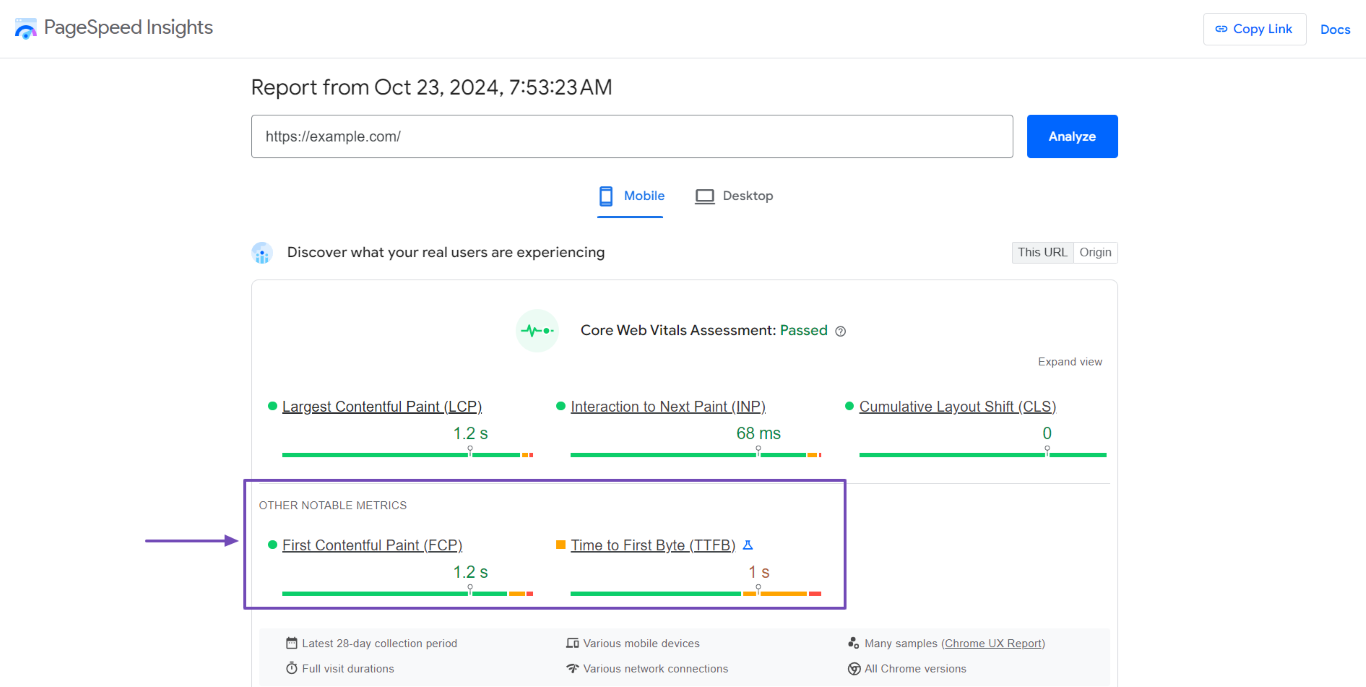
- Erste Contentful Paint (FCP) — load speed
- Total Blocking Time (TBT) — responsiveness
These supporting metrics can provide additional information and help diagnose issues affecting the Core Web Vitals metrics. For example, the Time to First Byte (TTFB) and First Contentful Paint (FCP) help diagnose problems with the Largest Contentful Paint.
Similarly, the Total Blocking Time (TBT) is helpful for diagnosing responsiveness issues affecting the Interaction to Next Paint (INP).
That said, the Core Web Vitals is not a ranking factor. Instead, it is part of the signals and metrics that Google uses to determine the page experience of a webpage. The page experience is a ranking factor and includes other metrics and signals, such as the site’s mobile-friendliness und HTTPS usage.
The Core Web Vitals Metrics
Google measures three metrics as part of the Core Web Vitals. Together, these metrics allow Google to measure the Benutzererfahrung of the webpage. We will briefly address these metrics below.
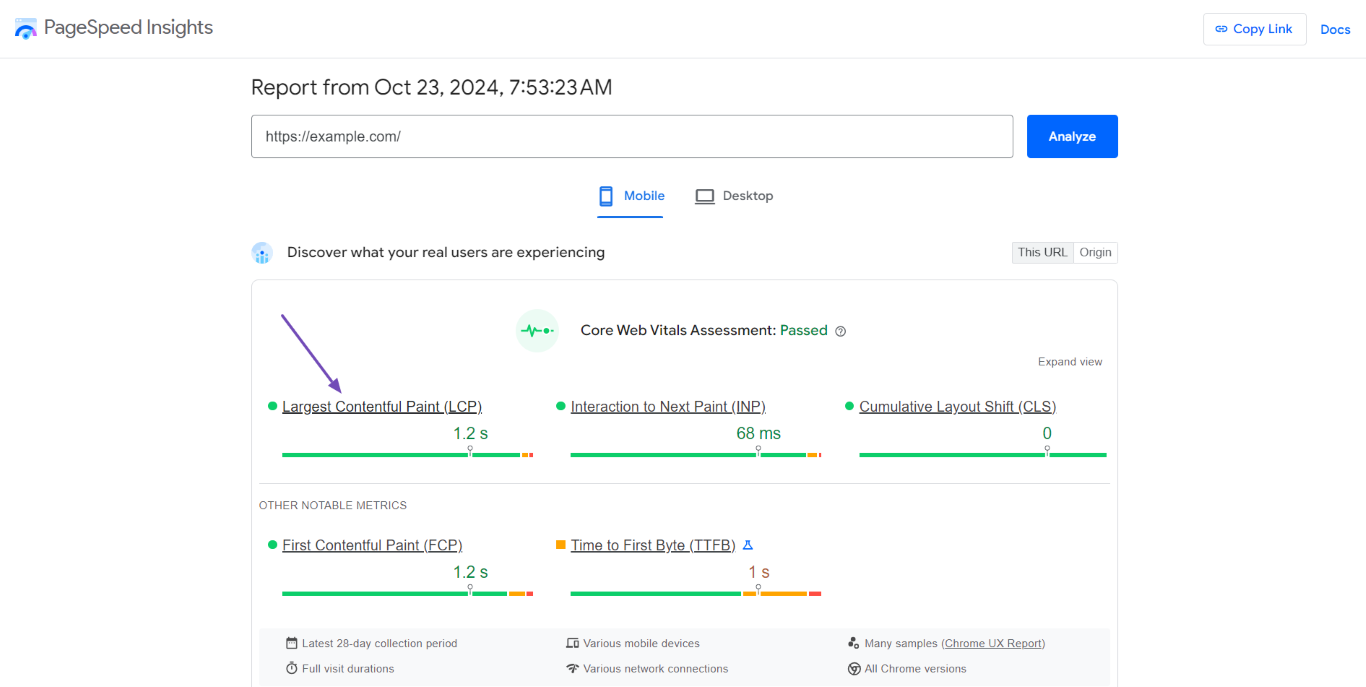
1 Größte zufriedene Farbe (LCP)
The Largest Contentful Paint (LCP) measures how quickly the page loads. It measures the duration between when the webpage begins loading and when the largest image or paragraph visible within the viewport is loaded. Core Web Vitals report tools categorize the largest contentful paint into good, needs improvement, or poor.
- Good — 2.5 seconds or less
- Needs Improvement — Over 2.5 seconds but less than 4.0 seconds
- Poor — Above 4.0 seconds
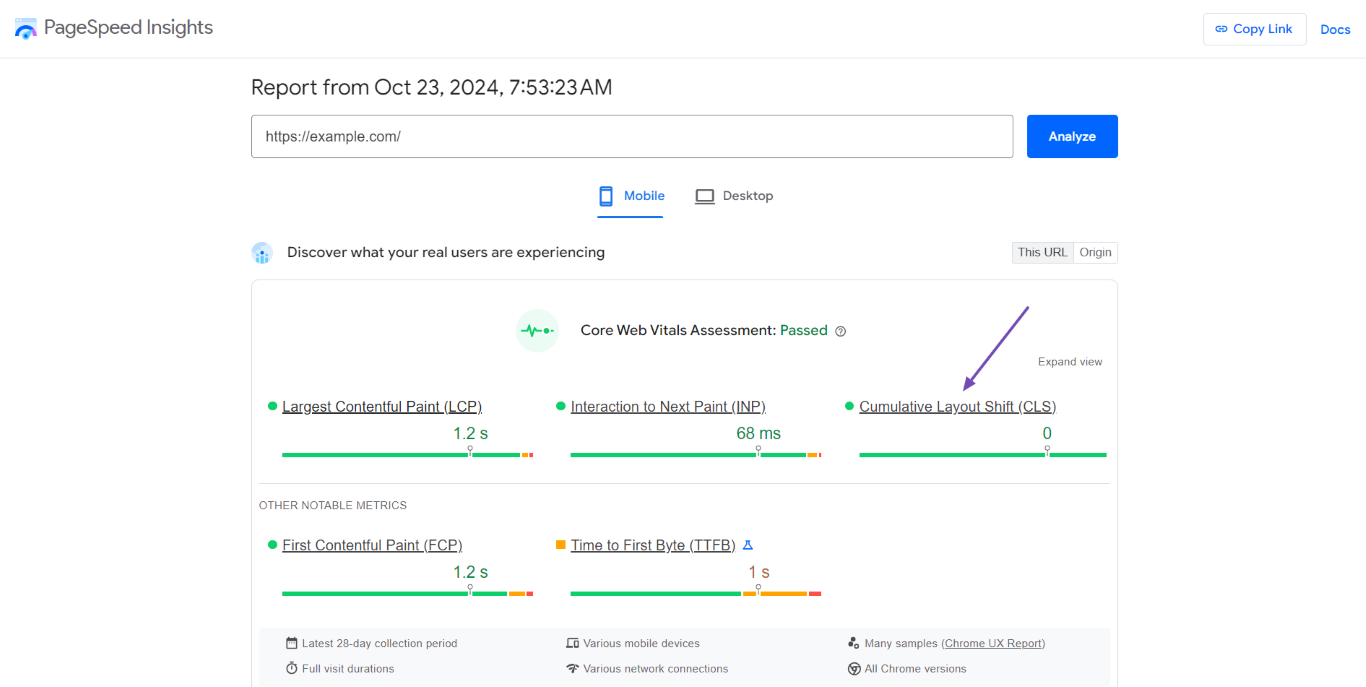
2 Kumulative Layoutverschiebung (CLS)
The Cumulative Layout Shift (CLS) measures the visual stability of a webpage. This is how much the content on the page shifts as the text, images, and other resources on the webpage are loaded. Core Web Vitals report tools categorize the cumulative layout shift into good, needs improvement, or poor.
- Good — 0.1
- Needs Improvement — Over 0.1 but less than 0.25
- Arm — Above 0.25
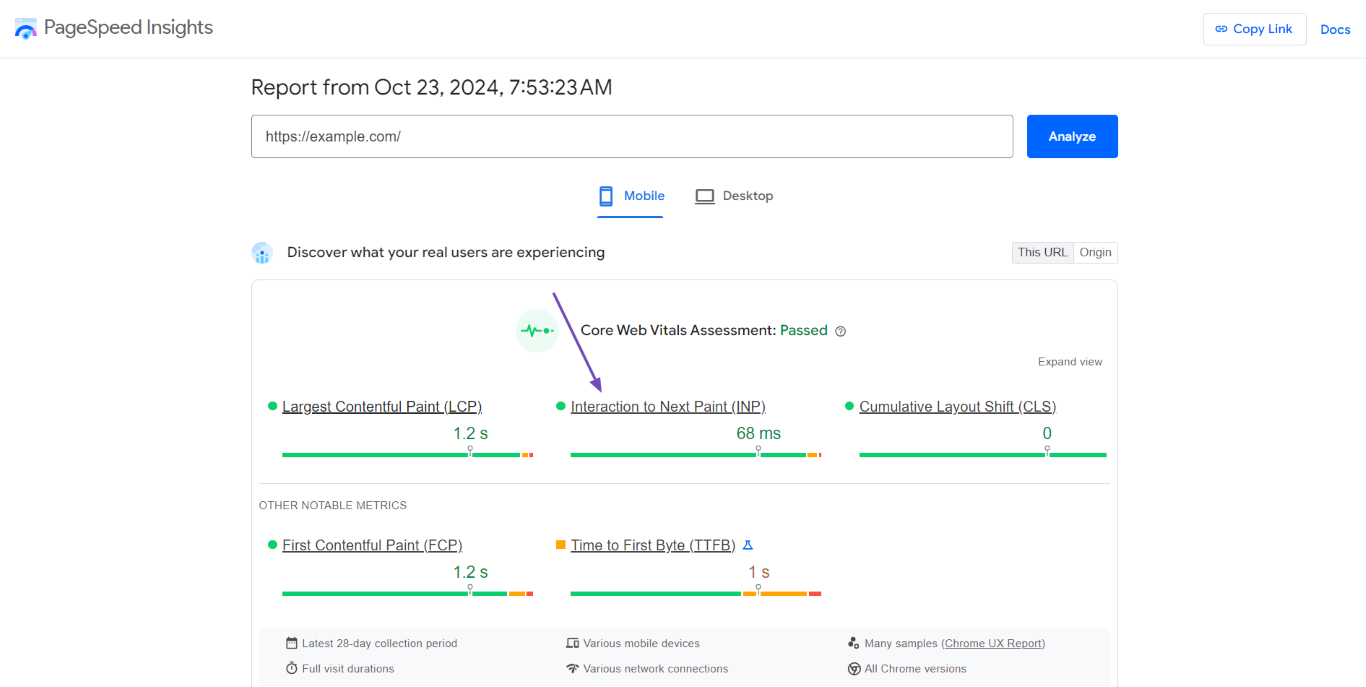
3 Interaktion mit Next Paint (INP)
The Interaction to Next Paint (INP) measures the responsiveness of a webpage. It measures the duration between the moment a visitor clicks, taps, or uses the keyboard to interact with a resource on the page and the moment the page provides visual feedback indicating the interaction was successful.
The Interaction to Next Paint is measured for all interactions on the webpage. The duration of the longest interaction is then reported in the Core Web Vitals as the responsiveness of the entire page. Core Web Vitals report tools categorize the interaction to next paint into good, needs improvement, or poor.
- Good — 200 milliseconds or less
- Needs Improvement — Over 200 milliseconds but less than 500 milliseconds
- Arm — Over 500 milliseconds
How to View Your Core Web Vitals
You can view your Core Web Vitals using various methods, including:
- Chrome DevTools
- Google Search Console
- PageSpeed Insights tool
The data reported by these tools could differ depending on the method by which they were derived and how frequently they are updated. We will discuss how they gather their Core Web Vitals data below.
1 Chrome DevTools
Chrome DevTools (developer tools) are a set of web development and debugging tools built into Chromium-based browsers like Chrome and Brave. It has several features, including one that allows you to inspect your Core Web Vitals.
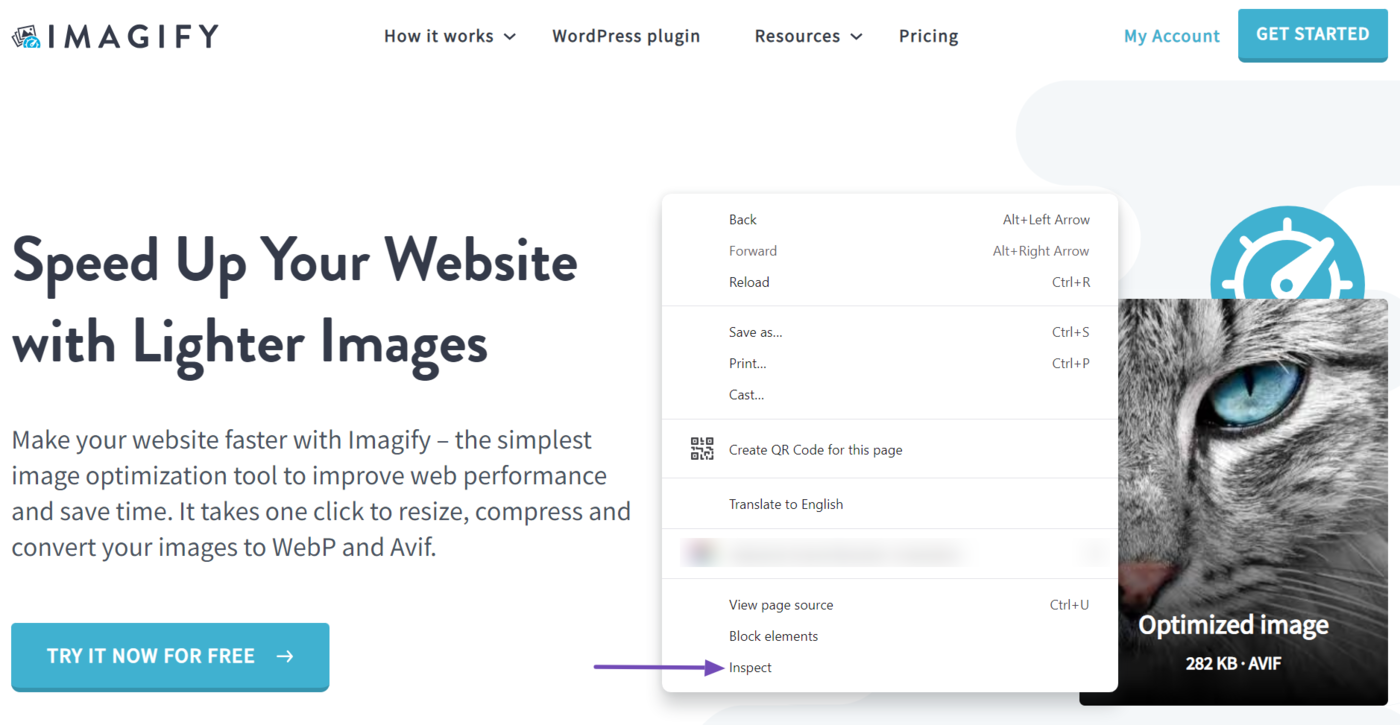
To get started, make sure you are using a Chromium-based browser. Next, right-click any whitespace on the webpage you want to inspect and click Inspect.
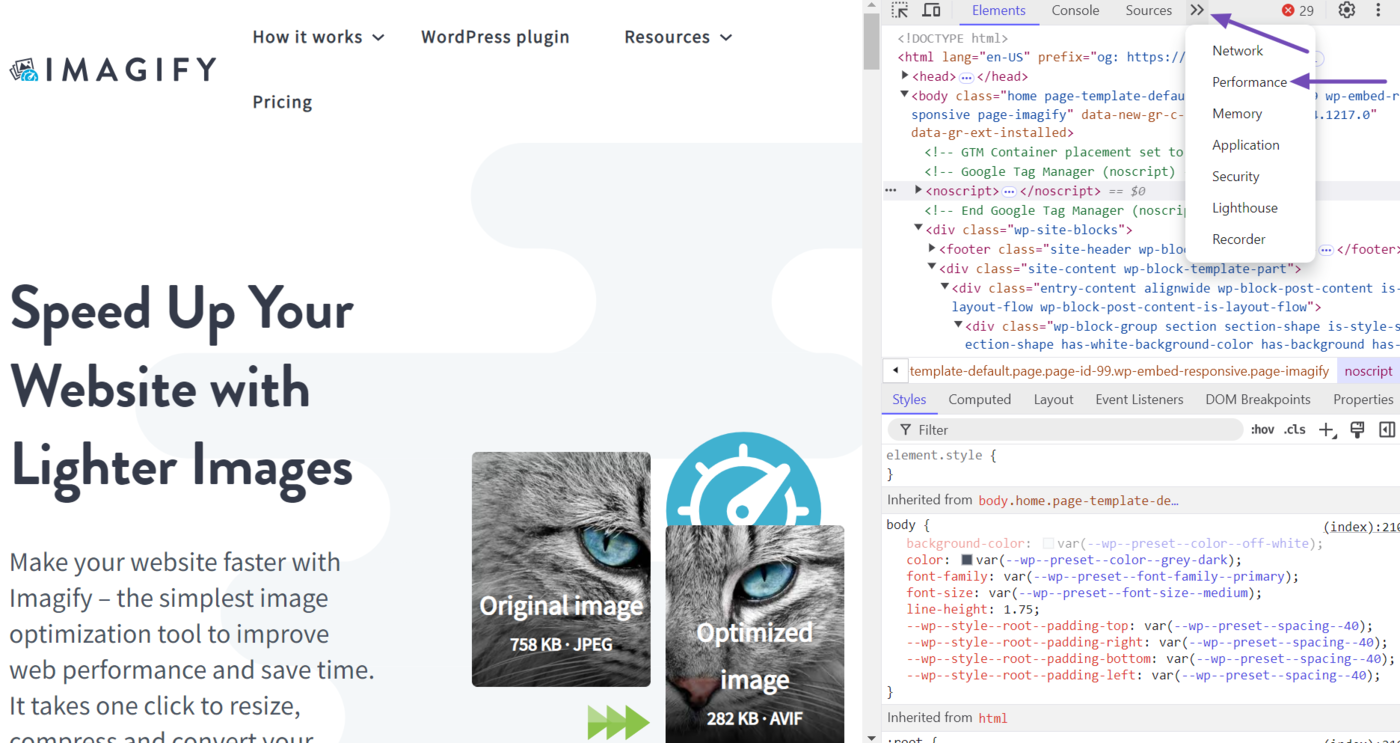
Next, click Leistung in the DevTools toolbar. (If it is not visible, click the double arrow icon » und auswählen Leistung.)
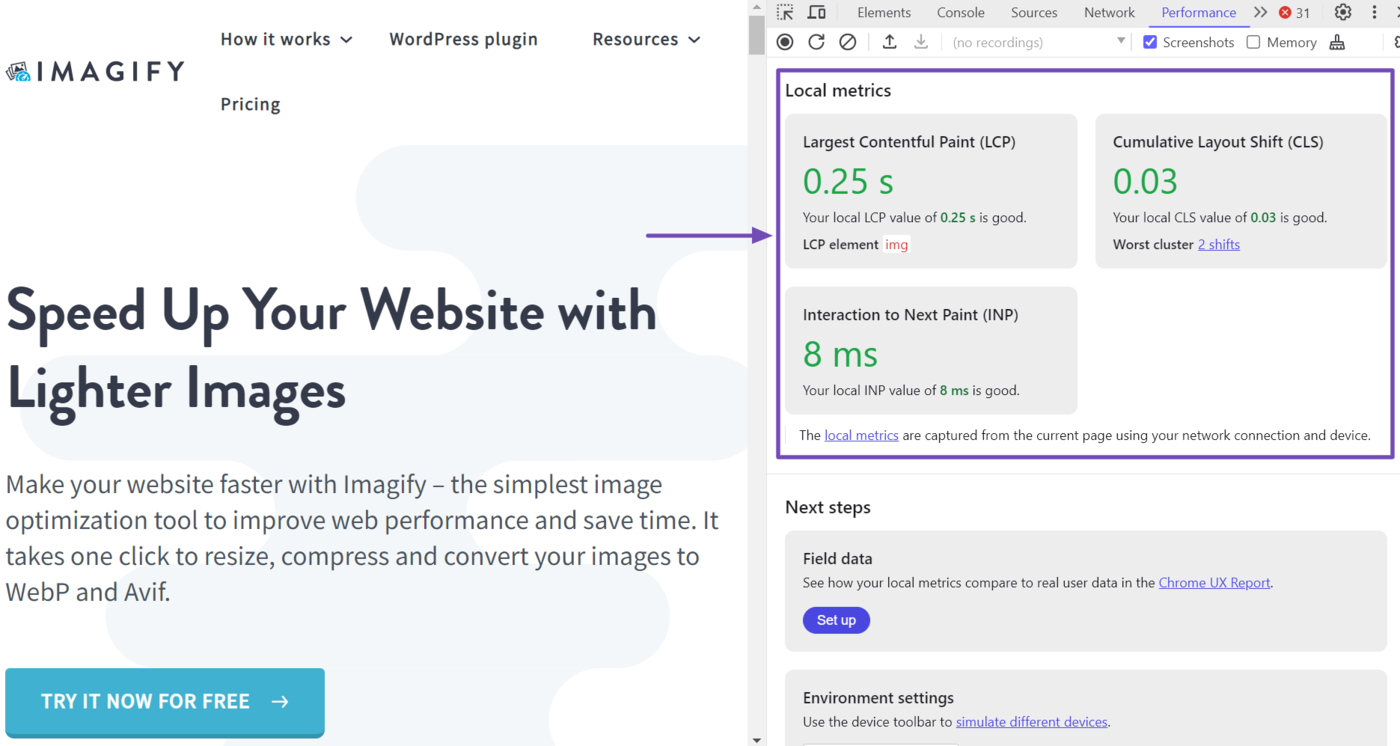
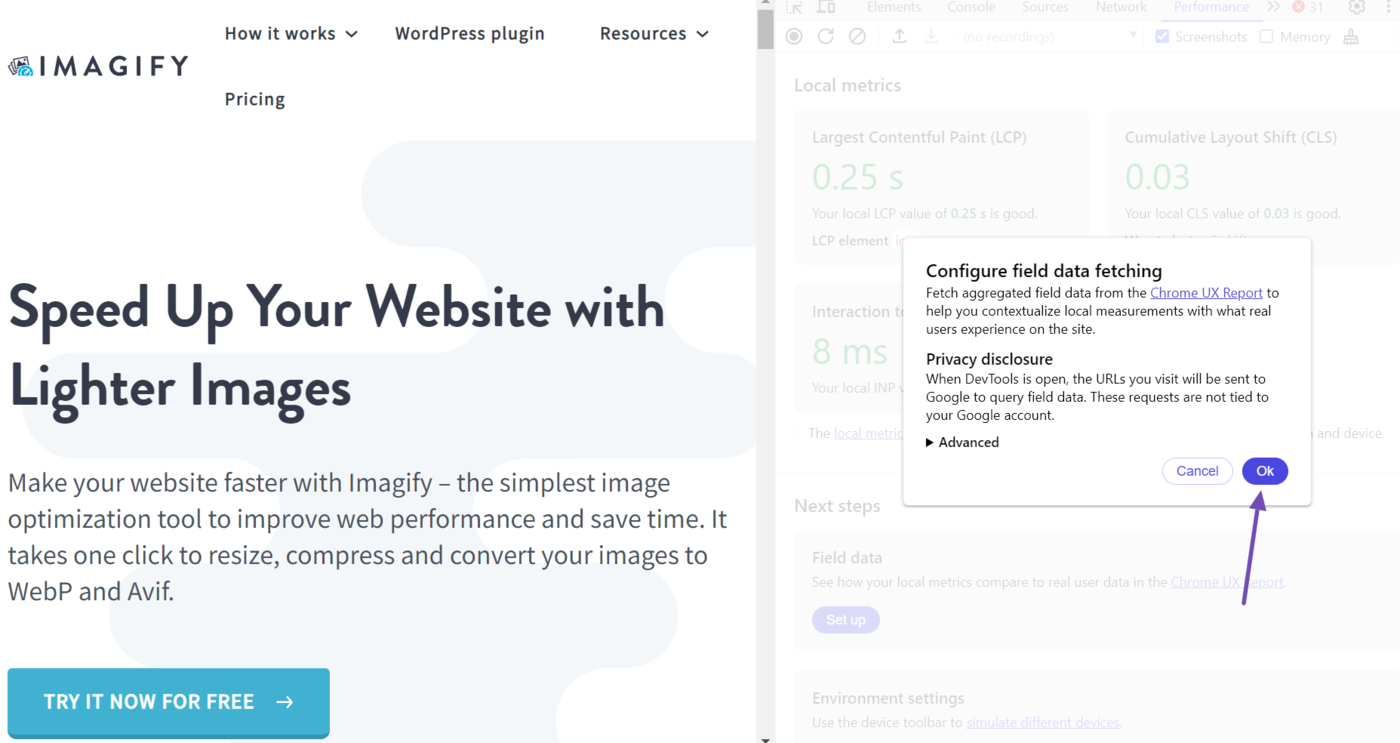
DevTools will display the Core Web Vitals metrics for the page. This report is called your “local metrics” and is based on your current experience on the page. It does not indicate how other visitors experienced the webpage.
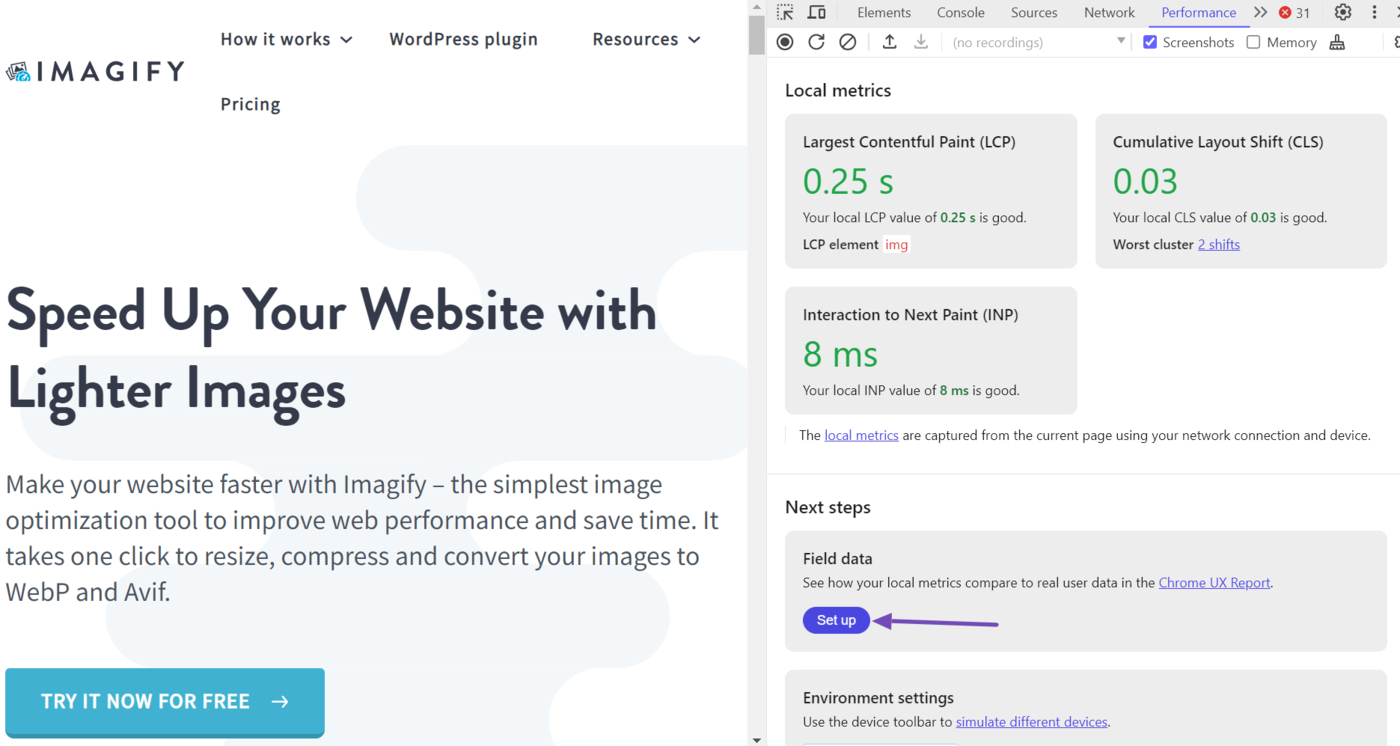
The “field metrics” data shows how other visitors experienced the webpage. To inspect it, head to the Field data area and click Set up.
Google will display a pop-up. Click OK.
Once done, Chrome DevTools will display your field data alongside your local metrics.
2 Google Search Console
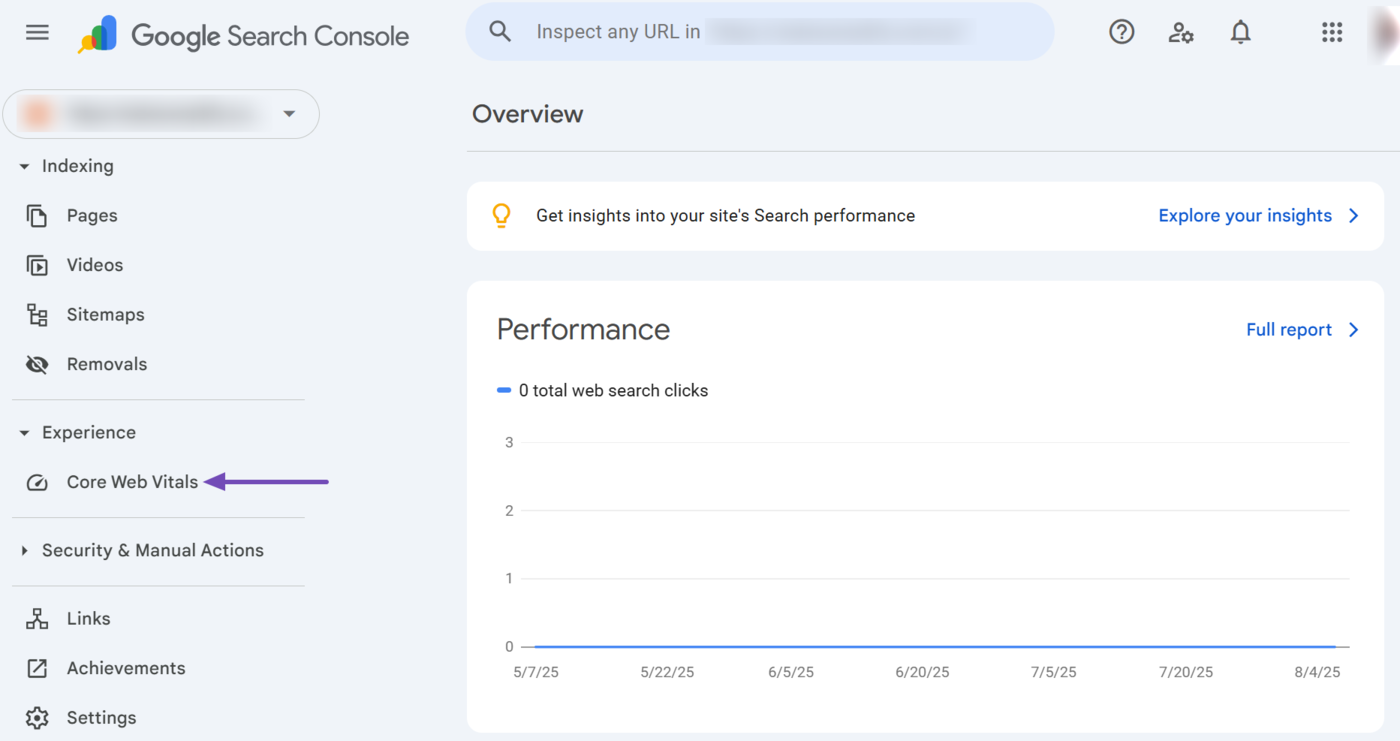
Google Search Console reports the Core Web Vitals from the Chrome User Experience Report (CrUX). This report is gathered from real-life visitors to the page or site over the last 28 days. The data is updated monthly and indicates how real-life visitors experienced your site during their visit.
To access the Core Web Vitals report in Google Search Console, head to your Google Search Console dashboard and click Experience → Core Web Vitals. Google will display the Core Web Vitals report for your webpages.
3 PageSpeed-Einblicke
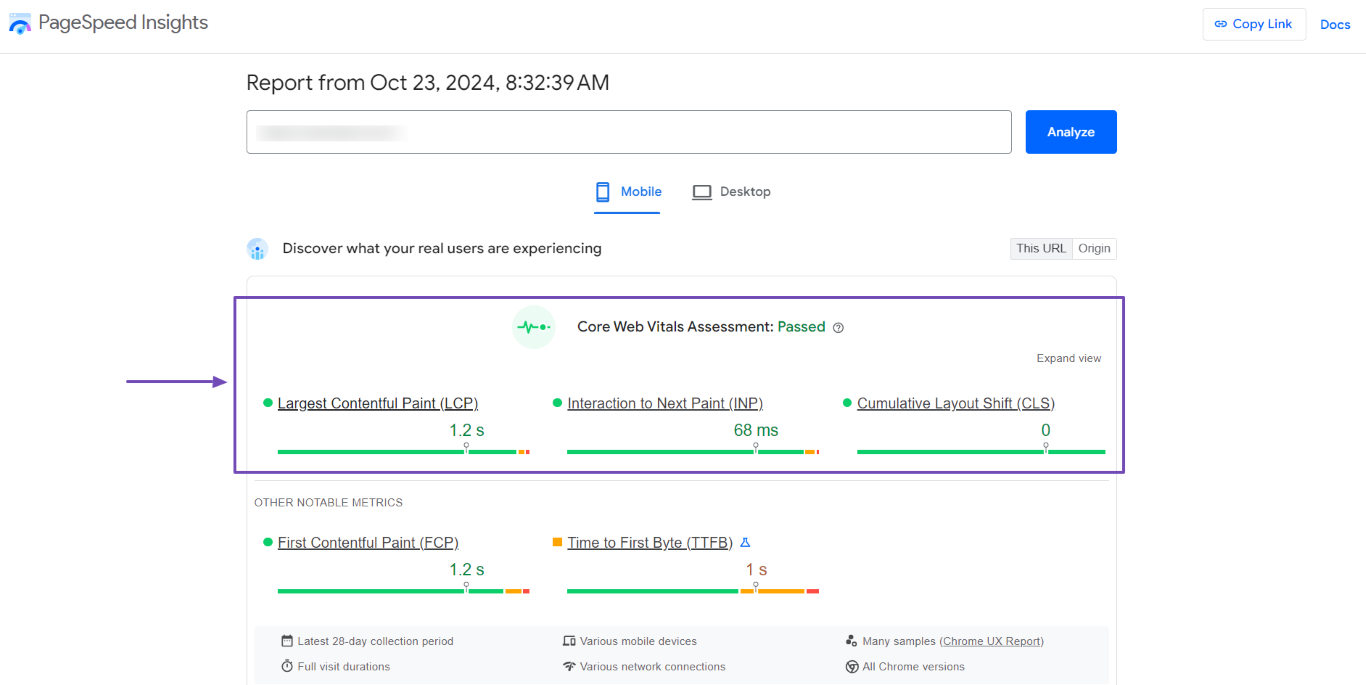
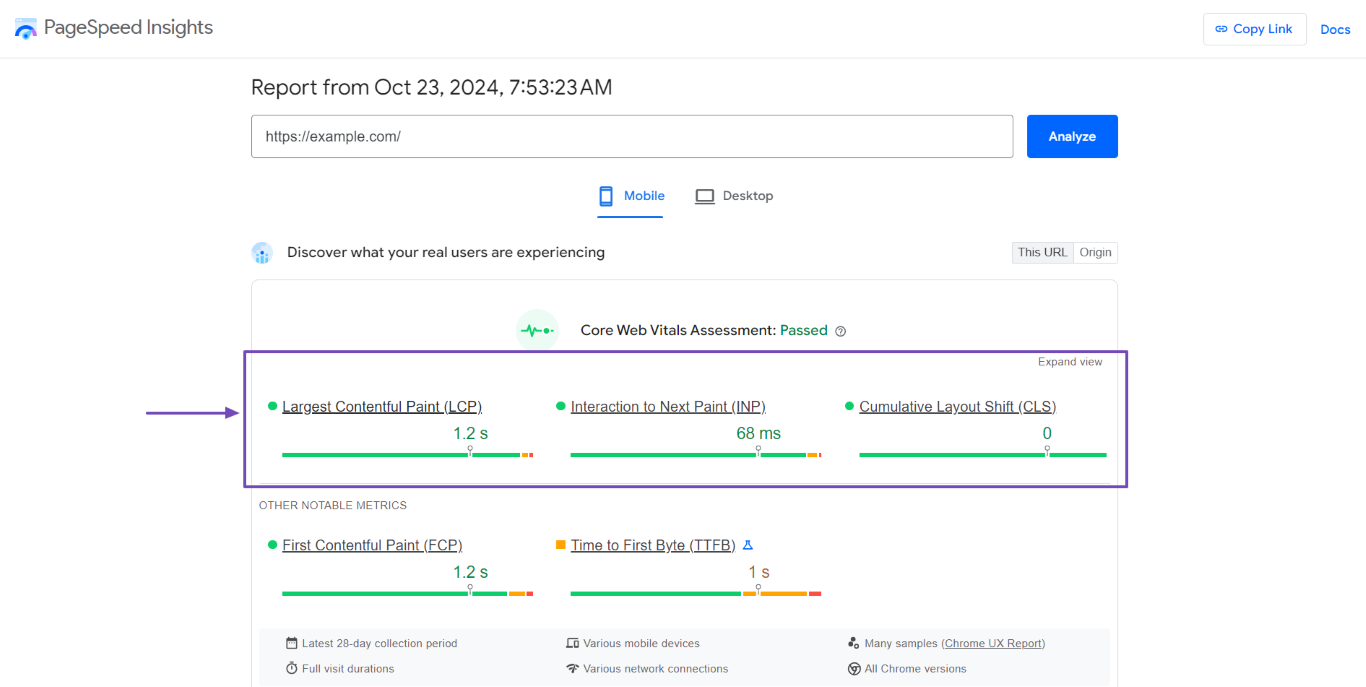
The PageSpeed Insights tool reports a combination of lab data and Chrome User Experience Report data. It reports real-world data for the Core Web Vitals, First Contentful Paint, and Time to First Byte metrics. The data is gathered over the last 28 days and is updated daily.
The lab data is gathered from a stimulated environment that mimics real-world usage. However, while the lab data is great for diagnosing issues, it may not reflect the experience of real-world users.
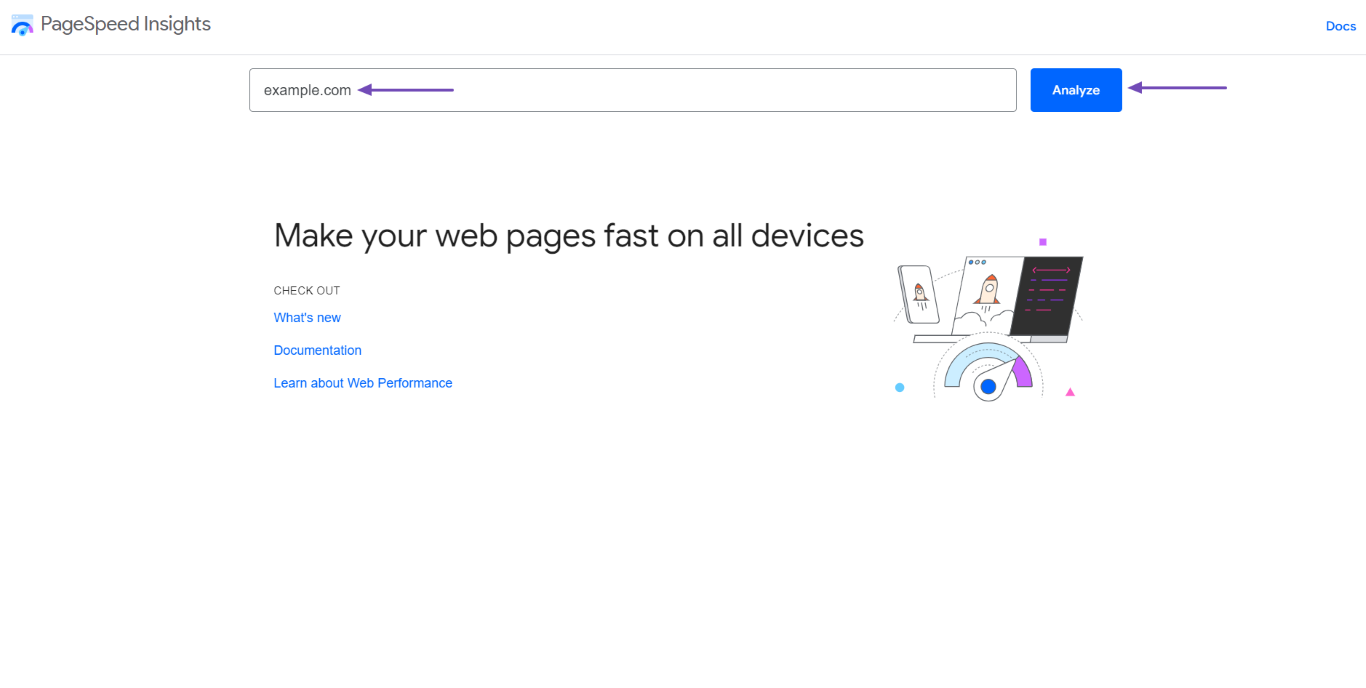
To get started, head to the PageSpeed Insights tool and enter the webpage URL into the available field. Once done, click Analyze.
PageSpeed Insights will return with the Core Web Vitals report for the webpage.
How the Chrome User Experience Report Gathers Your Core Web Vitals
Multiple tools that report on the Core Web Vitals gather their data from the Chrome User Experience Report (CrUX). The Chrome User Experience Report collects this data from real-life visitors to a site. Google then reports this data through multiple Core Web Vitals reporting tools.
This data is collected anonymously, so it cannot be linked to whoever it was collected from. It is also called field data, as it reflects the experience of real-world visitors to your site. This report gives you the best insights into the user experience of real-life visitors to your site.
Google only collects this data from webpages that are available to the public. So, the webpage should not be gated content or require some other form of authentication before it can be accessed. The visitor must also meet specific criteria, including:
- They must have enabled usage statistic reporting that reports on errors and crashes
- They must have signed into their Chrome browser and synced their browser history
- They must not have a sync passphrase that encrypts their synced data
- They must use Chrome running on Android, Windows, Mac, Chrome, or Linux operating systems
